Mobile Vehicle Repair Service Market Size and Share
Market Overview
| Study Period | 2019 - 2030 |
|---|---|
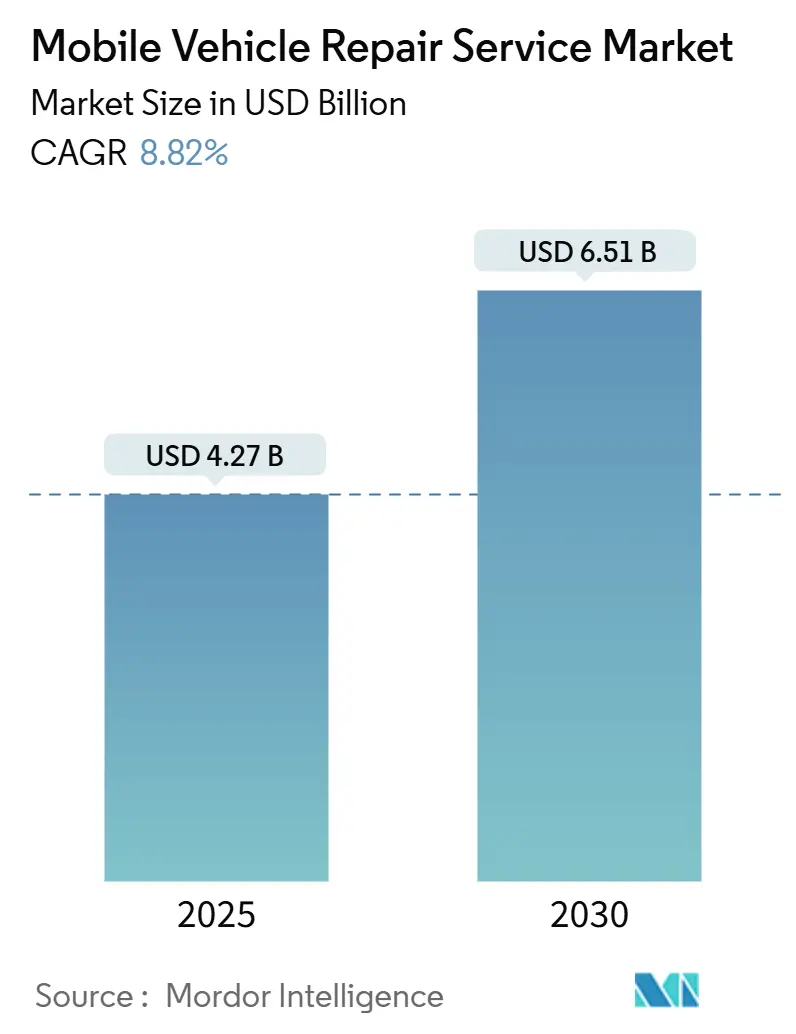
| Market Size (2025) | USD 4.27 Billion |
| Market Size (2030) | USD 6.51 Billion |
| Growth Rate (2025 - 2030) | 8.82% CAGR |
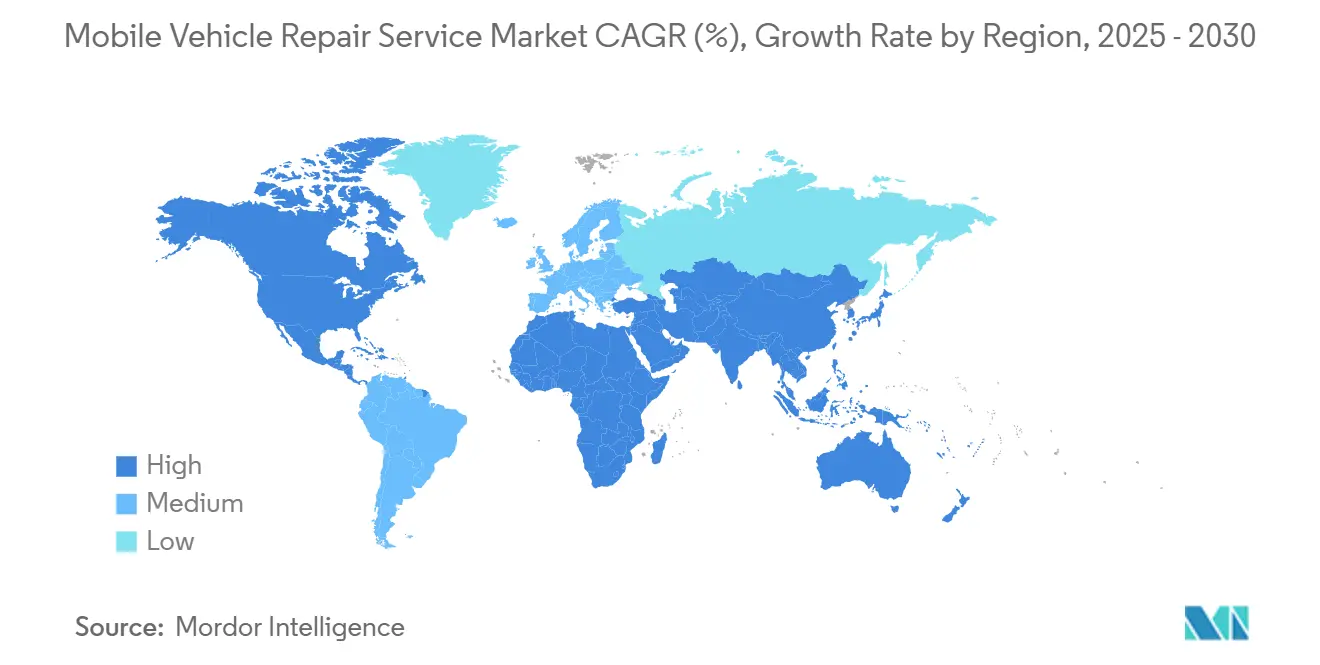
| Fastest Growing Market | Asia Pacific |
| Largest Market | North America |
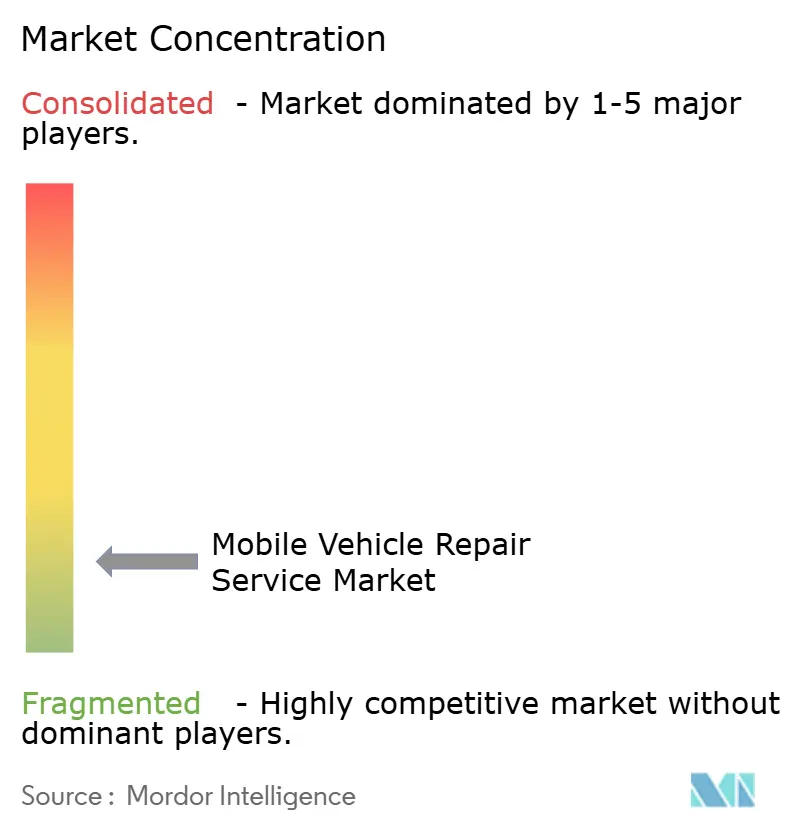
| Market Concentration | Low |
Major Players *Disclaimer: Major Players sorted in no particular order Image © Mordor Intelligence. Reuse requires attribution under CC BY 4.0. | |
Mobile Vehicle Repair Service Market Analysis by Mordor Intelligence
The Mobile Vehicle Repair Service Market size is estimated at USD 4.27 billion in 2025, and is expected to reach USD 6.51 billion by 2030, at a CAGR of 8.82% during the forecast period (2025-2030). Robust growth is anchored in the aging global vehicle parc, which pushes preventive maintenance higher on household budgets and encourages owners to extend fleet life cycles rather than replace assets prematurely. Widespread telematics, factory-installed in three of every four light vehicles sold since 2023, generates remote diagnostics data that mobile providers convert into predictive maintenance visits, improving first-time-fix rates and elevating customer satisfaction. E-commerce and last-mile fleet operators expand outsourced contracts to curb downtime, evidenced by the majority of heavy-duty shops already offering mobile options. At the same time, subscription pricing keeps recurring revenue stable for service vendors. The addressable pool is expanding faster in densely populated urban corridors, but technician shortages and evolving emissions rules remain material constraints, making workforce reskilling and regulatory compliance critical investment priorities.
Key Report Takeaways
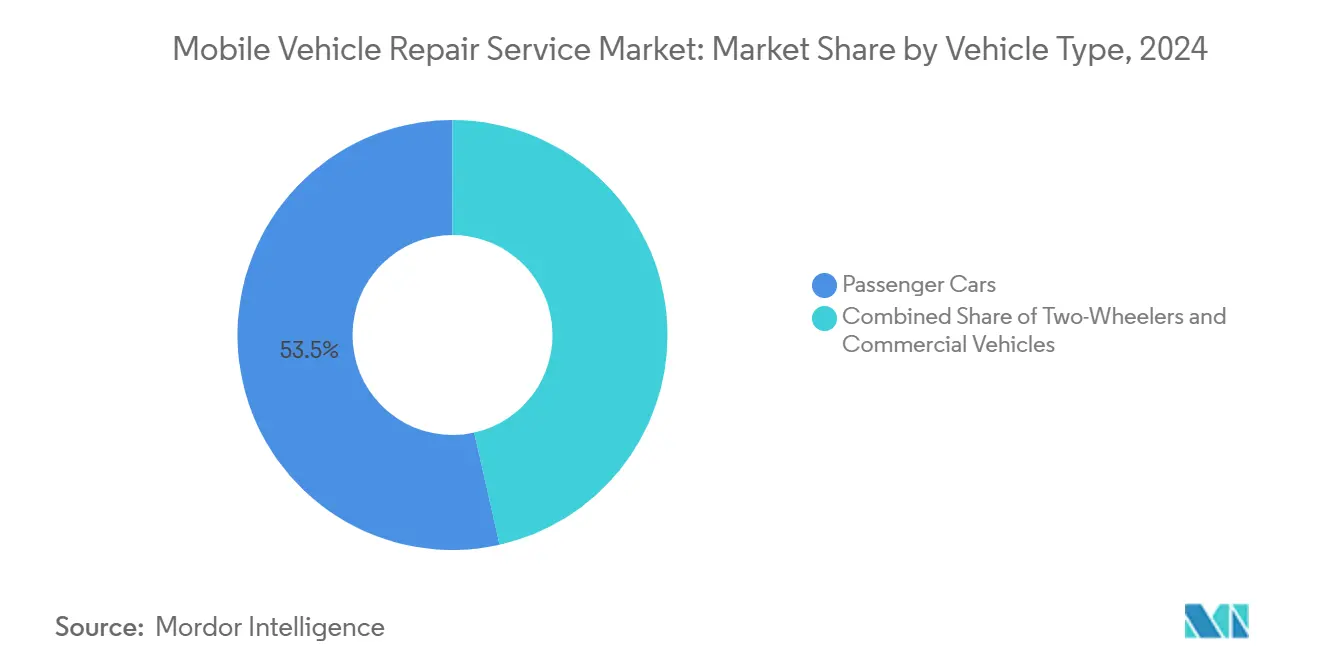
- By vehicle type, passenger cars led with 53.47% of the mobile vehicle repair service market share in 2024; commercial vehicles are poised for the fastest expansion at an 8.87% CAGR through 2030.
- By propulsion type, internal combustion engine models retained 66.28% share of the mobile vehicle repair service market size in 2024, while electric vehicles are projected to post the highest 8.92% CAGR toward 2030.
- By service type, routine maintenance accounted for 36.84% of the mobile vehicle repair service market share in 2024; diagnostic services are set to advance at an 8.95% CAGR over the outlook period.
- By component type, tires captured 38.71% of the mobile vehicle repair service market share in 2024, whereas battery-related work is predicted to register the strongest 8.98% CAGR to 2030.
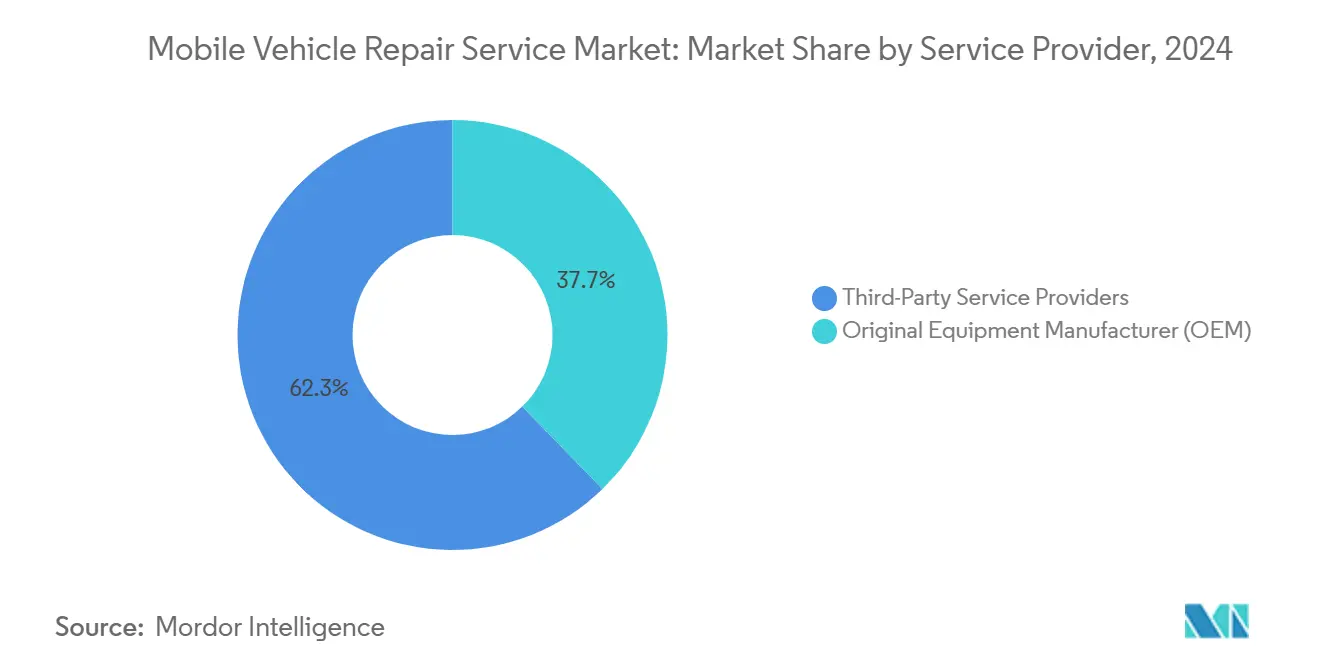
- By service provider, third-party operators dominated with 62.33% of the mobile vehicle repair service market share in 2024, yet OEM-affiliated programs are on track for a 9.03% CAGR through 2030.
- By end-user, individual consumers represented 76.36% of the mobile vehicle repair service market share in 2024; fleet owners constitute the fastest-growing cohort at a 9.07% CAGR.
- By geography, North America contributed 42.18% of the mobile vehicle repair service market share in 2024, while Asia-Pacific is forecast to deliver the quickest 8.91% CAGR up to 2030.
Global Mobile Vehicle Repair Service Market Trends and Insights
Drivers Impact Analysis*
| Driver | (~) % Impact on CAGR Forecast | Geographic Relevance | Impact Timeline |
|---|---|---|---|
| Aging Vehicle Parc | +2.1% | Global, particularly North America and Europe | Medium term (2-4 years) |
| Consumer Preference For Convenience | +1.8% | Global, with higher adoption in urban areas | Short term (≤ 2 years) |
| Growth Of Connected-Car Telematics | +1.5% | North America, Europe, and developed Asia Pacific markets | Medium term (2-4 years) |
| Fleet Outsourcing By E-Commerce | +1.3% | Global, concentrated in major metropolitan areas | Short term (≤ 2 years) |
| Low-Emission Repair-Zone Mandates | +1.1% | Europe, select North American cities, developed Asia Pacific urban centers | Medium term (2-4 years) |
| Subscription-Based Mobile Maintenance Bundles | +0.9% | North America, Europe, major Asia Pacific cities with ride-hailing penetration | Long term (≥ 4 years) |
| Source: Mordor Intelligence | |||
Aging Vehicle Parc Boosts Maintenance Demand
The average U.S. light vehicle age is expected to reach 13 years by 2026, and nearly half of repairable claims in early 2025 involved units older than seven years[1]“U.S. Vehicle Age Trends,” Bureau of Transportation Statistics, bts.gov . Shrinking new-car inventories after pandemic-era supply shocks pushed owners to extend operating lives, lifting annual repair spending to USD 1,200–USD 2,500 on mid-age cars, with premium brands at the upper end. Dealers captured part of this spend, yet mobile providers accelerated share gains by positioning on-site maintenance as a less disruptive, lower-cost alternative. Higher parts prices on aging vehicles further incentivize repair over replacement, turning the mobile vehicle repair service market into a critical channel for value-conscious households.
Consumer Preference For Convenience & On-Site Service
Platform-enabled scheduling removes queuing and travel time, which surveys rank as top pain points when booking traditional workshops. During pandemic restrictions, dealerships such as Autobahn BMW Fort Worth deployed mobile vans to preserve service revenue and customer loyalty, demonstrating that remote interaction and digital updates meet modern communication expectations. Text-based job status updates reached the highest satisfaction scores in the 2025 aftermarket service index, reinforcing a mobile-first mindset. Operators continuously refine dispatch algorithms to reduce dead-head mileage because every saved travel minute directly lifts productivity and technician earnings.
Growth Of Connected-Car Telematics Enabling Remote Diagnostics
Embedded telematics rose to three-fifths penetration in 2023 vehicle sales and now supplies mobile technicians with real-time diagnostics before vans roll out. Regulatory momentum continues with the U.S. Connected Vehicles Rule, effective March 2025, which mandates cybersecurity and supply-chain traceability for electronic components[2]“Connected Vehicle Rule; Docket No. NHTSA-2025-0012,” Federal Register, federalregister.gov . Early fault codes allow parts pre-picking and shorter repair cycles, while remote over-the-air software updates add a revenue layer that complements physical labor. Video telematics feeds driver-behavior analytics into maintenance schedules, reducing roadside failures and optimizing fleet wellness.
Fleet Outsourcing By E-Commerce & Last-Mile Operators
Heavy-duty shops report that more than four-fifths now provide mobile callouts as parcel carriers and grocery delivery fleets push for 24/7 uptime. Subscription bundles modeled on Truck-as-a-Service shift capex to opex, coupling guaranteed response times with asset management dashboards. Specialist firms such as Slick focus solely on mobile fleet upkeep, combining IoT diagnostics, field inventory staging, and SLA-backed turnarounds that keep vans, step-trucks, and class-8 tractors in revenue service. Sustainability KPIs enter the negotiation table, with contracts rewarding vendors that minimize idling and optimise technician routing.
Restraints Impact Analysis*
| Restraint | (~) % Impact on CAGR Forecast | Geographic Relevance | Impact Timeline |
|---|---|---|---|
| Shortage Of Certified Mobile Technicians | -1.4% | Global, particularly acute in developed markets | Long term (≥ 4 years) |
| Lower Maintenance Needs Of Battery-Electric Vehicles | -0.8% | Regions with high EV adoption rates | Medium term (2-4 years) |
| City Restrictions On Roadside Work Zones | -0.6% | Urban areas globally, particularly dense metropolitan regions | Short term (≤ 2 years) |
| Cyber-Security Liability | -0.4% | Global, with stricter enforcement in North America and Europe | Medium term (2-4 years) |
| Source: Mordor Intelligence | |||
Shortage Of Certified Mobile Technicians
The sector faces a projected deficit of automotive technicians by 2024, while only fairly decent mechanics presently hold EV accreditation, equal to just more than a percent of the U.S. workforce[3]“Electric Vehicle Service Technician Certification Program,” SAE International, sae.org . Field roles demand broader diagnostic autonomy and physical adaptability because vans carry limited tooling compared with fixed workshops. Emerging certification tracks from groups such as SAE and Goodwill’s EV Tech program aim to standardize competencies and improve diversity, yet awareness among independents remains low. Competitive wage offers around USD 30 per hour lure candidates, but retention hinges on continuous upskilling and access to digital troubleshooting resources.
Lower Maintenance Needs Of Battery-Electric Vehicles
Electric drivetrains remove oil changes and exhaust repairs, dropping routine maintenance costs for gasoline. Regenerative braking extends pad life, while fewer moving parts cut wear points, shrinking visit frequency for mobile crews. Counterbalancing this decline, high-voltage battery diagnostics, thermal-management service, and over-the-air firmware upkeep add new revenue categories that reward vendors investing in specialized tools. Early fleet adopters report higher repair bills at rental operator Hertz for more than half—due mainly to costly battery modules. Still, component prices tend to fall as scale builds and recycling networks mature.
*Our forecasts treat driver/restraint impacts as directional, not additive. The impact forecasts reflect baseline growth, mix effects, and variable interactions.
Segment Analysis
By Vehicle Type: Commercial Fleets Drive Mobile Adoption
Passenger cars commanded 53.47% of the mobile vehicle repair service market share in 2024 and continue to anchor day-to-day booking volume. The segment’s installed base is vast, and owner reliance on convenient doorstep repairs underpins predictable workload distribution across suburban catchment areas. However, commercial vehicles are accelerating at an 8.87% CAGR, and their higher ticket sizes skew the revenue mix. Fleet contracts stipulate stringent uptime thresholds, pushing vendors to integrate telematics data streams for proactive part staging and to employ shift-based technician teams that align with delivery windows.
Growth in the commercial cohort mirrors soaring e-commerce parcel counts and adds complexity through mixed propulsion fleets, including diesel, CNG, and electric vans. The mobile vehicle repair service market tied to fleet packages rises faster than unit volumes alone, buoyed by subscription pricing, consolidated invoicing, and penalties for missed KPIs. Two-wheelers, especially in dense Asian cities, form a niche yet strategically important vertical because gig-economy riders value lightning-fast tire and brake fixes executed curbside.


By Propulsion Type: Electric Transition Reshaping Service Models
Internal combustion engine units represent 66.28% of the mobile vehicle repair service market share in 2024, sustaining demand for oil changes, fueling system repairs, and emissions-related replacements. The segment’s durability stabilizes baseline workload, giving vendors predictable cash flow. Conversely, electric vehicles expand at an 8.92% CAGR through 2030 as national zero-emission deadlines tighten. Reduced fluid service lowers visit frequency, but battery conditioning, software calibration, and cooling-loop maintenance introduce high-margin tasks that only certified crews can perform.
The mobile vehicle repair service industry wrestles with divergent tooling needs: torque-controlled lifting platforms for ICE work versus insulated gloves and high-voltage multimeters for EV diagnostics. Venture-backed start-ups such as Kinetic Automation deploy robotic calibration rigs inside compact vans, cutting ADAS alignment times and differentiating through cloud-linked service logs. As charging infrastructure proliferates, rural breakdown coverage becomes a competitive differentiator, prompting operators to stage portable DC fast chargers for roadside rescue.
By Service Type: Diagnostics Emerge as Growth Driver
Routine maintenance formed 36.84% of the mobile vehicle repair service market share in 2024, reflecting bread-and-butter services like fluid exchange, wiper replacement, and tire rotation. These high-frequency jobs build customer relationships and funnel vans into neighborhoods where upsell opportunities arise. Diagnostic services, however, outpace all others at an 8.95% CAGR because modern vehicles embed more than 100 electronic control units requiring scan-tool interrogation. ADAS calibration after windshield replacement or bumper repair now mandates millimeter-precise setups even in driveway environments.
Cloud dashboards unify fault-code history, allowing follow-up reminders that pace component replacement just before failure points, thus lifting customer lifetime value. The mobile vehicle repair service market size attributable to scans rises as insurers demand pre- and post-repair documentation to validate claims. Emergency repairs remain steady, fueled by roadside tire damage and starter motor failures, while bundled “tire plus brake” subscriptions sustain visit cadence and smooth cash flow.
By Component Type: Battery Services Lead Innovation
Tires account for 38.71% of the market share of the mobile vehicle repair service's component segment in 2024 because replacement intervals are predictable, and field installation is straightforward using portable balancers. High-volume urban zones let technicians close four or more tire calls per shift, maximizing van utilization. As vehicle electrification accelerates, battery work, spanning traditional 12 V and traction packs, achieves the quickest 8.98% CAGR. Safe pack removal and thermal diagnosis require specialized lifts and infrared imaging, commanding premium pricing that offsets longer job cycles.
The emergence of swap-ready commercial EVs creates a parallel logistics layer where vendors manage charged-battery inventories, mirroring propane swap models. Brake systems benefit from on-site rotor resurfacing rigs that shave downtime for medium-duty fleets. Engine components, though gradually ceded to electrification, still sustain sizeable business in regions where ICE bans are distant, keeping multiskilled teams essential to service-mix flexibility.
By Service Provider: Third-Party Dominance Continues
Independent specialists captured 62.33% of the mobile vehicle repair service market share in 2024, aided by lean overheads, multi-brand versatility, and algorithm-driven job allocation that compresses response windows. Their geographic agility attracts consumers and fleet managers who value one-invoice coverage across mixed vehicle portfolios. OEM-backed programs, however, log the briskest 9.03% CAGR as automakers view mobile service as a loyalty lever that safeguards warranty retention. Tesla set precedent with remote Ranger teams, and mainstream brands now pilot similar offerings through franchise dealers.
Third-party platforms like YourMechanic aggregate for over a million completed jobs and uphold high NPS via transparent quotes and real-time tracking. In response, OEM ecosystems invest in proprietary parts logistics and EV-specific upskilling to narrow the service convenience gap. Co-opetition is emerging, where independents secure sub-contract work during recall surges, while automakers reciprocate by licensing diagnostic software under controlled environments.
By End-Users: Fleet Growth Accelerates
Individual owners accounted for 76.36% of the mobile vehicle repair service market share in 2024, confirming that driveway convenience remains the channel's cornerstone. Pandemic-era contactless protocols habituated many drivers to mobile care and diminished their loyalty to fixed sites. Price transparency, instant e-wallet payment, and digital maintenance records lock in repeat visits. Fleets, representing parcels, food, and HVAC service vans, expand at a 9.07% CAGR because every idle minute translates into lost revenue.
Contracts stipulate night or weekend windows, prompting vendors to organize shift-swaps and consolidate parts depots near logistics hubs. Analytics-driven scheduling integrates telematics fault alerts with technician availability, enabling zero-touch maintenance that coincides with off-duty hours. As fleet electrification rises, onsite charging diagnostics and software updates stack atop conventional tasks, widening share-of-wallet for mobile specialists.
Geography Analysis
North America contributed 42.18% of the mobile vehicle repair service market share in 2024, propelled by a vehicle population with an average age of 12.8 years and high per-capita ownership. Regulatory measures such as the Connected Vehicles Rule favor local service ecosystems that comply with cybersecurity sourcing mandates. U.S. operators refine van inventory algorithms around suburban commuting patterns, whereas Canada’s dispersed population values coverage in remote communities where the nearest dealership may sit several hundred kilometers away. California’s tighter emissions standards create niches for certified low-emission mobile repair fleets with particulate-capture service rigs and zero-idle policies.
Asia-Pacific posts the fastest 8.91% CAGR, underpinned by urbanization and rising disposable income in India, China, and Southeast Asia. India’s GoMechanic scales to 600 workshops across more than 50 cities, illustrating how hybrid hub-and-spoke networks blend fixed bays for heavy jobs with vans for light work. China’s dominance in EV production cascades into demand for high-voltage battery mobile expertise—including cooling loop flushing and software patching—while local ride-hailing fleets contract mobile vendors to uphold government uptime mandates. Japan and South Korea leverage mature telematics infrastructure and high smartphone penetration to promote in-app live tracking for rural service calls, cementing consumer trust in mobile solutions.
Europe maintains balanced growth, balancing aging ICE fleets with accelerating EV uptake spurred by Zero-Emission Zones that debuted in Dutch cities in January 2025. EU Regulation 2024/1257 tightens type-approval on battery durability, compelling mobile providers to certify test equipment and retain calibration logs. The United Kingdom’s ClickMechanic platform illustrates robust demand for vetted independent technicians who supply fixed quotes and photo evidence, sustaining platform fees even amid macro headwinds. Germany’s Mittelstand garages complement in-store work with mobile spinouts, while French and Italian operators collaborate with roadside assistance clubs to access nationwide dispatch networks.

Competitive Landscape
The mobile vehicle repair service market remains moderately fragmented, with technology-enabled networks coexisting alongside thousands of regionally focused independents. Low capex for a service van lowers entry barriers, but scale rewards accrue to platforms that unify booking, parts procurement, and customer communication in a single stack. YourMechanic pioneered the marketplace template and has now integrated van telematics for real-time ETA visibility, improving first-visit resolution and customer retention. Wrench accelerated national coverage by acquiring peers, consolidating technician supply, and layering extended warranties to differentiate beyond price.
Traditional dealership groups, led by AutoNation, countered through branded mobile units equipped for warranty work, ensuring factory parts usage and software compliance. Bosch Auto Service’s franchise expansion contracts in Oklahoma add high-voltage bays and proprietary shop software, underscoring how supplier ecosystems pivot to serve electrification. Venture funding flows into toolmakers like XOi, whose workflow apps guide diagnostics through augmented-reality overlays, shaving job time and standardizing quality. AI-powered predictive maintenance, robotic wheel alignment, and portable DC fast charging emerge as competitive moats, while data security and parts traceability rise to board-level governance as regulations tighten.
Barriers around certified talent sharpen, making workforce development an arena for differentiation. Firms partner with community colleges and veteran transition programs to widen the technician funnel. Subscription service models secure annuity income, reducing churn and elevating enterprise valuations in capital markets eager for SaaS-like recurring revenue. Market consolidation is expected to nibble at fragmentation, but diverse local regulations and parking permit constraints ensure room for specialized regional champions.
Mobile Vehicle Repair Service Industry Leaders
YourMechanic
Wrench Inc.
RepairSmith
Get Spiffy
Mach1 Services
- *Disclaimer: Major Players sorted in no particular order

Recent Industry Developments
- February 2025: XOi secured USD 230 million and acquired Specifx, integrating advanced diagnostic software that accelerates triage and standardizes workflows for mobile technicians.
- November 2024: Bosch Auto Service finalized development rights for 15 franchises in Oklahoma, each outfitted with high-voltage bays and proprietary shop-management suites to support EV growth.
- September 2024: ShopGenie raised USD 4.72 million in Series A funding to embed AI-driven predictive analytics into auto-repair shop management platforms, enhancing decision support for mobile operators.


Global Mobile Vehicle Repair Service Market Report Scope
| Two-Wheelers |
| Passenger Cars |
| Commercial Vehicles |
| Internal Combustion Engine (ICE) |
| Electric |
| Routine Maintenance |
| Diagnostic Services |
| Emergency Repairs |
| Others (Tire Services, etc.) |
| Batteries |
| Tires |
| Brakes & Braking Systems |
| Other Components (Engine, etc.) |
| Original Equipment Manufacturer (OEM) |
| Third-Party Service Providers |
| Individual |
| Fleet Owners |
| North America | United States |
| Canada | |
| Rest of North America | |
| South America | Brazil |
| Argentina | |
| Rest of South America | |
| Europe | Germany |
| United Kingdom | |
| Spain | |
| Italy | |
| France | |
| Netherlands | |
| Rest of Europe | |
| Asia-Pacific | India |
| China | |
| Japan | |
| South Korea | |
| Indonesia | |
| Rest of Asia-Pacific | |
| Middle-East and Africa | United Arab Emirates |
| Saudi Arabia | |
| Turkey | |
| Egypt | |
| South Africa | |
| Rest of Middle-East and Africa |
| By Vehicle Type | Two-Wheelers | |
| Passenger Cars | ||
| Commercial Vehicles | ||
| By Propulsion Type | Internal Combustion Engine (ICE) | |
| Electric | ||
| By Service Type | Routine Maintenance | |
| Diagnostic Services | ||
| Emergency Repairs | ||
| Others (Tire Services, etc.) | ||
| By Component Type | Batteries | |
| Tires | ||
| Brakes & Braking Systems | ||
| Other Components (Engine, etc.) | ||
| By Service Provider | Original Equipment Manufacturer (OEM) | |
| Third-Party Service Providers | ||
| By End-User | Individual | |
| Fleet Owners | ||
| By Geography | North America | United States |
| Canada | ||
| Rest of North America | ||
| South America | Brazil | |
| Argentina | ||
| Rest of South America | ||
| Europe | Germany | |
| United Kingdom | ||
| Spain | ||
| Italy | ||
| France | ||
| Netherlands | ||
| Rest of Europe | ||
| Asia-Pacific | India | |
| China | ||
| Japan | ||
| South Korea | ||
| Indonesia | ||
| Rest of Asia-Pacific | ||
| Middle-East and Africa | United Arab Emirates | |
| Saudi Arabia | ||
| Turkey | ||
| Egypt | ||
| South Africa | ||
| Rest of Middle-East and Africa | ||


Key Questions Answered in the Report
What is the current size and growth outlook for the mobile vehicle repair service market?
The mobile vehicle repair service market was USD 4.27 billion in 2025 and is projected to reach USD 6.51 billion by 2030, marking an 8.82% CAGR.
Which vehicle segment will expand the fastest through 2030?
Commercial vehicles are expected to grow at an 8.87% CAGR, outpacing passenger cars due to fleet outsourcing and uptime requirements.
How does electrification influence mobile repair demand?
While lower routine maintenance reduces visit frequency, EV adoption unlocks new revenue in battery diagnostics, software updates, and high-voltage safety inspections, supporting long-term mobile service growth.
Why are third-party providers leading the channel?
Independent platforms hold a 62.33% share because they offer multi-brand coverage, flexible scheduling, and transparent pricing that resonate with consumers and fleet managers.
Which region presents the most substantial growth potential?
Asia-Pacific is set to record an 8.91% CAGR to 2030, driven by rising vehicle ownership and urban demand for on-site convenience in India, China, and Southeast Asia.
Page last updated on:


