
Automotive Transmission Repair Market Size and Share
Market Overview
| Study Period | 2020 - 2031 |
|---|---|
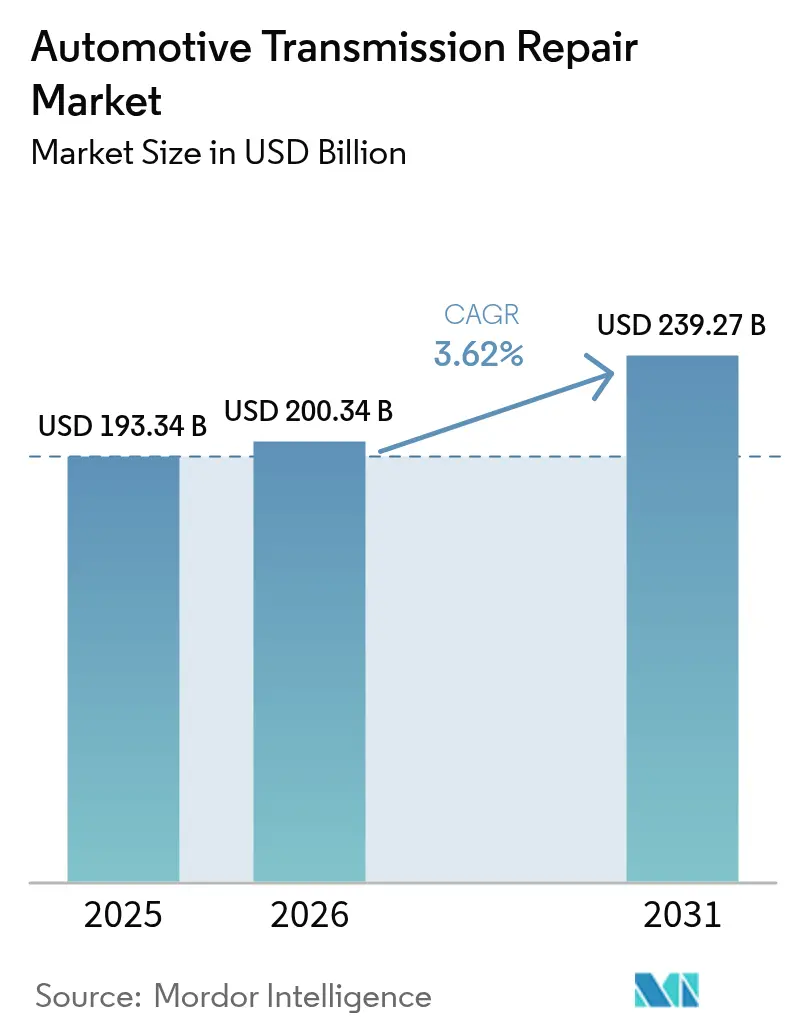
| Market Size (2026) | USD 200.34 Billion |
| Market Size (2031) | USD 239.27 Billion |
| Growth Rate (2026 - 2031) | 3.62 % |
| Fastest Growing Market | Asia Pacific |
| Largest Market | North America |
| Market Concentration | Medium |
Major Players *Disclaimer: Major Players sorted in no particular order Image © Mordor Intelligence. Reuse requires attribution under CC BY 4.0. | |
Automotive Transmission Repair Market Analysis by Mordor Intelligence
The Automotive Transmission Repair Market size was valued at USD 193.34 billion in 2025 and estimated to grow from USD 200.34 billion in 2026 to reach USD 239.27 billion by 2031, at a CAGR of 3.62% during the forecast period (2026-2031). Aging vehicle fleets, the growing adoption of automatic gearboxes, and the expansion of extended-warranty programs offset the shift toward electric drivetrains. Fleet operators prioritize repairs over replacements due to high new-vehicle prices and uneven supply chains, while digital platforms reshape service booking and parts sourcing. Transmission fluids and seals see strong demand as modern units rely on specialized lubricants and gasket integrity for durability.
Key Report Takeaways
- By vehicle type, passenger cars led with 57.62% Automotive Transmission Repair Market revenue share in 2025, while light commercial vehicles are forecast to expand at a 3.05% CAGR to 2031.
- By propulsion type, internal combustion engine vehicles held 82.10% of the Automotive Transmission Repair Market share in 2025; electric vehicles exhibited the highest CAGR, at 4.35% through 2031.
- By component, transmission oil accounted for 29.88% of the Automotive Transmission Repair Market's market share in 2025 and is set to advance at a 4.18% CAGR between 2026 and 2031.
- By transmission type, automatic transmissions led with 53.15% Automotive Transmission Repair Market revenue share in 2025, while dedicated EV gearboxes are projected to climb at a 3.22% CAGR through 2031.
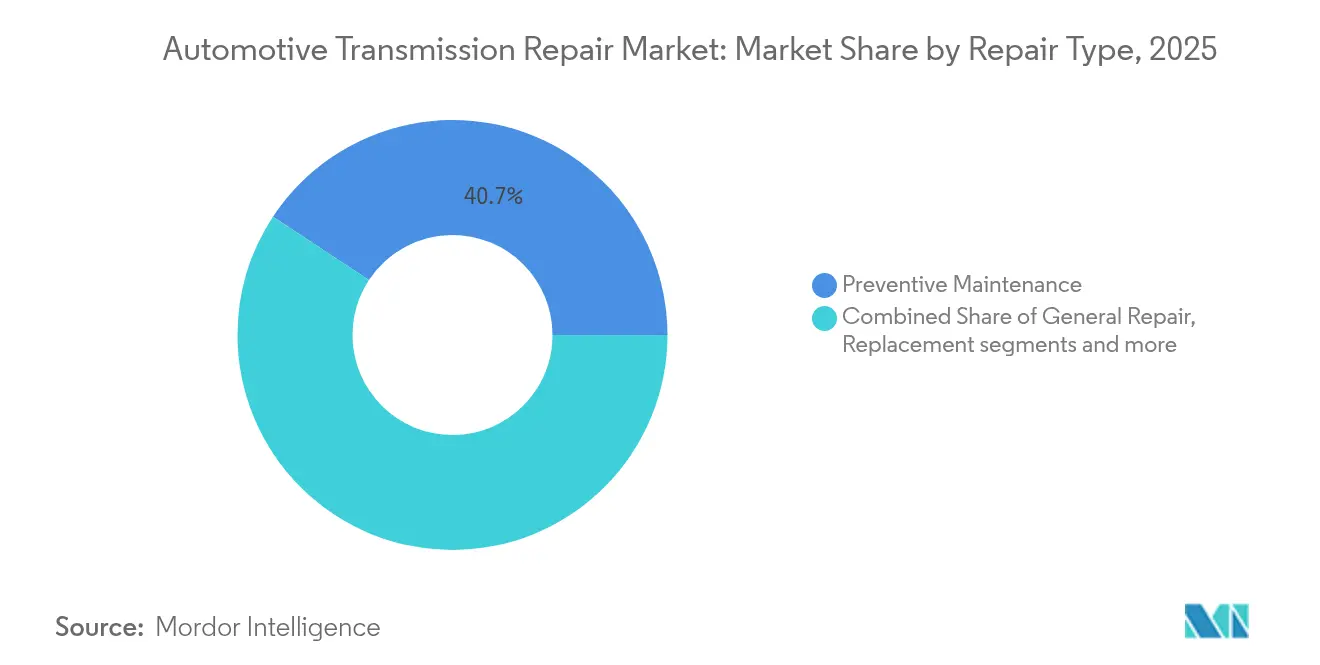
- By repair type, preventive maintenance held a 40.73% in the Automotive Transmission Repair Marketshare in 2025; replacement services are forecast to expand at a 4.92% CAGR over the same period.
- By service provider, Independent garages captured the largest shareat 38.86% in the Automotive Transmission Repair Market in 2025; mobile and online platforms are growing the fastest at 3.88% CAGR through 2031.
- By end-user, individual vehicle owners accounted for 62.88% of Automotive Transmission Repair Market revenue Share in 2025, whereas fleet operators are set to grow at a 5.74% CAGR through 2031.
- By distribution channel, offline outlets still hold 74.72% Automotive Transmission Repair Market's market share of revenue in 2025, whereasOnline channels registerted 4.42% CAGR through 2031.
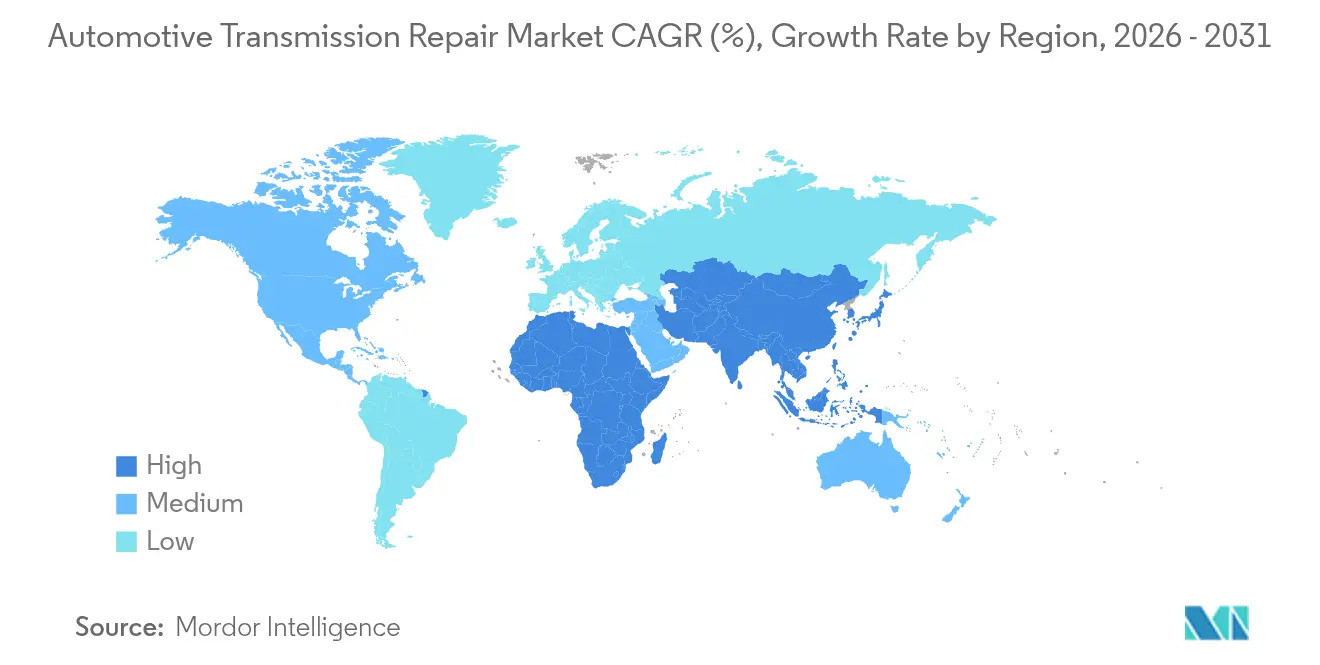
- By geography, North America commanded 36.45% in the Automotive Transmission Repair Market revenue share in 2025, while Asia-Pacific is the fastest-growing region at 6.15% CAGR.
Note: Market size and forecast figures in this report are generated using Mordor Intelligence’s proprietary estimation framework, updated with the latest available data and insights as of 2026.
Market Trends and Insights
Drivers Impact Analysis of Automotive Transmission Repair Market*
| Driver | (~) % Impact on CAGR Forecast | Geographic Relevance | Impact Timeline |
|---|---|---|---|
| Rising Average Vehicle Age | +1.2% | With strongest impact in North America and Europe | Medium term (2-4 years) |
| Rapid Penetration of Automatic & CVT Systems | +0.8% | Asia-Pacific core, spill-over to emerging markets | Long term (≥ 4 years) |
| Expanding Extended Warranty & Service Contract Penetration | +0.6% | North America and Europe primary, Asia-Pacific secondary | Short term (≤ 2 years) |
| Ageing Commercial Delivery Fleets | +0.5% | Global urban centers, concentrated in North America and China | Medium term (2-4 years) |
| Boom in Last-Mile E-Commerce Mileage | +0.4% | Global urban centers, strongest in Asia-Pacific and North America | Short term (≤ 2 years) |
| AI-Enabled Predictive Maintenance Adoption | +0.3% | North America and Europe primary, expanding to Asia-Pacific | Medium term (2-4 years) |
| Source: Mordor Intelligence | |||
Rising Average Vehicle Age Extends Repair Cycles
The global average vehicle age has reached 12.2 years, lengthening repair cycles and lifting the automotive transmission repair market as units wear out at higher mileage. Older automatics fail in intricate patterns that require specialist skills and precision tooling, strengthening the competitive position of established shops. Fleet operators often choose to rebuild over buy a replacement vehicle because the latter remains expensive and the inventory is tight. This decision stabilizes demand for labor-intensive transmission overhauls. Mature repair networks with deep diagnostic know-how capture a larger share of the wallet from high-mileage vehicles.
Rapid Penetration of Automatic & CVT Systems Boosts Service Ticket Sizes
Automatic gearboxes dominate 95% of North American medium-duty fleets, while CVTs and dual-clutch units gain traction in Asia-Pacific passenger segments. These technologies double the average repair invoice compared with manual boxes because they require proprietary fluids, electronic calibration, and advanced tooling. Technicians need additional certifications, which raises labor rates and widens the gap between full-service outlets and small generalist garages. Commercial fleets recognize the operating-cost trade-off: smoother automatics lower driver training expenses, elevate maintenance budgets, and maintain balanced demand.
Expanding Extended Warranty & Service Contract Penetration Drives Scheduled Repairs
Assurant’s automotive warranty revenue jumped exponentially in the first nine months of 2024, illustrating consumers’ growing appetite for protection plans. Contract holders keep to scheduled fluid changes 40% more often than owners without coverage, generating consistent shop traffic for authorized centers. Warranty providers, in turn, partner with transmission franchises to guarantee capacity and uphold satisfaction ratings. The coverage, compliance, and repeat service cycle strengthen baseline volumes even as electrification advances.
Ageing Commercial Delivery Fleets Drive E-commerce Repair Demand
Urban delivery vans accumulate mileage three to four times faster than private cars, accelerating fluid degradation and valve-body wear. Operators adopt mobile repair and predictive maintenance to pre-empt downtime, rewarding shops that offer telematics integration and same-day parts availability. Specialized networks that inventory common failure components for these fleets earn premium margins through service contracts that assure turnaround times.
Restraints Impact Analysis of Automotive Transmission Repair Market*
| Restraint | (~) % Impact on CAGR Forecast | Geographic Relevance | Impact Timeline |
|---|---|---|---|
| Accelerating Shift to EVs | -1.1% | Europe and China primary, North America secondary | Long term (≥ 4 years) |
| High Cost of Advanced Multi-Speed | -0.7% | Global, with acute impact in price-sensitive emerging markets | Short term (≤ 2 years) |
| Proliferation of Sealed "Lifetime" Gearboxes | -0.5% | Europe and North America primary, expanding globally | Long term (≥ 4 years) |
| Urban Mobility Subscriptions | -0.3% | Europe and Asia-Pacific megacities, limited North America adoption | Medium term (2-4 years) |
| Source: Mordor Intelligence | |||
Accelerating Shift to EVs with Fewer Moving Parts
Battery EVs feature single-speed reduction gears that need minimal maintenance, cutting total aftermarket spend by roughly 40% per vehicle. Europe targets 100% EV sales by 2035, compressing long-term volume for traditional gearbox overhauls. Hybrids provide a temporary buffer because they retain multi-speed automatics alongside electric motors, yet they demand new competencies in software diagnostics. Forward-looking shops retrain staff and invest in battery service bays to offset future declines in classic transmission work.
High Cost of Advanced Multi-Speed & Hybrid Transmission Parts
Eight and ten-speed automatics and hybrid gearsets cost 200%–300% more than legacy four-speed components, pushing some owners to scrap or trade in older vehicles rather than undertake repairs. OEMs restrict the distribution of electronic control units, placing independent garages at a disadvantage in terms of pricing and availability. The split funnels late-model vehicles toward dealer service departments while older units remain in the independent channel, shrinking the independent addressable market for next-generation components.
*Our forecasts treat driver/restraint impacts as directional, not additive. The impact forecasts reflect baseline growth, mix effects, and variable interactions.
Automotive Transmission Repair Market Segment Analysis
By Vehicle Type:
Commercial Fleets Accelerate Service DemandPassenger cars hold 57.62% market share in the Automotive Transmission Repair Market, sustaining core volume through sheer fleet size. Light commercial vehicles represent the fastest-growing slice at 3.05% CAGR, fueled by e-commerce. Heavy trucks hold over one-tenth of the share but deliver high ticket values per overhaul, lifting average revenue in the automotive transmission repair market. Frequent stop-start cycles in vans accelerate clutch-pack wear, whereas long-haul trucks need torque-converter replacements and valve-body machining. Predictive analytics lets fleet managers time interventions, smooth workshop capacity utilization, and ensure parts availability. Independent garages integrating telematics data into scheduling can contract directly with delivery firms, locking in multi-year revenue streams.
Commercial fleets also propel investment in mobile service units that perform fluid exchanges and seal replacements onsite. This convenience cuts downtime, a top priority for logistics players. The added capability lets regional repair chains differentiate from single-location shops and earn priority in national maintenance tenders. Consequently, revenue diversity rises, underpinning stable cash flow even during cyclical soft patches in consumer repair spending.




By Propulsion Type:
EV Growth Reshapes Service LandscapeInternal combustion engine cars dominate today with an 82.10% market share in the Automotive Transmission Repair Market, yet the 4.35% CAGR for EVs signals a change in the automotive transmission repair market. Single-speed EV boxes call for lubricant checks and seal inspections rather than clutch or gear replacements, trimming job complexity. Hybrids still rely on conventional multispeed units, but integrating electric motors introduces high-voltage safety protocols that mandate specialized technician certification. Shops investing early in EV safety gear and isolation transformers can charge premium rates because qualified competition remains thin.
Over the forecast period, EV gearbox fluid specification emerges as a niche revenue stream. Fluids must manage higher electrical conductivity and thermal loads, so OEM-approved products command price premiums. Distributors that secure supply agreements for these specialized fluids build insulation against volume declines in traditional ATF products.
By Component:
Transmission Oil Dominates Across SegmentsTransmission oil held 29.88% of the automotive transmission repair market's market share in 2025 and expands at 4.18% CAGR because multi-speed boxes cycle fluid more frequently to cool clutch packs. Synthetic formulations also cost more per liter, lifting revenue per service visit. Gaskets and seals follows just behind, reflecting ongoing need for periodic replacements across all drivetrain types. Electronic control units post double-digit growth as manufacturers embed more sensors that enable predictive maintenance.
Aftermarket suppliers compete on additive technology, viscosity stability, and OEM approvals. Product differentiation allows higher margins than commoditized gear components. Meanwhile, remanufactured torque converters and gearsets gain acceptance as cost-effective options for high-mileage vehicles, supporting circular-economy goals.
By Transmission Type:
Automatics Lead, EVs EmergeAutomatics captured 53.15% automotive transmission repair market's market share in 2025, benefiting from decades of penetration in North America and growing uptake in Asia-Pacific. Manual boxes hold a almost two fifth of the share, largely among value-oriented models and emerging-market fleets. Dual-clutch and CVT systems collectively account for almost close to two fifth of the share, and their intricate mechatronics drive a higher average invoice. Dedicated EV reduction gearboxes grows at 3.22% CAGR, ensuring a gradual pivot in workshop skill sets.
As CVT belts and pulleys require precise calibration tools, medium-sized chains with stronger capital bases outpace smaller independents that cannot justify the equipment cost. Franchise networks that pool capital among outlets therefore gain a structural advantage in attracting late-model vehicles.
By Repair Type:
Preventive Maintenance Leads RevenuePreventive maintenance commanded 40.73% market share in the Automotive Transmission Repair Market in 2025 due to rising awareness of fluid-change intervals. Replacement services, though smaller, log 4.92% CAGR because full-unit swaps become economical for vehicles exceeding 200,000 km. Overhauls contribute more than one tenth of the share and remain labor intensive, supporting workshop utilization during periods of lower walk-in traffic. Warranty providers increasingly stipulate preventive maintenance compliance, steering covered owners toward participating centers and building long-term loyalty.
General repairs, include solenoid and valve-body fixes that often serve as entry jobs for apprentice technicians. These services provide training pathways while generating add-on part sales such as filters and gaskets.
By Service Provider:
Digital Platforms Disrupt Traditional NetworksIndependent garages maintained the largest slice at 38.86% in the Automotive Transmission Repair Market in 2025, but mobile and online platforms are growing the fastest at 3.88% CAGR through 2031, reshaping booking and payment processes in the automotive transmission repair market. OEM-authorized centers keeps a decent share by leveraging warranty capture and software access privileges. Transmission-specialist franchises hold almost close to two fifth of the share with strong brand equity that reassures consumers tackling complex jobs. Quick-service chains, focused on fluid swaps, extend operating hours and add mobile vans to compete with digital startups.
Apps let customers compare quotes, schedule appointments, and track service history, raising transparency standards. Garages that integrate with these platforms gain access to a wider client base without significant marketing spend but must adhere to published service-quality metrics to retain platform visibility.
By End-user:
Fleet Operators Drive Premium ServicesIndividual owners, at 62.88% market share in the automotive transmission repair market, remain the volume bedrock of the automotive transmission repair industry, especially for vehicles aging beyond warranty. Rental and car-sharing fleets demand standardized procedures and rapid key-to-key times to maintain utilization targets. Fleet owners and operators are the fastest-growing user group at 5.74% CAGR due to e-commerce expansion. They value uptime over cost, opting for preventive maintenance contracts that bundle telematics diagnostics with guaranteed turnaround.
Dealership service departments focus on vehicles within factory warranty, posting lower growth as coverage lapses push owners toward independents. Service quality scores influence retention, encouraging dealers to adopt transparent pricing and extended operating hours.
By Distribution Channel:
Online Growth Transforms Parts AccessBrick-and-mortar outlets still hold 74.72% market share in the Automotive Transmission Repair Market because technicians rely on immediate pickup for urgent jobs. Online channels logged a 4.42% CAGR and now make complex components—such as remanufactured valve bodies—available nationwide within 24 hours. Hybrid models emerge, where parts are ordered through e-commerce portals but collected from local depots, balancing price transparency with delivery speed. DIY enthusiasts leverage online tutorials and parts catalogs, yet professional technicians remain primary buyers by value because sophisticated units require coding and warranty validation.
Parts e-tailers partner with logistics firms to offer evening and weekend delivery slots, further compressing repair cycle times and enhancing customer satisfaction metrics for both shops and end users.
Geography Analysis
North America Automotive Transmission Repair Market
North America accounted for 36.45% of revenue share in the automotive transmission repair market in 2025, bolstered by an outsized population of automatic transmissions and strong commercial-fleet density. Cold climates in Canada and northern states accelerate fluid degradation, increasing service intervals. Extended-warranty penetration is also high, channeling work toward certified shops that can upload maintenance records directly to administrators. Investment continues: ZF earmarked USD 700 million for additional U.S. transmission capacity in 2024, illustrating supplier confidence in long-term service demand.
APAC and Europe Automotive Transmission Repair Market
Asia-Pacific is the fastest-growing region at 6.15% CAGR, underpinned by China’s aftermarket pathway toward RMB 2 trillion sales by 2030 and India’s 8% component-industry CAGR through FY 2024. Chinese repairers face dual demand curves: one for aging ICE models and another for a burgeoning EV parc that requires new lubricant formulations for reduction gears. India’s e-commerce logistics boom boosts light commercial vehicle repairs, while government initiatives on scrappage postpone fleet renewals, extending service life. Mature markets like Japan and South Korea invest in robotics and AI diagnostics to counter technician shortages driven by aging workforces.Europe also capture significant market share in 2024, though aggressive emissions targets and EV incentives temper outlook for traditional repairs. Germany contributes roughly 60% of regional automotive value added, sustaining deep expertise in gearbox remanufacturing. Independent aftermarket operators watch regulatory developments closely as the EU considers data-access mandates that could level software access between dealers and independents, preserving competition. The UK adjusts supply chains post-Brexit but still relies on a mature network of reconditioners and parts distributors to serve a diverse fleet of diesel hatchbacks and growing hybrid sales.

Regulatory Landscape
Policy attention relevant to transmission repair is concentrating on right-to-repair style access to diagnostic data, service information, and tooling needed for modern mechatronic gearboxes. In the European Union, Delegated Regulation (EU) 2026/699 amended the vehicle type-approval framework under Regulation (EU) 2018/858, reinforcing standardized access to on-board diagnostics (OBD) and repair and maintenance information, including secure access provisions that shape how independent workshops obtain software functions tied to transmission control units.
In the United States, federal activity during 2026 focused on repair access and compliance boundaries for emissions-related servicing. The US Environmental Protection Agency (EPA) published Freedom to Fix materials in July 2026 that clarified expectations around service information and tools being available on reasonable terms for legitimate repair activity, influencing how aftermarket providers approach electronic diagnostics, calibration, and restoration of emissions functionality when repairs intersect with powertrain controls.
Value Chain Analysis
The transmission repair value chain begins with parts and fluids design and manufacturing (ATF and specialty lubricants, seals, gaskets, clutch packs, mechatronics, TCUs), moves through OEM and aftermarket distribution (national distributors, regional depots, and online platforms), and ends with service execution by OEM-authorized centers, independent garages, quick-service chains, mobile platforms, and transmission-specialist franchises. For complex automatics, CVTs, DCTs, and hybrid gearsets, the chain increasingly depends on software access, calibration tools, and technician training alongside mechanical components, which elevates the role of diagnostic tool vendors and OEM-approved data interfaces.
Recent supplier and OEM programs show localization and electrification altering upstream availability and cost structures, which flow into repair pricing and parts lead times. Examples include ZF agreements in India for 9-speed commercial vehicle transmissions (announced in 2025), BorgWarner securing multi-year DCT-related programs in China (2025), and capacity moves such as VE Commercial Vehicles investment to manufacture Volvo Group 12-speed AMTs in Ujjain, India (announced in 2025). On the product side, suppliers such as Schaeffler and Valeo began volume or commercial production of hybrid and electrified transmission modules in 2026, which expands the installed base of mechatronics-heavy systems that later feed into the aftermarket for fluids, seals, diagnostics, and replacement subassemblies.
Competitive Landscape
The automotive transmission repair market is moderately fragmented. Thousands of independents compete against franchise chains, OEM-authorized centers, and digital-first platforms. Complexity drives segmentation: specialized rebuilds cluster among fewer players with custom machining tools, whereas fluid exchanges remain widely contestable. Strategic focus is shifting toward vertical integration: Transtar invested USD 10 million in inventory to guarantee part availability for its network.[2]“Transtar Industries Expands Inventory with USD 10 Million Investment,” Transtar Industries, transtar1.com ZF enhances service reach by pairing its component plants with training academies that accredit independent technicians.
Digitalization is a decisive differentiator. Platforms that pair real-time diagnostics with booking achieve lower customer-acquisition costs. Allison Transmission’s USD 10 million investment in EnerTech Capital gives it exposure to software startups automating maintenance workflows.[3]“Allison Transmission Invests USD 10 Million in EnerTech Capital,” Allison Transmission, allisontransmission.com White-space opportunities center on EV gearbox servicing, where early movers can charge premium rates because OEM guidance and parts supply remain limited. Franchise systems add mobile vans to capture driveway fluid changes, safeguarding share against app-based upstarts.
Workshop consolidation accelerates as small operators struggle with scan-tool expenses and training fees. Chains acquiring single-location shops gain scale benefits in parts purchasing and marketing. At the same time, OEMs expand fixed-price repair menus to keep post-warranty traffic in house, nudging independents to specialize or join franchises. In mature cities, property costs squeeze stand-alone garages, increasing interest in pop-up bays inside logistics parks that serve ride-hailing and delivery fleets.
Automotive Transmission Repair Industry Leaders
Schaeffler
Allison Transmission
Borgwarner
ZF
Mister Transmission
- *Disclaimer: Major Players sorted in no particular order

Automotive Transmission Repair Market Companies Covered in this Report
- ZF Friedrichshafen AG
- Allison Transmission Holdings Inc.
- BorgWarner Inc.
- Schaeffler Group
- Continental AG
- Transtar Industries
- Mister Transmission
- Cottman Transmission & Total Auto Care
- Lee Myles AutoCare & Transmission
- AAMCO Transmissions Inc.
- Firestone Complete Auto Care
- Aisin Corporation
- Magna International Inc.
- Valeo SA
- GKN Automotive
- ATSG (Automatic Transmission Service Group)

Market Opportunities and Future Outlook
Shops and parts networks are finding whitespace in software-led transmission service for modern automatics, hybrids, and EV reduction gearboxes, where repair execution hinges on fault-code interpretation, software version control, and electronic calibration in addition to mechanical work. Trade coverage during 2026 highlighted capex shifting from traditional hard tooling toward proprietary diagnostics and data analysis for CAN bus interrogation. This aligns with the complexity trend already visible in the report, as automatic and CVT penetration increases job complexity and lifts average service ticket sizes through calibration and OEM-specific fluid requirements.
A second opportunity is building repeatable preventive-maintenance programs tied to specialized lubricants and seal integrity as multi-speed and mechatronic systems become more sensitive to fluid condition. Transmission oil already represents a large revenue component in this market, and the shift toward OEM-approved, application-specific fluids for advanced automatics, hybrids, and EV gearboxes increases the value of distribution partnerships, rapid availability, and documented service history for warranty and fleet accounts. Independent networks that combine parts availability (inventory depth and fast replenishment via online-to-offline models) with standardized diagnostic workflows and technician certification can compete more effectively for late-model vehicles that might otherwise default to dealer channels due to software access constraints.
Recent Industry Developments in Automotive Transmission Repair Market
- May 2026: BorgWarner announced it had won two conquest awards in Asia covering combustion and hybrid propulsion programs, including a dual-clutch-related program for a Chinese SUV. The wins reinforce continuing OEM investment in DCT and hybrid architectures that increase downstream aftermarket demand for specialized fluids, seals, clutch components, and calibration-capable repair capacity.
- June 2025: Allison Transmission announced an agreement to acquire Dana Incorporated's Off-Highway business, broadening Allison's powertrain and drivetrain component footprint beyond its core on-highway transmission base. The agreement supports deeper vertical integration across driveline components and expands the installed base and parts ecosystem that feeds remanufacturing, service training, and aftermarket support.
- September 2024: Transtar Industries invested USD 10 million to expand transmission parts inventory to improve fill rates for repair network customers. Higher on-shelf availability reduces bay downtime for rebuilds and replacements, strengthening the competitive position of independent workshops and franchise networks that rely on rapid parts access.


Automotive Transmission Repair Market Report Scope and Research Methodology
Market Definition and Coverage
This market covers paid services and parts linked to diagnosing, maintaining, repairing, rebuilding, or replacing vehicle transmissions, counted at the time the work is billed. We include repair activity for passenger cars and commercial vehicles across major gearbox types, where the customer payment is tied to transmission work.
Scope exclusions: We exclude non-transmission drivetrain work such as differentials, transfer cases, and propeller shafts, even when bundled in a broader driveline job.
Segments Covered in This Report
- By Vehicle Type
- Passenger Cars
- Light Commercial Vehicles
- Medium and Heavy Commercial Vehicles
- By Propulsion Type
- Internal Combustion Engine (ICE)
- Electric Vehicles (EV)
- By Component
- Gasket & Seal
- Transmission Oil
- Gear
- Clutch Plate
- Torque Converter
- Filters
- Electronic Control Unit (TCU)
- Others
- By Transmission Type
- Manual
- Automatic (AT)
- Continuously Variable (CVT)
- Dual-Clutch (DCT)
- e-Axle / Dedicated EV Gearbox
- By Repair Type
- Preventive Maintenance
- General Repair
- Overhaul / Rebuild
- Replacement
- By Service Provider
- OEM-Authorised Service Centres
- Independent Garages & Workshops
- Quick-Service Chains
- Mobile / Online Platforms
- Transmission-Specialist Franchises
- By End-user
- Individual Vehicle Owners
- Fleet Owners & Operators
- Dealership Service Departments
- Rental & Car-Sharing Companies
- By Distribution Channel
- Offline (Brick-and-Mortar Parts & Service)
- Online Aftermarket Parts Platforms
- By Geography
- North America
- United States
- Canada
- Rest of North America
- South America
- Brazil
- Argentina
- Rest of South America
- Europe
- Germany
- United Kingdom
- France
- Italy
- Russia
- Rest of Europe
- Asia-Pacific
- China
- India
- Japan
- South Korea
- Rest of Asia-Pacific
- Middle East and Africa
- Saudi Arabia
- United Arab Emirates
- Turkey
- South Africa
- Nigeria
- Rest of Middle East and Africa
- North America
Data Sources, Market Sizing, and Validation
Desk Research
Desk work starts by mapping the real-world demand pool, which is shaped by the in-use vehicle fleet and how often transmission issues show up over the vehicle life. We rely on public series such as national vehicle registrations and age profiles, roadworthiness inspection outcomes, and crash and repair indicators published by transport agencies.
To keep assumptions grounded, we also review sources such as OICA vehicle production, International Energy Agency vehicle outlooks (including electrification mix), US Bureau of Transportation Statistics, Eurostat transport and trade tables, and technical publications and standards bodies that document transmission technology shifts. Company filings, investor presentations, and reputable automotive press are used to sense-check service mix changes and parts price direction. Where needed, paid subscriptions are used only for company financial intelligence, patent databases, and shipment-level import and export checks tied to transmission parts. This list is illustrative only, and many other public and paid sources are also referred to for data collection, cross-checks, and clarification.
Primary Interviews and Surveys
Primary work is used to test what the desk model cannot show clearly, especially the split between repair, rebuild, and replacement, and how pricing varies by vehicle type and region. We speak with workshop owners, parts distributors, remanufacturing specialists, and service network managers, and then validate the final ranges with independent experts across APAC, EMEA, and the Americas.
Distribution of primary research fieldwork respondents
| Company type | Respondent position | Region |
|---|---|---|
| Top tier: 39% | CXOs: 12% | APAC: 45% |
| Mid tier: 40% | Functional/Unit leaders: 34% | EMEA: 30% |
| Smaller Players: 21% | Managers: 54% | Americas: 25% |
Market-Sizing & Forecasting
Sizing is built using a top-down demand reconstruction that starts from the active vehicle parc and aging curve, and then applies transmission service incidence and average repair ticket values to convert the demand pool into revenue. The model is then corroborated with selective bottom-up checks, such as sampled shop throughput by bay count, parts plus labor splits from channel discussions, and limited roll-ups for common jobs to adjust totals where the top-down view looks stretched.
A few inputs that matter most in this market are average vehicle age, automatic versus CVT versus DCT penetration, EV and hybrid mix (which changes gearbox complexity), regional labor rate direction, and the share of repair versus replacement jobs as reman parts availability improves. When data is sparse, gaps are handled by using regional proxy rates and then tightening them through interview ranges before totals are finalized.
Forecasts lean on scenario analysis supported by an exponential smoothing backbone for the installed base and service frequency, with expert-led adjustments for electrification pace, parts pricing inflation, and technician availability. We keep assumptions simple enough that the same steps can be repeated each year with refreshed parc, mix, and pricing inputs.
Data Validation & Update Cycle
Outputs are validated through multiple checks, including comparing modeled repair spend per vehicle against independent service industry signals and sanity checks on implied job counts and average tickets by region. When large jumps appear, we re-check the input drivers, revisit currency and inflation handling, and re-contact respondents to confirm whether the change is structural or timing related.
Before sign-off, a second analyst reviews the logic, calculations, and key assumptions so avoidable errors are caught early. Reports are refreshed annually, and interim updates are made when material events shift the installed base, service pricing, or repair behavior. Right before delivery, a final pass is done so clients receive the latest view available.
Mordor Intelligence's Automotive Transmission Repair Market Sizing Compared With Other Published Estimates
Published market values for transmission repair often spread out because the definition of what counts as a transmission job is not consistent, and because some studies mix workshop revenue with broader driveline or powertrain services. Differences also come from whether the estimate is tied to the in-use fleet and repair incidence, or whether it is projected mainly from new vehicle sales and a single average ticket.
The biggest gap drivers we see are scope overlap (drivetrain add-ons that inflate totals), the treatment of transmission fluids and related seals, and how the EV gearbox share is counted as it grows. Currency timing and price escalation assumptions also matter, because repair tickets move with labor rates and parts inflation, and not every publisher updates those inputs each year. These specific inclusion and refresh choices explain why the 2026 total sits where it does in Mordor Intelligence.
Benchmark comparison
| Source | Market Size | Gaps in Research Methodology |
|---|---|---|
| Mordor Intelligence | USD 200.34 B (2026) | |
| Trade Journal B | USD 55.40 B (2025) | This figure is presented for a narrower combined powertrain and transmission repair definition that often tracks a smaller set of service categories and may undercount commercial vehicles and higher-priced rebuild work outside the core channel. |
| Industry Report A | USD 28.30 B (2025) | This estimate appears closer to a transmission repair shops lens, where only specialist shop revenue is counted, which can exclude dealership service lanes, general repair garages, and parts sold alongside labor in multi-line workshops. |
Taken together, the spread is mainly explained by what is included as transmission-related spend and which service channels are counted. By keeping the demand pool anchored to the installed fleet and then checking it with real-world job and pricing signals, we provide a balanced figure that clients can trace back to clear, repeatable inputs.


Key Questions Answered in the Report
What is the current value of the automotive transmission repair market?
The market is valued at USD 200.34 billion in 2026 and is projected to reach USD 239.27 billion by 2031.
Which region leads the automotive transmission repair market?
North America leads with 36.45% revenue share in 2025, driven by a large automatic-transmission fleet and strong commercial-vehicle density.
How will electric vehicles affect transmission repairs?
EVs use simpler single-speed gearboxes that require less maintenance, reducing long-term demand for traditional repairs but creating new needs for specialized fluids and seal inspections.
Which component segment is growing the fastest?
Transmission oil outperforms others, posting a 4.18% CAGR thanks to higher fluid-change frequency in multi-speed and CVT systems.
Why are mobile and online platforms gaining share?
They deliver convenience, transparent pricing, and quick scheduling, driving a 3.88% CAGR that outpaces all other service-provider categories.
What skills will technicians need over the next five years?
Proficiency in EV safety protocols, software diagnostics, and predictive-maintenance analytics will be essential as drivetrain technology evolves.
Page last updated on:





