MiRNA Sequencing And Assay Market Size and Share
Market Overview
| Study Period | 2020 - 2031 |
|---|---|
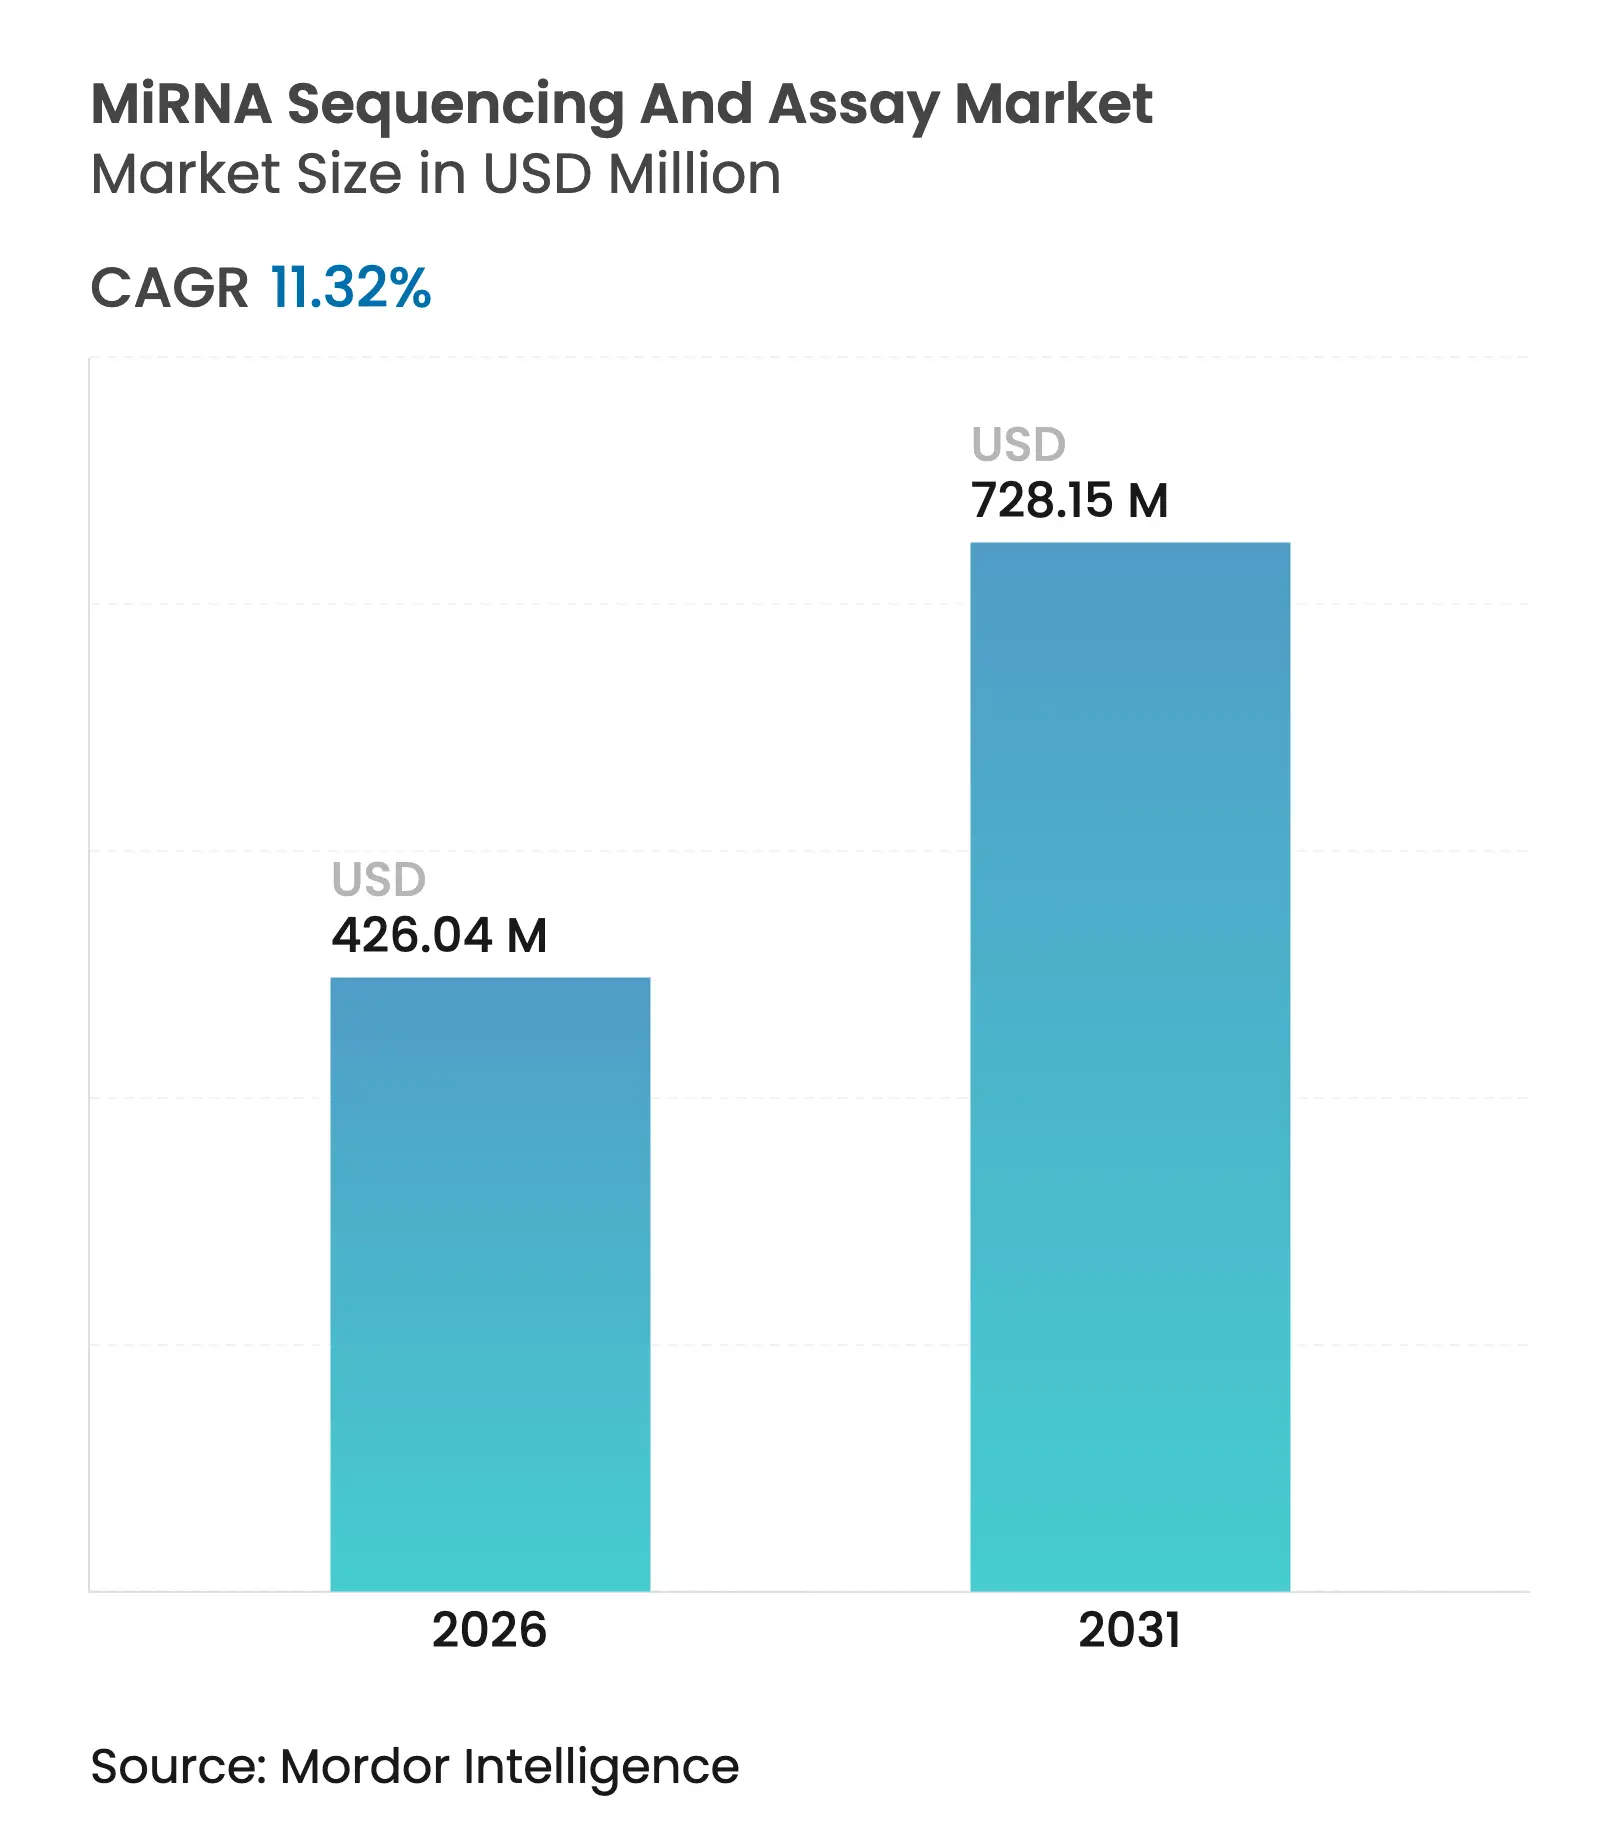
| Market Size (2026) | USD 426.04 Million |
| Market Size (2031) | USD 728.15 Million |
| Growth Rate (2026 - 2031) | 11.32 % CAGR |
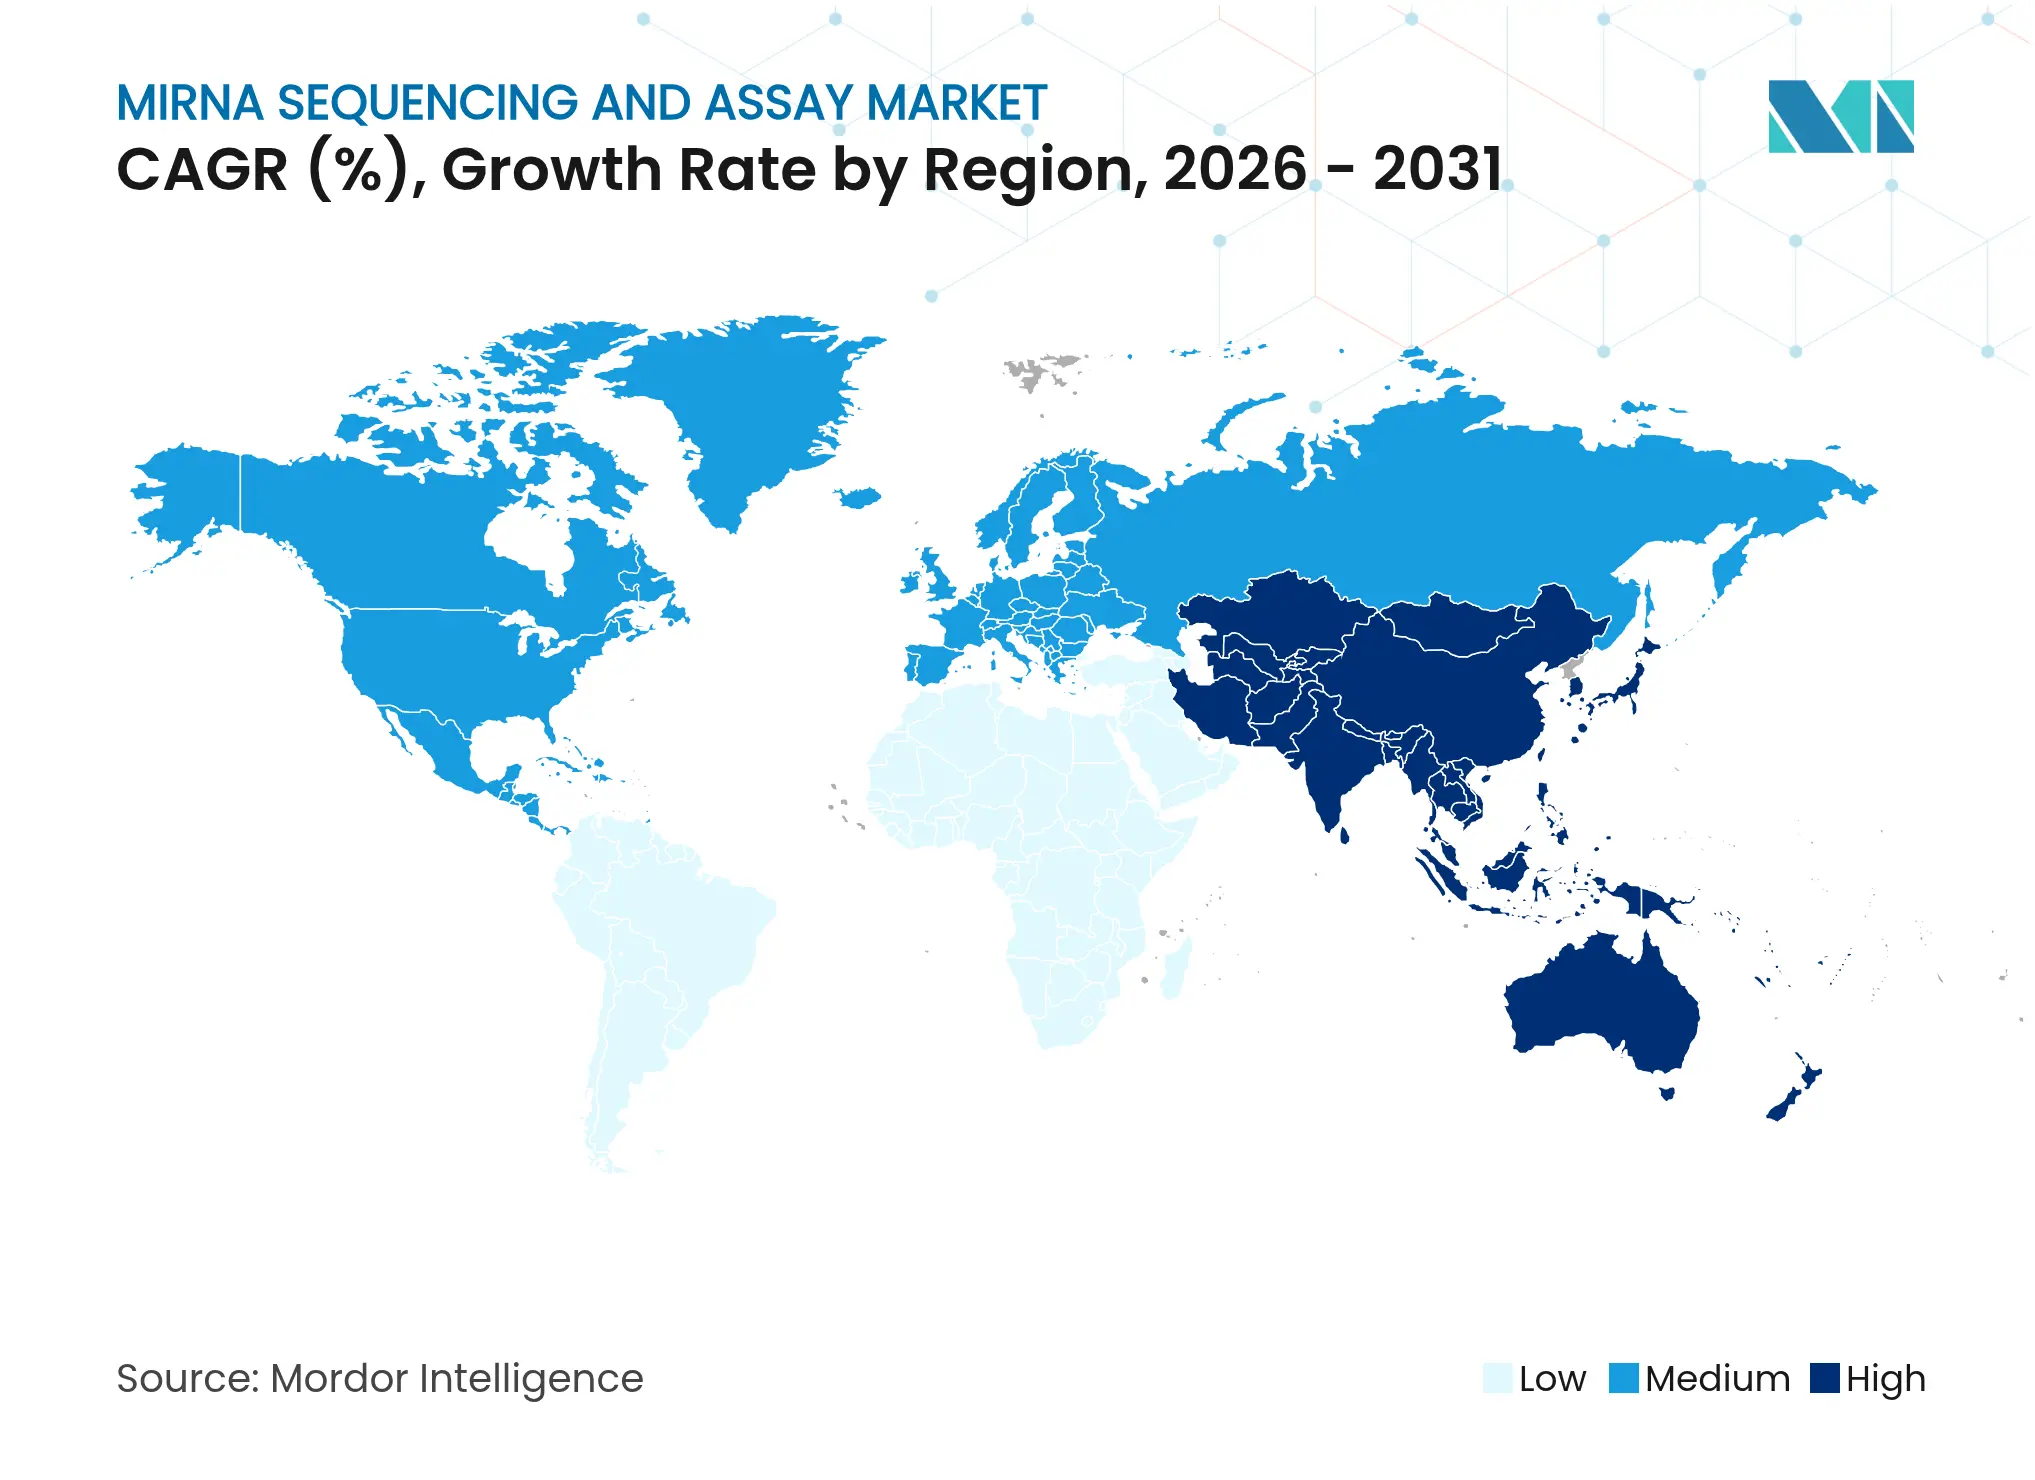
| Fastest Growing Market | Asia Pacific |
| Largest Market | North America |
| Market Concentration | Medium |
Major Players *Disclaimer: Major Players sorted in no particular order. Image © Mordor Intelligence. Reuse requires attribution under CC BY 4.0. |
MiRNA Sequencing And Assay Market Analysis by Mordor Intelligence
The miRNA sequencing and assay market size was valued at USD 382.71 million in 2025 and estimated to grow from USD 426.04 million in 2026 to reach USD 728.15 million by 2031, at a CAGR of 11.32% during the forecast period (2026-2031). Declining sequencing costs, regulatory clarity in laboratory-developed tests, and rapid uptake of liquid biopsy diagnostics steer this expansion. North America retains the largest regional footprint, while Asia-Pacific posts the quickest gains as Chinese genomics infrastructure scales. Accuracy gains such as Oxford Nanopore’s 98.8% median precision for direct RNA fragments shorten clinical validation cycles and attract hospital laboratories. Pharmaceutical companies integrate miRNA panels into drug discovery workflows, and artificial-intelligence bioinformatics tools cut data-analysis time from days to hours. Corporate acquisitions underline an intensifying competitive climate as incumbents and new entrants race to lower per-sample prices and broaden multiomics offerings.
Key Report Takeaways
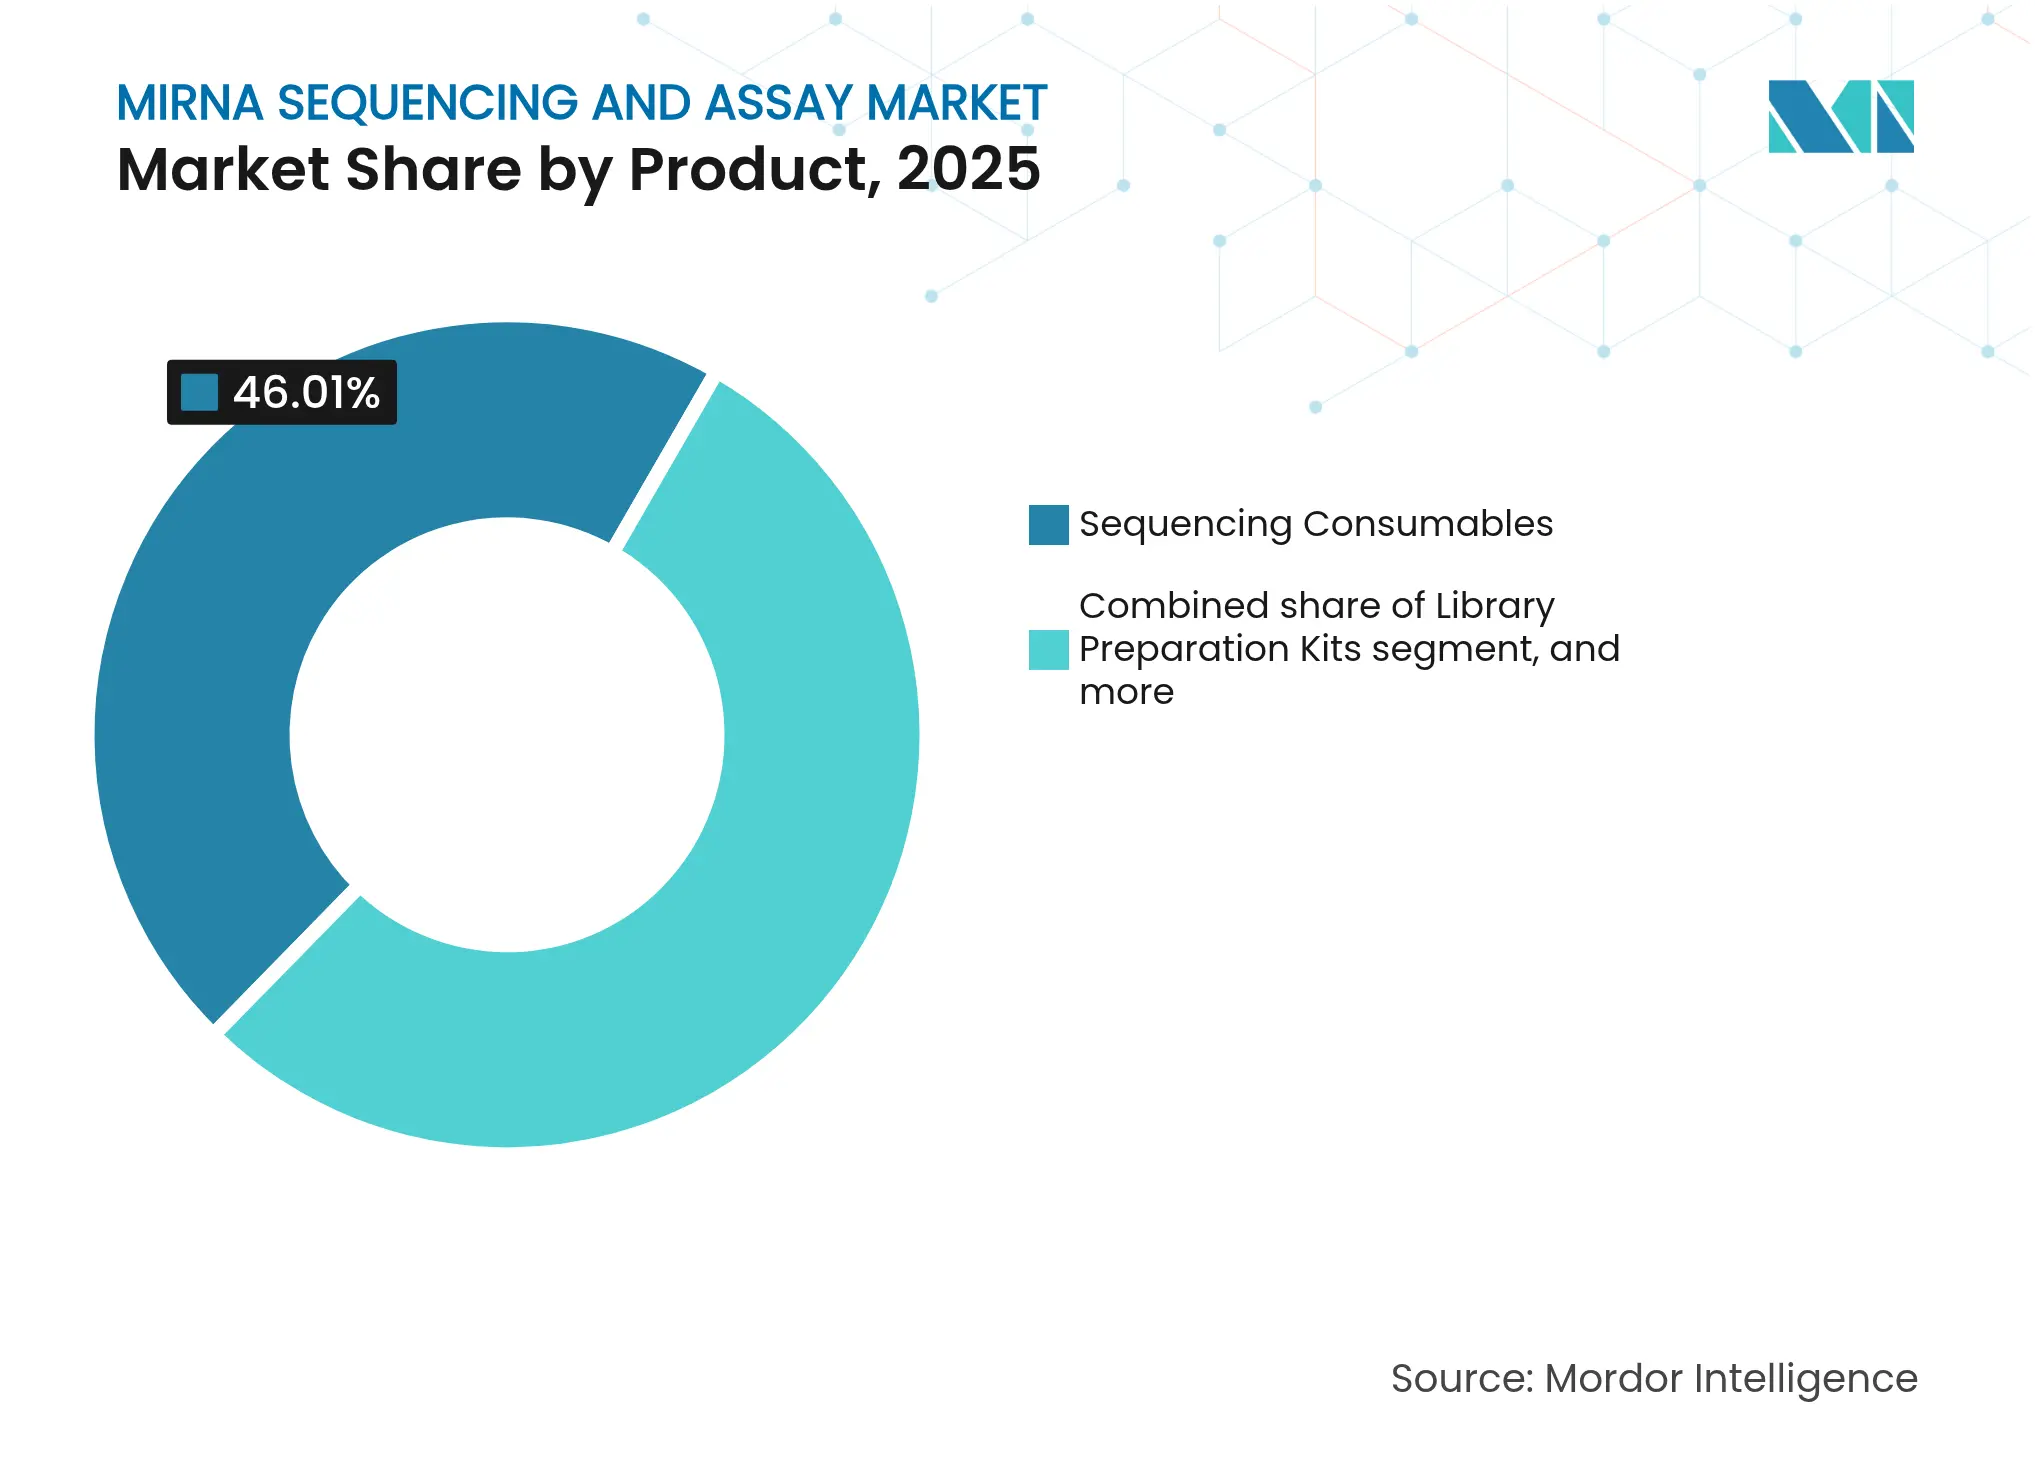
- By product category, sequencing consumables led with 46.01% revenue share of the miRNA sequencing and assay market in 2025; bioinformatics pipelines and services are projected to expand at a 13.28% CAGR through 2031.
- By technology, sequencing-by-synthesis held 62.02% of the miRNA sequencing and assay market share in 2025, while nanopore platforms are advancing at a 13.66% CAGR to 2031.
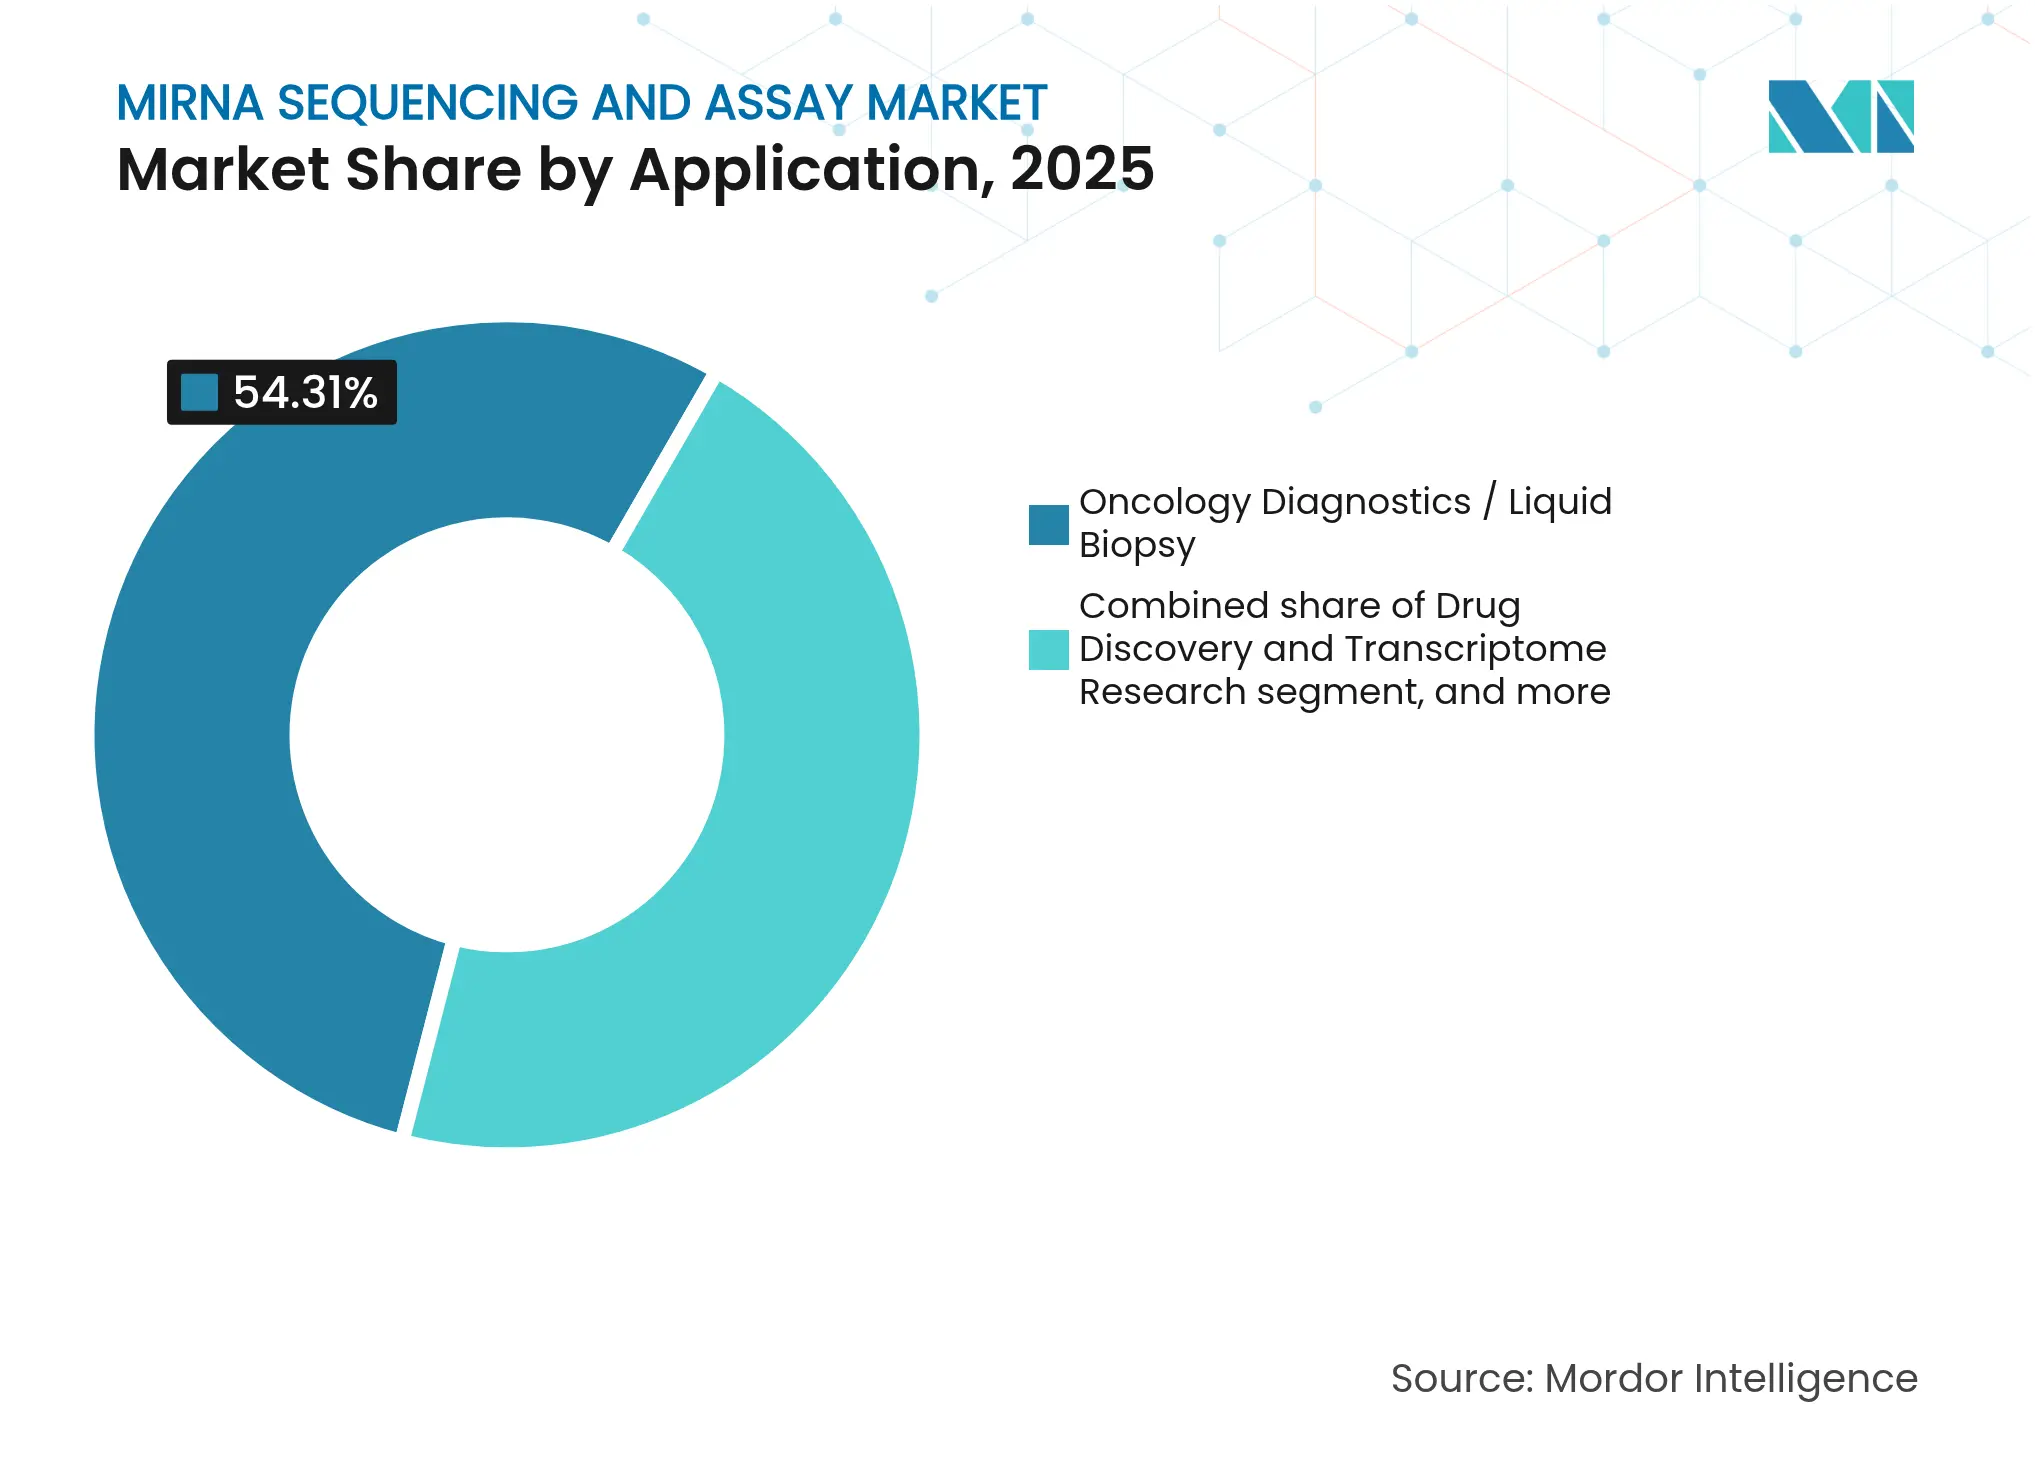
- By application, oncology diagnostics accounted for 54.31% share of the miRNA sequencing and assay market size in 2025 and is forecast to grow at an 11.25% CAGR through 2031.
- By end user, academic and research institutes captured 40.78% revenue in 2025; contract research organizations record the highest projected CAGR at 14.62% to 2031.
- By geography, North America retained 42.01% revenue share in 2025, whereas Asia-Pacific is projected to rise at a 12.39% CAGR through 2031.
Note: Market size and forecast figures in this report are generated using Mordor Intelligence's proprietary estimation framework, updated with the latest available data and insights as of 2026.
Global MiRNA Sequencing And Assay Market Trends and Insights
Driver Impact Analysis
| Driver | % Impact on CAGR Forecast | Geographic Relevance | Impact Timeline | |||
|---|---|---|---|---|---|---|
Dominance of next-generation sequencing in molecular diagnostics Dominance of next-generation sequencing in molecular diagnostics | +3.2% | Global; North America & Europe lead adoption | Medium term (2–4 years) | % Impact on CAGR Forecast:+3.2% | Geographic Relevance:Global; North America & Europe lead adoption | Impact Timeline:Medium term (2–4 years) |
Expanding public and private funding for genomics research Expanding public and private funding for genomics research | +2.8% | North America, Europe, Asia-Pacific | Long term (≥ 4 years) | |||
Rapid decline in sequencing costs and turnaround time Rapid decline in sequencing costs and turnaround time | +2.1% | Global; accelerated in Asia-Pacific hubs | Short term (≤ 2 years) | |||
Rising cancer incidence driving demand for liquid-biopsy biomarkers Rising cancer incidence driving demand for liquid-biopsy biomarkers | +1.9% | Global; concentrated in aging populations | Medium term (2–4 years) | |||
Adoption of artificial intelligence for automated miRNA data interpretation Adoption of artificial intelligence for automated miRNA data interpretation | +1.2% | Global; technology hubs | Medium term (2–4 years) | |||
Emerging agricultural and veterinary genomic applications Emerging agricultural and veterinary genomic applications | +0.8% | Asia-Pacific, North American agricultural regions | Long term (≥ 4 years) | |||
| Source: Mordor Intelligence | ||||||
Dominance of Next-Generation Sequencing in Molecular Diagnostics
Next-generation sequencing now delivers clinical-grade precision in miRNA analysis. Oxford Nanopore’s direct RNA workflow reports 98.8% median accuracy for 50-nucleotide fragments, removing amplification biases and meeting hospital quality thresholds. The FDA’s 2024 clearance of Illumina’s TruSight Oncology Comprehensive test established a precedent for NGS companion diagnostics. Validation studies show multi-cancer miRNA panels surpass 90% sensitivity across nine tumor types while keeping specificity above 99%[1]Nature Editorial Board, “High-Throughput miRNA Liquid Biopsy Studies,” nature.com. Automated sample prep and real-time analytics shrink result delivery from weeks to hours, encouraging routine adoption in oncology clinics.
Expanding Public and Private Funding for Genomics Research
An NIH-NSF initiative dedicates USD 15.4 million to RNA technology projects, including nanopore enhancements. Novartis strengthened its therapeutic portfolio by acquiring Regulus Therapeutics, underscoring industry commitment to miRNA-based drugs. Academic-industry consortia combine institutional expertise with commercial capacity, fostering sustained research programs. Similar capital flows appear in Europe’s Horizon initiatives and in Asia-Pacific where governments back domestic platforms to lessen Western dependence.
Rapid Decline in Sequencing Costs and Turnaround Time
Per-genome costs have fallen from USD 100 million in 2001 to about USD 500 in 2023, and innovators target USD 10 within the decade. The University of Minnesota Genomics Center notes 20% price cuts after recent platform upgrades. MGI Tech leverages Chinese manufacturing scale to pursue the USD 10 genome, widening global access. Coupled with automated library prep and cloud computation, total run-to-report times now fit same-day clinical schedules.
Rising Cancer Incidence Driving Demand for Liquid-Biopsy Biomarkers
Serum miRNA panels detect multiple cancers at early stages with over 90% sensitivity and 99% specificity, supporting population screening programs. The National Cancer Institute confirms pancreatic cancer assays that pair miRNA signatures with CA19-9 achieve 97% accuracy[2]National Cancer Institute, “Pancreatic Cancer miRNA Biomarker Study,” cancer.gov. Predictable FDA oversight speeds commercialization, and health-economics analyses favor non-invasive tests over tissue biopsies for monitoring residual disease.
Restraints Impact Analysis
| Restraints Impact Analysis | (~) % Impact on CAGR Forecast | Geographic Relevance | Impact Timeline | |||
|---|---|---|---|---|---|---|
High capital expenditure for sequencing platforms and ancillary equipment High capital expenditure for sequencing platforms and ancillary equipment | −2.3% | Global; strongest in emerging markets | Short term (≤ 2 years) | (~) % Impact on CAGR Forecast:−2.3% | Geographic Relevance:Global; strongest in emerging markets | Impact Timeline:Short term (≤ 2 years) |
Shortage of skilled bioinformatics workforce Shortage of skilled bioinformatics workforce | −1.8% | Global; acute in Asia-Pacific and emerging regions | Medium term (2–4 years) | |||
Fragmented regulatory and reimbursement landscape for miRNA tests Fragmented regulatory and reimbursement landscape for miRNA tests | −1.5% | Global; variable across jurisdictions | Medium term (2–4 years) | |||
Stringent data-privacy and cross-border genomic data restrictions Stringent data-privacy and cross-border genomic data restrictions | −1.2% | Europe & North America lead enforcement | Long term (≥ 4 years) | |||
| Source: Mordor Intelligence | ||||||
High Capital Expenditure for Sequencing Platforms and Ancillary Equipment
Top-tier instruments cost hundreds of thousands of dollars, plus service contracts and consumables, limiting uptake in resource-constrained settings. FDA quality-system rules add compliance overhead[3]Federal Register, “Laboratory-Developed Test Rulemaking Summary,” federalregister.gov. Sequencing-as-a-service models offer relief yet introduce concerns over data latency and security, causing some hospitals to defer adoption.
Shortage of Skilled Bioinformatics Workforce
MiRNA data sets require advanced statistical and computational interpretation. Global talent supply lags demand, pushing wages above the budgets of smaller labs. AI-driven analysis suites lessen the burden but must themselves clear validation hurdles before widespread hospital use.
Segment Analysis
By Product: Persistent Consumable Demand with Service Upswing
Sequencing consumables generated 46.01% of the miRNA sequencing and assay market in 2025, underlining the recurring nature of reagents sales. The consumable contribution to miRNA sequencing and assay market size is expected to stay high through 2031 as manufacturers bundle kits with instruments to lock in loyalty. Bioinformatics services grow the fastest at a 13.28% CAGR because many laboratories prefer outsourcing complex analytics to specialized vendors. This outsourcing trend benefits cloud-native providers that guarantee scalable storage and standardized pipelines. Automation-ready reagent formulations also cut technician time and bolster reproducibility.
Consumables’ dominance rests on constant demand for flow cells and library kits each sequencing run consumes. At the same time, service providers differentiate on turnaround and compliance documentation, carving out profitable niches even as instrument prices fall. The movement toward software subscriptions complements physical reagent sales and helps vendors smooth revenue swings tied to hardware replacement cycles.
Note: Segment shares of all individual segments available upon report purchase
By Technology: SBS Leadership Faces Nanopore Momentum
Sequencing-by-synthesis delivered 62.02% of miRNA sequencing and assay market share in 2025 thanks to mature chemistries and broad informatics support. The method remains entrenched in clinical laboratories that value well-validated workflows. Nanopore platforms expand at a 13.66% CAGR by enabling direct RNA reads that bypass reverse transcription, preserving native modifications important for functional studies.
Nanopore units appeal to users seeking rapid results and lower capital thresholds, especially in decentralized settings. Their real-time streaming also fits emergency disease surveillance. SBS vendors respond with higher throughput models and bundled informatics to defend market position. Hybrid facilities now deploy both modalities to balance cost, speed, and read-length requirements across research and diagnostic tasks.
By Application: Oncology Dominates While Pharma Research Diversifies
Oncology diagnostics captured 54.31% of 2025 revenues, making cancer the prime driver of the miRNA sequencing and assay market. Multi-cancer early detection tests rely on circulating miRNA signatures, and regulators have begun approving NGS-based companion diagnostics. Drug-discovery and transcriptome studies register a brisk 14.76% CAGR as pharmaceutical teams exploit miRNA profiles to stratify trial cohorts and gauge treatment response.
Beyond oncology, neurodegeneration, cardiovascular disease, and metabolic disorders attract new projects that seek miRNA biomarkers for prognosis and patient monitoring. Agricultural scientists adopt miRNA sequencing for crop-stress resilience breeding, signaling a future where non-human applications form a meaningful revenue slice.
Note: Segment shares of all individual segments available upon report purchase
By End User: Academia Leads, CROs Accelerate
Academic institutions secured 40.78% of 2025 demand owing to sustained grant inflows and mission-driven basic research. Their large sample volumes keep instrument utilization high and foster new protocol development. Contract research organizations exhibit the fastest 14.62% CAGR as drug makers outsource sequencing and analytics to contain capital costs.
Clinical laboratories, guided by the FDA’s phased oversight, set up bespoke assays for high-risk diseases, while biotech firms install in-house sequencers to protect intellectual property. The outsourcing momentum moves some instrument placements from hospitals to CRO hubs, yet consumable sales rise across both channels as absolute run counts climb.
Geography Analysis
North America contributed 42.01% of 2025 revenue to the miRNA sequencing and assay market, anchored by the NIH-NSF USD 15.4 million RNA initiative and an FDA roadmap that shortens diagnostic approvals. Reimbursement pathways for molecular assays and strong venture capital flows encourage hospital adoption. Major acquisitions such as Novartis-Regulus further concentrate expertise and capital in the region.
Asia-Pacific advances at a 12.39% CAGR to 2031, propelled by Chinese capacity expansion and policies that subsidize domestic platforms like MGI’s DNBSEQ, which targets a USD 10 genome. Regional agricultural and veterinary genomics projects provide additional demand, while local start-ups offer lower-cost sequencing services for small clinics. India and Japan invest heavily in personalized-medicine trials, reinforcing sustained consumable and bioinformatics growth.
Europe shows steady gains amid IVDR implementation, which imposes new evidence requirements before clinical rollout. Collaborative public-private consortia smooth compliance costs for smaller innovators. Governments widen precision-medicine funding and support cross-border clinical trials using miRNA-based stratification. Despite regulatory hurdles, the continent retains a strong pharmaceutical footprint that continually seeds new biomarker initiatives.

Competitive Landscape
Market Concentration
The miRNA sequencing and assay market exhibits moderate consolidation. Five leading vendors together control roughly 60% of global revenue, balancing established SBS players and emergent nanopore specialists. Integrated portfolios that couple instruments, consumables, and software erect switching barriers. Yet AI-centric bioinformatics start-ups reduce dependence on proprietary pipelines by offering platform-agnostic analytics over the cloud.
Acquisitions remain the preferred route to fill capability gaps. Novartis purchased Regulus to secure miRNA therapeutic assets, while Deerfield took over Singular Genomics to accelerate instrument commercialization at a premium valuation. Roche’s Sequencing by Expansion prototype promises higher output and may redefine throughput economics upon its 2026 research launch. Patent filings concentrate on error-correction algorithms, compact nanopores, and chemistry miniaturization, signaling sustained technological rivalry over the forecast horizon.
Regional manufacturers continue to localize production in Asia-Pacific to cut duty costs and gain procurement preference in government healthcare programs. Meanwhile, North American and European vendors nurture multiomics subscriptions that mix DNA, RNA, and protein workflows, aiming to lock clients into complete molecular-profiling ecosystems.
MiRNA Sequencing And Assay Industry Leaders

*Disclaimer: Major Players sorted in no particular order
Recent Industry Developments
- June 2025: Novartis completed its acquisition of Regulus Therapeutics, securing farabursen for polycystic kidney disease after favorable Phase 1b data.
- May 2025: Oxford Nanopore announced 98.8% median accuracy for direct RNA reads of 50 nucleotides, expanding real-time sequencing use cases.
- April 2025: MGI Tech marked ten years of DNBSEQ and unveiled a USD 10 genome roadmap built on vertical integration.
- February 2025: Roche introduced Sequencing by Expansion technology, generating seven 30× human genomes in one hour ahead of a 2026 research release.
- December 2024: Singular Genomics accepted a USD 20-per-share buyout by Deerfield Management, accelerating commercialization of the G4 platform.
- August 2024: FDA cleared Illumina’s TruSight Oncology Comprehensive for 517-gene tumor profiling, setting a regulatory benchmark for NGS companion tests.
Table of Contents for MiRNA Sequencing And Assay Industry Report
1. Introduction
- 1.1Study Assumptions & Market Definition
- 1.2Scope of the Study
2. Research Methodology
3. Executive Summary
4. Market Landscape
- 4.1Market Overview
- 4.2Market Drivers
- 4.2.1Dominance of Next-Generation Sequencing in Molecular Diagnostics
- 4.2.2Expanding Public and Private Funding for Genomics Research
- 4.2.3Rapid Decline in Sequencing Costs and Turnaround Time
- 4.2.4Rising Cancer Incidence Driving Demand for Liquid Biopsy Biomarkers
- 4.2.5Emerging Agricultural and Veterinary Genomic Applications
- 4.2.6Adoption of Artificial Intelligence for Automated MiRNA Data Interpretation
- 4.3Market Restraints
- 4.3.1High Capital Expenditure for Sequencing Platforms and Ancillary Equipment
- 4.3.2Shortage of Skilled Bioinformatics Workforce
- 4.3.3Fragmented Regulatory and Reimbursement Landscape for MiRNA Tests
- 4.3.4Stringent Data-Privacy and Cross-Border Genomic Data Restrictions
- 4.4Regulatory Landscape
- 4.5Porter's Five Forces Analysis
- 4.5.1Threat of New Entrants
- 4.5.2Bargaining Power of Buyers
- 4.5.3Bargaining Power of Suppliers
- 4.5.4Threat of Substitutes
- 4.5.5Competitive Rivalry
5. Market Size & Growth Forecasts (Value, USD)
- 5.1By Product
- 5.1.1Sequencing Consumables
- 5.1.2Library Preparation Kits
- 5.1.3Sequencing Platforms / Instruments
- 5.1.4Bioinformatics Pipelines & Services
- 5.2By Technology
- 5.2.1Sequencing by Synthesis (SBS)
- 5.2.2Ion Semiconductor
- 5.2.3SOLiD
- 5.2.4Nanopore Sequencing
- 5.2.5Single-Molecule Real-Time (SMRT)
- 5.3By Application
- 5.3.1Oncology Diagnostics / Liquid Biopsy
- 5.3.2Drug Discovery & Transcriptome Research
- 5.3.3Other Applications
- 5.4By End User
- 5.4.1Clinical Laboratories
- 5.4.2Academic & Research Institutes
- 5.4.3Biotech / Pharma Companies
- 5.4.4Contract Research Organizations
- 5.5Geography
- 5.5.1North America
- 5.5.1.1United States
- 5.5.1.2Canada
- 5.5.1.3Mexico
- 5.5.2Europe
- 5.5.2.1Germany
- 5.5.2.2United Kingdom
- 5.5.2.3France
- 5.5.2.4Italy
- 5.5.2.5Spain
- 5.5.2.6Rest of Europe
- 5.5.3Asia-Pacific
- 5.5.3.1China
- 5.5.3.2Japan
- 5.5.3.3India
- 5.5.3.4Australia
- 5.5.3.5South Korea
- 5.5.3.6Rest of Asia-Pacific
- 5.5.4Middle East & Africa
- 5.5.4.1GCC
- 5.5.4.2South Africa
- 5.5.4.3Rest of Middle East & Africa
- 5.5.5South America
- 5.5.5.1Brazil
- 5.5.5.2Argentina
- 5.5.5.3Rest of South America
6. Competitive Landscape
- 6.1Market Concentration
- 6.2Market Share Analysis
- 6.3Company Profiles (includes Global level Overview, Market level overview, Core Business Segments, Financials, Headcount, Key Information, Market Rank, Market Share, Products and Services, and analysis of Recent Developments)
- 6.3.1Illumina Inc.
- 6.3.2Thermo Fisher Scientific
- 6.3.3QIAGEN N.V.
- 6.3.4PerkinElmer Inc.
- 6.3.5Takara Bio Inc.
- 6.3.6New England Biolabs
- 6.3.7Norgen Biotek
- 6.3.8TriLink Biotechnologies
- 6.3.9Lexogen GmbH
- 6.3.10Oxford Nanopore Technologies
- 6.3.11Agilent Technologies
- 6.3.12BGI / MGI Tech
- 6.3.13Pacific Biosciences
- 6.3.14NanoString Technologies
- 6.3.15MedGenome
- 6.3.16SomaGenics
- 6.3.17CD Genomics
- 6.3.18Illumina (BlueBee Bioinformatics)
- 6.3.19Guardant Health
- 6.3.20Eurofins Genomics
7. Market Opportunities & Future Outlook
- 7.1White-space & Unmet-Need Assessment
Global MiRNA Sequencing And Assay Market Report Scope
miRNA sequencing is a type of RNA-seq that uses next-generation sequencing or massively parallel sequencing of high-throughput DNA to pattern microRNAs. The substance used during the method of decoding miRNA sequencing is a bit different from RNA sequencing.
The miRNA sequencing and assay market is segmented by product, technology, end user, and geography. By product, the market is segmented into sequencing consumables and library preparation kits. By technology, the market is segmented into sequencing by synthesis, ion semiconductor, SOLiD, and nanopore sequencing. By end user, the market is segmented into clinical laboratories, life science organizations, and other end users. By geography, the market is segmented into North America, Europe, Asia-Pacific, the Middle East and Africa, and South America. The report also covers the estimated market sizes and trends for 17 countries across major regions globally.
The report offers the market sizes and forecasts in value (USD) for the above segments.