Market Overview
| Study Period | 2020 - 2031 |
|---|---|
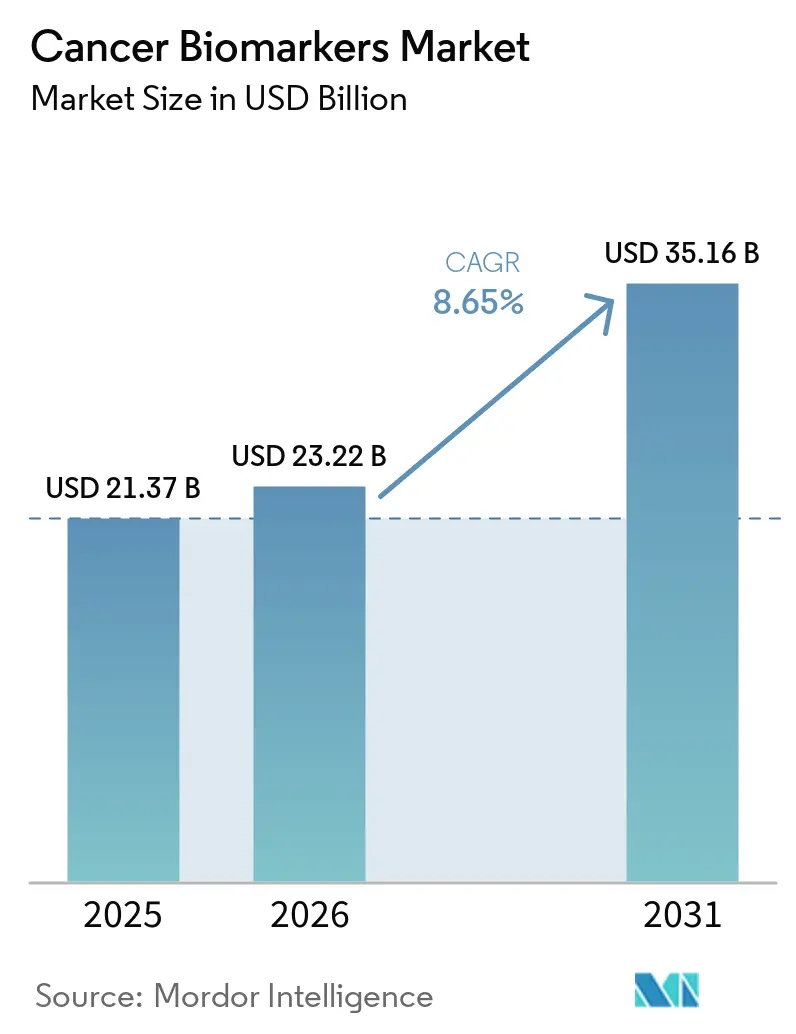
| Market Size (2026) | USD 23.22 Billion |
| Market Size (2031) | USD 35.16 Billion |
| Growth Rate (2026 - 2031) | 8.65% CAGR |
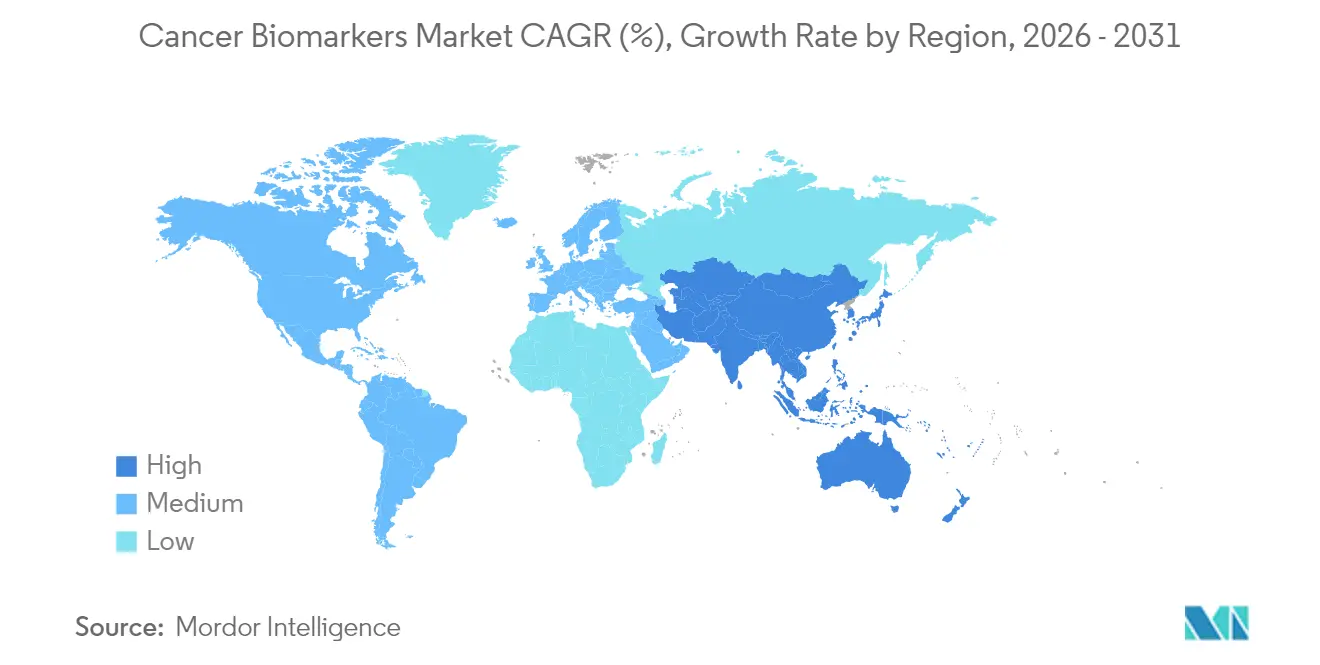
| Fastest Growing Market | Asia Pacific |
| Largest Market | North America |
| Market Concentration | Medium |
Major Players
*Disclaimer: Major Players sorted in no particular order Image © Mordor Intelligence. Reuse requires attribution under CC BY 4.0. |
|
Cancer Biomarkers Market Analysis by Mordor Intelligence
The cancer biomarkers market size was valued at USD 21.37 billion in 2025 and estimated to grow from USD 23.22 billion in 2026 to reach USD 35.16 billion by 2031, at a CAGR of 8.65% during the forecast period (2026-2031). Strong growth stems from artificial-intelligence platforms that mine multi-omics datasets, enabling the identification of tumor signatures up to seven years before symptoms appear. Liquid-biopsy products now detect colorectal cancer with 83% sensitivity through blood-based methylation analysis, a milestone that the FDA underscored by clearing Guardant Health’s Shield test in July 2024. Commercial focus is shifting from reactive diagnosis toward proactive risk assessment, supported by multi-cancer early-detection assays that deliver 98.6% specificity across several tumor types. Competitive intensity is rising as AI-native companies shorten discovery timelines by screening population-scale genomic databases, while established diagnostics firms race to integrate similar capabilities into their existing workflows.
Key Report Takeaways
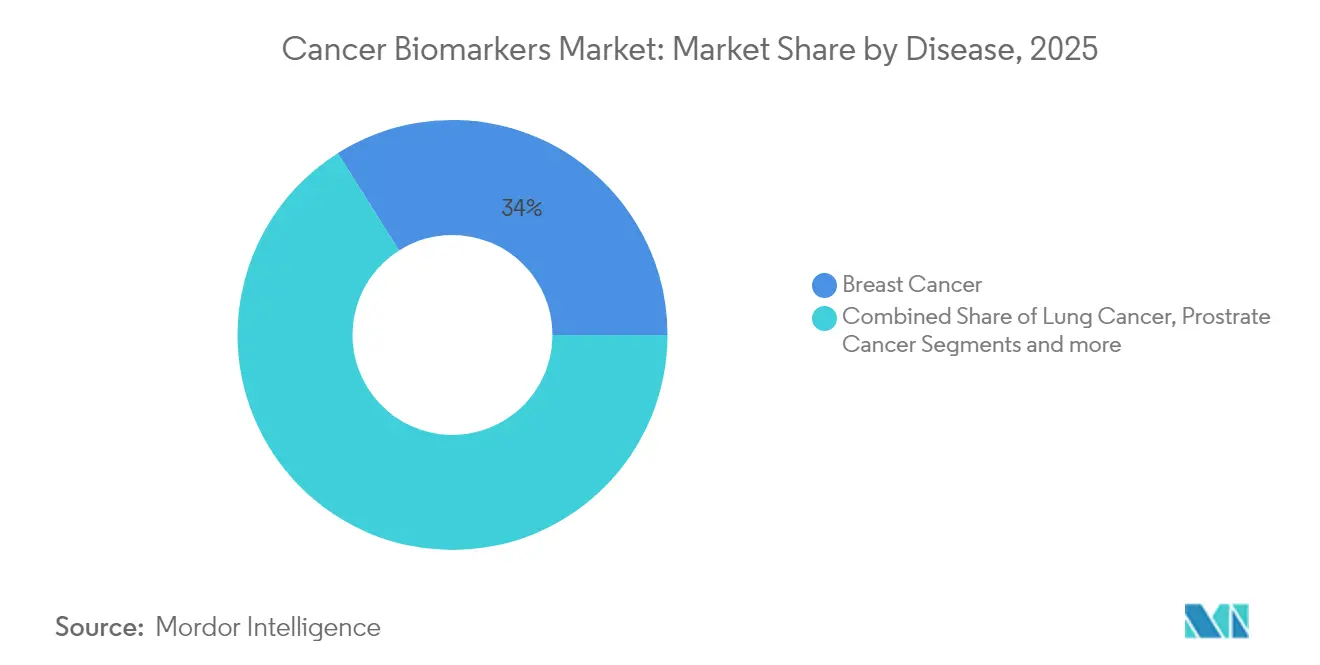
- By cancer type, breast cancer retained 33.96% of the cancer biomarkers market share in 2025, whereas prostate cancer is poised to expand at a 9.21% CAGR through 2031.
- By biomolecule, protein markers commanded 51.78% share in 2025, but genetic markers are set to grow the fastest at a 9.63% CAGR.
- By profiling technology, omics platforms led with 32.45% revenue share in 2025; immunoassays are forecast to increase at a 9.53% CAGR to 2031.
- By end user, hospitals and clinics held 41.02% share in 2025, while clinical and reference laboratories are expected to post the highest CAGR at 9.6% through 2031.
- By geography, North America dominated with 42.08% share in 2025; Asia-Pacific is projected to register the quickest growth at a 9.76% CAGR over the forecast period.
Note: Market size and forecast figures in this report are generated using Mordor Intelligence’s proprietary estimation framework, updated with the latest available data and insights as of 2026.
Global Cancer Biomarkers Market Trends and Insights
Drivers Impact Analysis*
| Driver | (~) % Impact on CAGR Forecast | Geographic Relevance | Impact Timeline |
|---|---|---|---|
| Surge in prevalence of cancer worldwide | +2.1% | Global | Long term (≥ 4 years) |
| Shift from diagnosis to proactive risk assessment & early detection | +1.8% | North America & EU, expanding to APAC | Medium term (2-4 years) |
| Rapid adoption of multi-omics & NGS platforms | +1.5% | Global, led by North America | Short term (≤ 2 years) |
| AI-enabled biomarker discovery pipelines | +1.3% | North America, EU, China | Medium term (2-4 years) |
| Expansion of decentralized liquid-biopsy devices in emerging markets | +0.9% | APAC, Latin America, MEA | Long term (≥ 4 years) |
| Regulators' fast-track approvals for companion diagnostics | +0.7% | North America, EU | Short term (≤ 2 years) |
| Source: Mordor Intelligence | |||


Surge in Cancer Prevalence
Escalating cancer incidence sustains long-term demand for molecular screening in every major healthcare market. The United States alone recorded more than 1.8 million new cases in 2024, a burden prompting payers to favor tests that can flag tumors at asymptomatic stages. Health systems worldwide recognize that earlier detection through biomarkers lowers mortality and reduces treatment expenditures, strengthening the business case for broad test reimbursement.
Shift to Proactive Risk Assessment & Early Detection
Clinical strategies are pivoting from diagnosing established disease toward predicting individual risk. Oxford Population Health reported 371 plasma-protein signals that forecast multiple cancers up to seven years in advance, illustrating the feasibility of predictive molecular medicine. Large-scale blood-based screens now achieve 75% sensitivity with 98.6% specificity, providing multipurpose screening tools that improve patient compliance in settings where single-tumor tests are impractical, thereby accelerating innovation in the cancer biomarkers market.
Rapid Adoption of Multi-Omics & NGS Platforms
Sequencing costs have fallen below USD 200 per genome, removing historical economic barriers and positioning next-generation sequencing as a routine diagnostic option. Multi-omics workflows integrate genomic, proteomic, and metabolomic data, supplying clinicians with comprehensive tumor profiles while AI-driven analytics convert complex readouts into actionable treatment paths within days [1]Yuki Katsuya, "Current and future trends in whole genome sequencing in cancer," Cancer Biology and Medicine, cancerbiomed.org.
AI-Enabled Biomarker Discovery Pipelines
Machine-learning engines interrogate hundreds of millions of biomedical relationships to uncover biomarker panels with markedly higher diagnostic accuracy than single-analyte tests. Sex-specific protein panels, for instance, identify 93% of cancers in men and 84% in women at 99% specificity. Such breakthroughs demonstrate how AI refines biomarker selection, cuts discovery timelines, and improves trial stratification, creating new growth opportunities in the cancer biomarkers market.
Restraints Impact Analysis*
| Restraint | (~) % Impact on CAGR Forecast | Geographic Relevance | Impact Timeline |
|---|---|---|---|
| High cost of biomarker-based diagnostics | -1.4% | Global, particularly emerging markets | Medium term (2-4 years) |
| Uncertain & region-specific reimbursement pathways | -1.1% | Global, varying by healthcare system | Long term (≥ 4 years) |
| Stringent data-privacy rules curbing genomic data sharing | -0.8% | EU, expanding globally | Medium term (2-4 years) |
| Limited availability of longitudinal biobank samples | -0.6% | Global, acute in emerging markets | Long term (≥ 4 years) |
| Source: Mordor Intelligence | |||
High Cost of Biomarker-Based Diagnostics
Liquid biopsies average USD 2,800 versus USD 700 for tissue biopsies, limiting adoption in cost-sensitive systems. Medicare still requires extensive clinical-utility evidence before granting broad test coverage, delaying access and compressing vendor margins. While point-of-care devices can reduce procedural outlays, meaningful cost decline hinges on manufacturing scale and automation.
Uncertain & Region-Specific Reimbursement Pathways
Coverage decisions vary across payers and jurisdictions, creating fragmented market entry requirements. The US MolDX program demands rigorous analytical and clinical-utility dossiers, whereas many European regimes tie approval to national cost-effectiveness evaluations, prolonging time to reimbursement. Firms must often finance multiple outcome studies to align with diverging payer expectations, straining budgets and delaying global rollouts.
*Our forecasts treat driver/restraint impacts as directional, not additive. The impact forecasts reflect baseline growth, mix effects, and variable interactions.
Segment Analysis
By Disease: Prostate Cancer Drives Growth Despite Breast Cancer Dominance
Breast malignancies represented 33.96% of the cancer biomarkers market in 2025, anchored by mature HER2, ER, and PR testing protocols that now guide routine therapeutic decisions in both inpatient and outpatient settings. This leadership rests on decades of clinical evidence that underpins reimbursement and physician familiarity. Expanded use of circulating-tumor-DNA assays further entrenches breast cancer’s market position by providing minimally invasive options for monitoring minimal residual disease.
Prostate cancer is the fastest-rising segment, advancing at a 9.21% CAGR to 2031 as non-invasive biomarker panels gain favor in Asia where cultural hesitancy toward traditional screening remains high. Epigenetic assays such as EpiSwitch deliver higher specificity than PSA alone and avoid uncomfortable procedures, a combination that propels uptake in regions where early-stage diagnosis has historically lagged. Together, these trends indicate that prostate cancer will significantly escalate its revenue share despite breast cancer’s continuing dominance in the cancer biomarkers market.


By Biomolecule Type: Genetic Biomarkers Accelerate While Protein Markers Dominate
Protein analytes accounted for 51.78% of 2025 revenue thanks to the ubiquity of immunoassays and the extensive clinical evidence supporting protein-based diagnostics. Hospitals rely on ELISA and chemiluminescence platforms that deliver results within hours, reinforcing their preference for protein markers in acute decision-making.
Genetic indicators are anticipated to post a 9.63% CAGR through 2031 as whole-genome sequencing becomes mainstream. Plummeting sequencing costs and AI-driven variant-calling pipelines let clinicians interrogate hundreds of oncogenes simultaneously, propelling genetic tests into frontline care and enlarging the cancer biomarkers market size for precision-genomics offerings. Industry collaboration on multi-gene companion diagnostics further accelerates the revenue expansion of genetic assays.
By Profiling Technology: Immunoassays Surge While Omics Platforms Lead
Omics platforms held the highest 2025 revenue at 32.45% by enabling integrated stratification across genomic, transcriptomic, and metabolomic layers. Such holistic profiling is now indispensable for understanding tumor heterogeneity and therapy resistance mechanisms.
Immunoassay revenues are poised to grow 9.53% per year as manufacturers miniaturize chemiluminescent and fluorescent formats for point-of-care settings. Hand-held devices optimize turnaround, improve therapy initiation timelines, and open fresh revenue avenues in community clinics, thereby widening the cancer biomarkers market base.

By End User: Laboratories Accelerate as Hospitals Maintain Leadership
Hospitals and clinics held 41.02% share in 2025 by virtue of integrated care pathways that favor in-house testing for rapid decision-making. Yet centralized clinical and reference laboratories are projected to expand 9.6% annually, leveraging high-throughput sequencers and AI analytics that drive down per-sample costs, elevating their contribution to overall cancer biomarkers market size between now and 2031.
Pharmaceutical companies increasingly outsource companion-diagnostic development to these laboratories, reinforcing double-digit growth trajectories. As assay complexity rises, centralized facilities with certified bioinformaticians secure contracts that smaller hospital labs cannot match.
Geography Analysis
North America captured 42.08% of 2025 revenue, bolstered by robust reimbursement, an established biobank network, and clear FDA pathways that facilitate rapid test approvals. Federal policy continues to support innovation, even as new rules for laboratory-developed tests impose USD 1.29 billion in compliance costs over four years. Capital commitments such as Roche’s USD 50 billion US investment affirm confidence in the region’s future growth trajectory for the cancer biomarkers market. .
Europe ranks second, supported by the European Health Data Space, which harmonizes genomic data sharing under GDPR safeguards. Germany’s Health Data Use Act and European-wide liquid-biopsy standardization initiatives expand the utility of biomarkers in population screening. Still, stringent privacy obligations prolong data-exchange negotiations, occasionally delaying pan-European trials.
Asia-Pacific is set to record the swiftest 9.76% CAGR as governments allocate more than USD 138 billion to upgrade medical infrastructure by 2027. China’s investment in sovereign AI systems and Japan’s nationwide genome initiatives underpin local innovation pipelines. Non-invasive tests addressing prostate and gastric cancers are gaining acceptance, narrowing historical disparities in early detection. Diverse regulatory frameworks persist, yet regional harmonization efforts are underway, pointing to streamlined future approvals and an expanding cancer biomarkers market across emerging economies.

Competitive Landscape
The sector exhibits moderate concentration yet rising disruption. Established firms such as Roche and Thermo Fisher exploit deep regulatory expertise and global distribution to maintain leadership positions, with Roche earmarking USD 50 billion for US-based AI and gene-therapy facilities through 2030. Thermo Fisher’s 2023 purchase of Olink for USD 3.1 billion cemented its proteomics footprint, while a planned USD 4 billion divestiture in non-core diagnostics underscores the pivot toward higher-growth niches.
AI-native challengers differentiate through proprietary algorithms and rapid product iteration. Guardant Health received FDA breakthrough status for its Shield multi-cancer blood test in June 2025, enabling an expedited review pathway and heightening competitive pressure on slower-moving incumbents. QIAGEN, meanwhile, added 100 new assays to its QIAcuity digital-PCR roster in 2024 and expanded its Digital Insights knowledge base to more than 640 million biomedical relationships, building data moats that deter new entrants.
Smaller firms target niche applications such as pancreatic screening, illustrated by Mainz Biomed’s PancAlert program in 2025, or localized market needs like Asia-Pacific prostate tests. Strategic partnerships between big diagnostics firms and AI startups are proliferating, signaling a convergence phase where technology integration, rather than mere scale, dictates future market leadership.
Cancer Biomarkers Industry Leaders
-
Illumina
-
Thermo Fisher Scientific
-
Biomerieux
-
Abbott
-
F. Hoffmann-La Roche Ltd
- *Disclaimer: Major Players sorted in no particular order

Recent Industry Developments
- June 2025: Mainz Biomed begins the next phase of PancAlert, a blood-based pancreatic cancer screening initiative, to validate a new biomarker panel.
- June 2025: Guardant Health secures FDA Breakthrough Device designation for its Shield Multi-Cancer test, which detects multiple tumor types via methylation signatures with 98.6% specificity.
- April 2025: Roche announces a USD 50 billion investment covering US gene-therapy sites and AI research centers, reinforcing its diagnostics footprint.
- September 2024: Illumina gains FDA approval for TruSight Oncology Comprehensive as a pan-tumor companion diagnostic spanning over 500 biomarkers.


Research Methodology Framework and Report Scope
Market Definitions and Key Coverage
Our study defines the global cancer biomarkers market as the aggregate revenue generated from commercial in-vitro tests and associated reagents that detect, quantify, or monitor biomolecular signatures directly linked to solid or hematological malignancies. The definition spans protein, genetic, epigenetic, and metabolite markers delivered through laboratory-developed or regulatory-cleared kits used in hospital, reference-lab, and point-of-care settings worldwide.
Scope exclusion: biomarkers intended exclusively for non-oncology disorders and early-stage research reagents are not counted.
Segmentation Overview
-
By Disease
- Breast Cancer
- Lung Cancer
- Prostate Cancer
- Colorectal Cancer
- Cervical Cancer
- Other Cancers
-
By Biomolecule Type
- Protein Biomarkers
- Genetic Biomarkers
- Others
-
By Profiling Technology
- Omics Technologies
- Imaging Technologies
- Immunoassays
- Others
-
By End User
- Hospitals & Clinics
- Clinical & Reference Laboratories
- Pharma & Biotech Companies
- Others
-
By Geography
-
North America
- United States
- Canada
- Mexico
-
Europe
- Germany
- United Kingdom
- France
- Italy
- Spain
- Rest of Europe
-
Asia-Pacific
- China
- Japan
- India
- Australia
- South Korea
- Rest of Asia-Pacific
-
Middle East and Africa
- GCC
- South Africa
- Rest of Middle East and Africa
-
South America
- Brazil
- Argentina
- Rest of South America
-
North America
Detailed Research Methodology and Data Validation
Primary Research
To validate secondary estimates, we interviewed practicing oncologists, molecular pathologists, and diagnostics product managers across North America, Europe, China, India, and Brazil. These conversations clarified real-world test utilization, liquid-biopsy adoption curves, price concessions, and pipeline launch likelihoods, which in turn anchored our model assumptions at practical levels.
Desk Research
Mordor analysts began with structured desk research that harvested incidence and survival statistics from GLOBOCAN, the National Cancer Institute SEER portal, and Eurostat. We layered in regulatory filings and public fee schedules from the FDA, CMS, EMA, and Japan's PMDA to benchmark reimbursement ceilings for companion diagnostics. Scientific insight flowed from peer-reviewed papers indexed on PubMed and preprints on medRxiv, while technology road maps were tracked through conference abstracts from AACR and ASCO. Commercial signals, such as shipment volumes and average selling prices, were sampled from D&B Hoovers, Questel patent families, and company 10-K statements. The sources listed are illustrative; many additional publications and datasets were reviewed to cross-check numbers and fill context gaps.
Market-Sizing & Forecasting
A calibrated top-down approach starts with cancer incidence and prevalence by type, which are then multiplied by biomarker testing penetration and re-test frequencies to create demand pools. Select bottom-up checks, supplier revenue roll-ups, and sample ASP × volume snapshots ensure plausibility before totals are finalized. Key variables tracked each year include: 1) incidence of breast, lung, colorectal, prostate, and cervical cancers, 2) guideline-mandated companion diagnostic coverage, 3) laboratory reimbursement trends, 4) liquid-biopsy share of total tests, and 5) average multiplex panel price erosion. Forecasts to 2030 employ multivariate regression blended with scenario analysis so unexpected shifts in incidence or payer policy can be stress-tested. Data gaps in low-income regions are bridged by proxy metrics such as oncology drug spend and tertiary-hospital density.
Data Validation & Update Cycle
Outputs pass a three-stage review: automated variance flags, senior analyst logic checks, and sector-lead sign-off. We refresh every twelve months, with interim revisions triggered by material events such as landmark trial readouts or major reimbursement decisions, ensuring clients always receive the latest view.
Why Mordor's Cancer Biomarkers Baseline Earns Decision-Maker Trust
Published estimates often diverge because firms select different marker types, care settings, and pricing yardsticks. Our disciplined scope, yearly refresh cadence, and dual-method model reduce those blind spots.
Key gap drivers versus other publishers include: a) some studies fold in discovery-phase reagent sales that inflate totals, b) others count broader disease biomarkers beyond oncology, and c) several apply aggressive ASP growth or assume universal reimbursement without primary validation.
Benchmark comparison
| Market Size | Anonymized source | Primary gap driver |
|---|---|---|
| USD 21.37 B (2025) | Mordor Intelligence | - |
| USD 24.50 B (2024) | Global Consultancy A | Omits point-of-care exclusions and assumes 100% test reimbursement |
| USD 34.10 B (2024) | Healthcare Publisher B | Blends non-oncology biomarkers and includes R&D reagent revenue |
| USD 38.14 B (2024) | Trade Journal C | Uses list prices without region-specific ASP adjustments |
In sum, the Mordor framework ties every dollar to transparent patient numbers, verified test uptake, and real transaction prices, giving stakeholders a balanced, reproducible baseline they can rely on for strategic planning.


Key Questions Answered in the Report
What is the current size of the cancer biomarkers market?
The cancer biomarkers market size stands at USD 23.22 billion in 2026 and is forecast to reach USD 35.16 billion by 2031 at an 8.65% CAGR during the forecast period (2026-2031).
Which cancer type holds the largest share of biomarker revenues?
Breast cancer leads with 33.96% of global revenue, benefiting from established HER2, ER, and PR testing algorithms.
Why are genetic biomarkers growing faster than other biomolecule categories?
Falling sequencing costs below USD 200 per genome and AI-enabled interpretation tools have made comprehensive genomic profiling routine, fueling a 9.63% CAGR for genetic assays.
Which region is expected to post the fastest growth?
Asia-Pacific is projected to grow at a 9.76% CAGR through 2031, driven by USD 138 billion in planned healthcare digitization investments.
How do liquid biopsies compare with traditional tissue biopsies in cost and performance?
Liquid biopsies average USD 2,800 per test—higher than tissue biopsies—but offer non-invasive sampling and 83% sensitivity for colorectal cancer, with multi-cancer assays showing 98.6% specificity.
What are the primary barriers to wider adoption of biomarker testing?
High per-test costs and fragmented reimbursement systems remain the chief constraints, especially in emerging markets where budgets are limited.
Page last updated on:


