Cancer Profiling Market Size and Share
Market Overview
| Study Period | 2021 - 2031 |
|---|---|
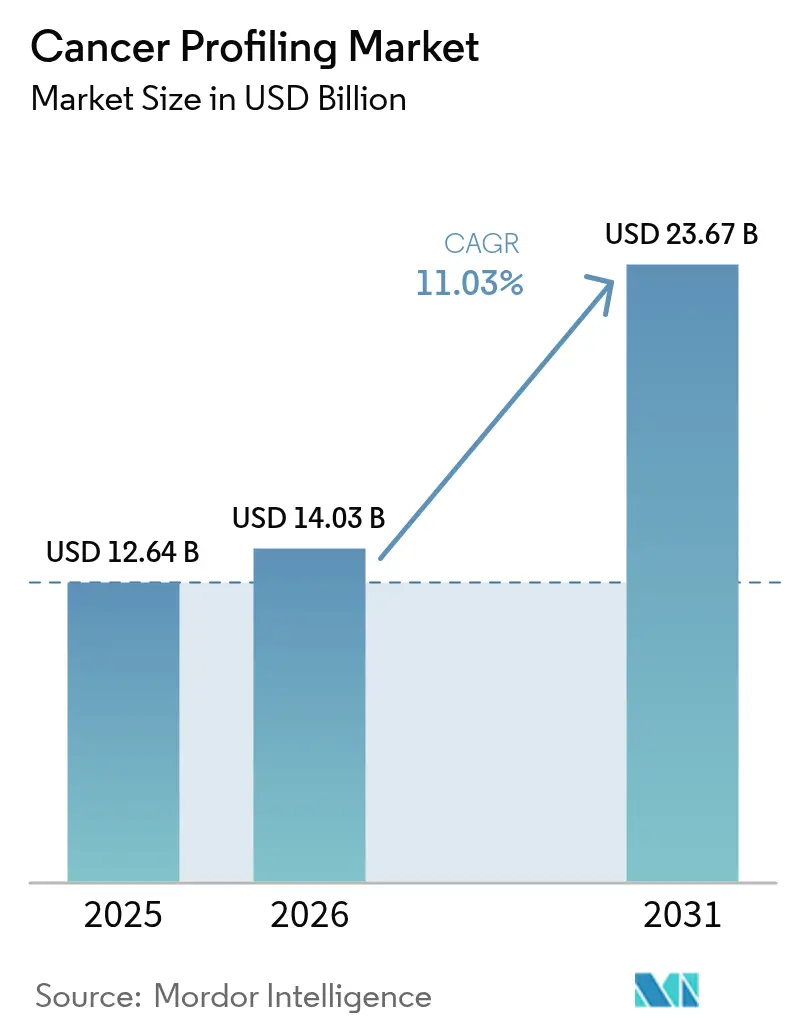
| Market Size (2026) | USD 14.03 Billion |
| Market Size (2031) | USD 23.67 Billion |
| Growth Rate (2026 - 2031) | 11.03% CAGR |
| Fastest Growing Market | Asia-Pacific |
| Largest Market | North America |
| Market Concentration | Medium |
Major Players *Disclaimer: Major Players sorted in no particular order Image © Mordor Intelligence. Reuse requires attribution under CC BY 4.0. | |
Cancer Profiling Market Analysis by Mordor Intelligence
Cancer profiling market size in 2026 is estimated at USD 14.03 billion, growing from 2025 value of USD 12.64 billion with 2031 projections showing USD 23.67 billion, growing at 11.03% CAGR over 2026-2031. Continued declines in sequencing costs, wider reimbursement for liquid‐biopsy assays, and the move toward multi-omics integration are widening access to precision oncology. Medicare’s 2025 coverage of minimal residual disease (MRD) testing is accelerating real-world adoption, while biopharma interest in companion diagnostics is expanding the panel of actionable biomarkers. North America retains leadership thanks to entrenched reimbursement pathways and a dense cluster of diagnostics innovators, yet Asia-Pacific is charting the fastest growth as China, Japan, and South Korea invest in national genomic medicine programs. Strategic partnerships that link diagnostics with targeted therapeutics, along with artificial-intelligence (AI) tools that streamline data interpretation, are reshaping competitive tactics and opening new revenue streams across the cancer profiling market.
Key Report Takeaways
- By technology, next-generation sequencing led with 35.78% revenue share in 2025; it is also the fastest-growing segment at a 13.68% CAGR through 2031.
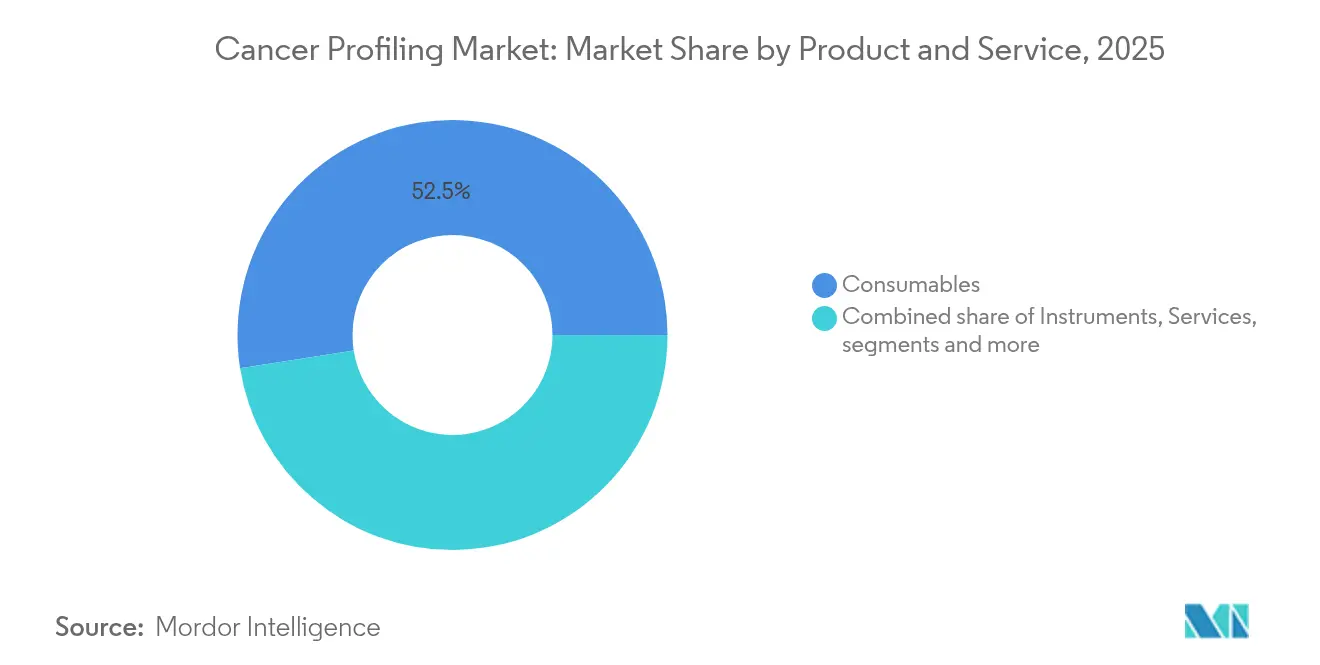
- By Product and Services, consumables held 52.47% share of the cancer profiling market size in 2025; services is advancing at a 13.88% CAGR through 2031.
- By biomarker type, genetic markers commanded 43.92% of the cancer profiling market share in 2025, while liquid cfDNA/exosome assays are projected to expand at 14.32% CAGR to 2031.
- By cancer type, breast cancer held 25.83% share of the cancer profiling market size in 2025; lung cancer is advancing at a 12.12% CAGR through 2031.
- By sample type, tissue biopsies accounted for 63.84% of the cancer profiling market size in 2025, whereas liquid biopsy is growing the fastest at 14.92% CAGR.
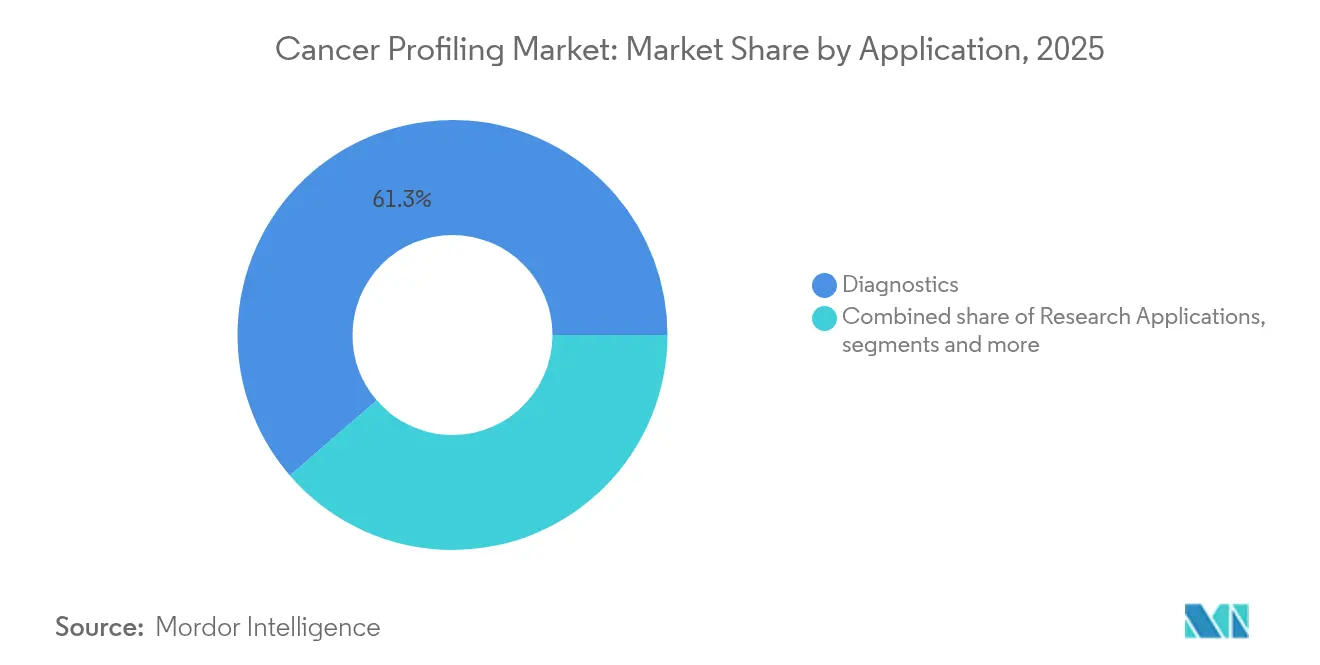
- By application, diagnostics dominated with 61.34% share in 2025, and treatment selection & monitoring is set to grow at a 13.19% CAGR.
- By end user, hospitals and reference laboratories captured 58.76% share in 2025; pharmaceutical & biotechnology companies show the highest CAGR at 12.52%.
- By geography, North America led with 44.73% of the cancer profiling market share in 2025, while Asia-Pacific is poised for the quickest expansion at a 14.01% CAGR to 2031.
Note: Market size and forecast figures in this report are generated using Mordor Intelligence’s proprietary estimation framework, updated with the latest available data and insights as of 2026.
Global Cancer Profiling Market Trends and Insights
Drivers Impact Analysis*
| Driver | (~) % Impact on CAGR Forecast | Geographic Relevance | Impact Timeline |
|---|---|---|---|
| Precision-Oncology Reimbursement Expansion in North America | +2.8% | North America, with spillover effects in Europe | Medium term (2-4 years) |
| Rapid Cost Decline of Multi-omics Sequencing Platforms in Asia-Pacific | +2.3% | Asia-Pacific, particularly China, Japan, and South Korea | Short term (≤ 2 years) |
| Pharma–CDx Co-development Partnerships for Targeted Therapies | +1.9% | Global, with concentration in North America and Europe | Medium term (2-4 years) |
| Rise of Liquid-Biopsy Based Minimal Residual Disease (MRD) Monitoring | +2.1% | North America and Europe initially, expanding globally | Medium term (2-4 years) |
| National Genomic Medicine Initiatives in Europe (e.g., Genomics England) | +1.4% | Europe, with knowledge transfer to Asia-Pacific | Long term (≥ 4 years) |
| Source: Mordor Intelligence | |||
Precision-oncology reimbursement expansion in North America
Medicare’s 2025 decision to reimburse Guardant Reveal for colorectal-cancer MRD surveillance has set a precedent that commercial payers and European health systems are already referencing. Coverage now extends beyond binary yes/no determinations and is anchored in alternative payment models that reward long-term clinical value. Accountable-care frameworks encourage oncologists to integrate genomic evidence earlier, thereby boosting panel utilization rates and solidifying North America’s influence on the cancer profiling market.
Multi-omics sequencing cost decline in Asia-Pacific
Rapid price compression for comprehensive sequencing is lowering the economic barrier for community hospitals in China, Japan, and South Korea. Bulk purchasing programs and local manufacturing agreements have cut per-sample costs, making pan-cancer blood tests viable in public insurance schemes.[1]ARK Invest, “Big Ideas 2025,” nikkoam.com.hk Regional consortia are adopting value-assessment frameworks that weigh societal savings from avoiding ineffective therapies, propelling double-digit growth across the cancer profiling market.
Pharma–CDx co-development partnerships for targeted therapies
Early-stage alignment between drug developers and diagnostics firms is shortening the path to market for targeted regimens. Seven new FDA companion-diagnostic approvals secured by Foundation Medicine in 2024 demonstrate the commercial upside of integrated clinical-trial designs. Diagnostic partners now participate from pre-clinical phases, ensuring assays launch concurrently with drugs, which in turn amplifies test volumes and cements the cancer profiling market as a strategic asset class.
Rise of liquid-biopsy MRD monitoring
Liquid-biopsy assays that detect circulating tumor DNA are redefining post-surgical surveillance. Guardant Reveal and Natera’s Signatera secured Medicare coverage in 2025, and ongoing studies show MRD-guided intervention can pre-empt relapse months before radiology. Clinicians value the non-invasive workflow and quicker turnaround, prompting hospitals to incorporate serial MRD monitoring into bundled oncology care paths across the cancer profiling market
Restraints Impact Analysis*
| Restraint | (~) % Impact on CAGR Forecast | Geographic Relevance | Impact Timeline |
|---|---|---|---|
| Limited Availability of Matched Tumor-Normal Samples in Emerging Markets | -1.2% | Emerging markets in Asia-Pacific, Latin America, and Africa | Medium term (2-4 years) |
| Data-Interoperability Gaps Across Hospital LIS / EMR Systems | -1.6% | Global, with greater impact in regions with fragmented healthcare systems | Medium term (2-4 years) |
| Shortage of Molecular Pathologists in Mid-tier Oncology Centers | -1.4% | Global, particularly acute in rural and underserved regions | Long term (≥ 4 years) |
| High Up-front CAPEX for Fully-Automated NGS Workflows | -1.1% | Emerging markets and smaller healthcare facilities globally | Short term (≤ 2 years) |
| Source: Mordor Intelligence | |||
Data-interoperability gaps across hospital information systems
Disparate laboratory information systems and electronic health records limit the flow of structured genomic data. Rural US physicians record lower interoperability scores, and similar fragmentation is evident in Latin America and Southeast Asia.[2]Anzalone A.J. et al., “EHR Adoption and Interoperability Study,” biomedcentral.com The resulting data silos slow multidisciplinary decision-making, hinder AI-driven analytics, and temper the growth velocity of the cancer profiling market until standardized data-exchange protocols gain wider traction.
Shortage of molecular pathologists in mid-tier oncology centers
Vacancies in pathology posts exceed 70% in certain health networks, stretching review times for complex genomic reports. Emerging economies suffer the most acute talent gaps, but urban hospitals in Europe also cite constraints. Remote sign-out platforms and decision-support software provide partial relief; however, sustained training pipelines will be required to unlock the full potential of precision diagnostics across the cancer profiling market.
*Our forecasts treat driver/restraint impacts as directional, not additive. The impact forecasts reflect baseline growth, mix effects, and variable interactions.
Segment Analysis
By Product and Service: Consumables Lead While Services Accelerate
Consumables captured 52.47% of the cancer profiling market share in 2025, underlining the steady, repeat-purchase model that sustains laboratories and reagent suppliers. This dominance rests on assay kits, reagents, and sample-prep materials that keep instruments running and enable both legacy and next-generation workflows. Continuous product refreshes—such as QIAGEN’s QIAseq panels covering more than 700 genes—boost performance while trimming hands-on time, reinforcing consumables’ pull on the cancer profiling market. As the global installed base of sequencing and PCR systems widens, every incremental test run enlarges the cancer profiling market size flowing through reagent channels and strengthens vendor lock-in.
Services are advancing at a 13.88% CAGR to 2031, reflecting rising demand for integrated testing, bioinformatics, and clinical reporting. Eurofins Scientific’s 4.7% organic growth in 2024, led by Clinical Diagnostics and BioPharma units, illustrates how specialized providers translate complex data into actionable results for hospitals and drug developers. Instrument suppliers continue to invest heavily in software and analytics—Thermo Fisher Scientific allocated USD 1.3 billion to R&D in 2024, much of it aimed at precision-medicine tools that simplify genomic data interpretation. Artificial-intelligence engines that now surpass physicians in diagnosing complex cases, as reported by Stanford’s 2025 AI Index, are being embedded into reporting platforms to speed turnaround and reduce variability. These dynamics position service and software providers as critical partners for laboratories that lack in-house bioinformatics capacity, further diversifying revenue streams within the cancer profiling industry.


By Technology: NGS Sustains Dual Leadership
Next-generation sequencing (NGS) contributed 35.78% of the cancer profiling market size in 2025 and continues to expand at a 13.68% CAGR. High-throughput instruments such as NovaSeq X have cut cost-per-gigabase figures, enabling large gene panels that capture complex mutational signatures. Long-read sequencers from Pacific Biosciences and Oxford Nanopore are gaining foothold for structural-variant detection, while mass-spectrometry workflows complement genomic assays with protein-level insights. Immunoassays and PCR remain valuable for rapid single-gene testing in community settings, yet their shares are gradually eroding as hospitals migrate toward unified NGS pipelines. Competitive differentiation increasingly rests on bioinformatics usability, sample-throughput flexibility, and the ability to integrate genomic, transcriptomic, and methylation signals within a single-report framework, reinforcing NGS as the engine of innovation within the cancer profiling market.
Despite its ascendancy, NGS adoption still faces capital-investment hurdles in smaller centers. Vendors are countering with benchtop systems and reagent-rental agreements that spread costs over reagent volumes. Cloud-based secondary analysis pipelines reduce on-premises IT needs, opening NGS access to mid-income countries. This democratization underpins steady expansion of the cancer profiling market, even as competing modalities jostle for niche applications.
By Biomarker Type: Genetic Markers Anchor, Liquid Biomarkers Accelerate
Genetic alterations accounted for 43.92% of cancer profiling market share in 2025, affirming their entrenched role in therapy selection for EGFR, ALK, BRAF, and beyond. AI-enhanced variant-calling algorithms now achieve sub-1% allelic-fraction sensitivity, boosting confidence in low-tumor-purity samples. Liquid-biopsy analytes—ctDNA, exosomes, and fragmentomics—are set to outpace at a 14.32% CAGR as reimbursement widens and analytical sensitivity improves.
Integrated cfDNA-RNA panels are entering clinical workflows, melding mutational and expression signals to refine actionable calls. Protein and metabolic markers remain central to prognosis and immuno-oncology stratification, with spatial proteomics platforms mapping tumor microenvironments in three dimensions. Circulating-tumor-cell enumeration is progressing through microfluidic enrichment and AI-guided morphometric scoring but still awaits broad clinical acceptance. Together these biomarker classes create complementary datasets that serve the expanding evidence needs of the cancer profiling market.
By Cancer Type: Breast Cancer Leads, Lung Cancer Grows Fastest
Breast malignancies represented 25.83% of the cancer profiling market in 2025, a share driven by mandatory HER2, ER/PR, and BRCA testing protocols. ctDNA assays for recurrence now flag relapse up to 68 months ahead of imaging, tilting follow-up protocols toward molecular surveillance.
Lung cancer profiling grows at 12.12% CAGR, propelled by guidelines that require multiplex testing for EGFR, ALK, ROS1, KRAS, and NTRK alterations. Expanded MRD reimbursement in lung cancer adds further pull. Colorectal, prostate, and melanoma cohorts continue to enlarge the clinical utility landscape, while hematologic malignancies benefit from ultra-deep sequencing of minimal residual disease across 40 plus biomarkers. This diverse tumor spectrum reinforces the breadth of demand that sustains the cancer profiling market.
By Sample Type: Tissue Still Dominates, Liquid Biopsy Surges
Tissue biopsies held 63.84% of the cancer profiling market size in 2025 because they anchor diagnostic confirmation and allow histopathology correlation. Yet invasive sampling, necrosis, and intratumoral heterogeneity challenge repeat testing. Guardant360 Tissue’s launch, which trims slide requirements by 40%, illustrates vendor attempts to streamline tissue workflows.
Liquid biopsies expand at 14.92% CAGR, capturing real-time tumor evolution through serial blood draws. MRD surveillance, early-detection pilots, and therapy-response tracking are scaling volumes swiftly, while urine, saliva, and at-home finger-stick kits explore niche screening opportunities. The coexistence of both sample types broadens the utility of the cancer profiling market across clinical scenarios.
By Application: Diagnostics Prevail; Monitoring Climbs
Diagnostic use cases accounted for 61.34% revenue in 2025, spanning initial tumor classification, sub-typing, and eligibility checks for targeted or immune therapies. AI-assisted report generators are cutting review times and harmonizing interpretations across sites.
Treatment selection and longitudinal monitoring accelerate at 13.19% CAGR, anchored in MRD and progression analysis that inform timely therapy switches. Prognosis, risk stratification, and population-screening pilots round out a toolkit that positions the cancer profiling market as a continuum service, extending from screening to survivorship.
By End User: Hospitals Command, Pharma Expands
Hospitals and reference labs controlled 58.76% share in 2025, sustained by integrated care pathways that bundle diagnostics with surgical and medical oncology services. Epic and Cerner upgrades now embed discrete genomic fields, enabling point-of-care alerts for actionable variants.
Pharmaceutical and biotechnology firms, growing at 12.52% CAGR, increasingly outsource and in-source profiling capacity to accelerate biomarker discovery and optimize trial enrollment. Academic centers and contract research organizations remain engines for technology validation, ensuring a multi-stakeholder demand base that stabilizes the cancer profiling market.
Geography Analysis
North America’s 44.73% position reflects mature reimbursement, high EHR penetration in urban centers, and a robust innovation pipeline. Medicare coverage for both tissue and liquid MRD assays catalyzes uptake, even as rural interoperability gaps slow uniform access. Canada and Mexico trail but benefit from cross-border clinical trials that subsidize testing.
Europe holds second place, buoyed by Genomics England, Germany’s national molecular tumor boards, and France’s Plan France Médecine Génomique. Implementation of pan-European health-technology assessments starting 2025 will harmonize value dossiers, potentially compressing time-to-reimbursement for new assays. Eastern European uptake lags due to funding bottlenecks, yet EU cohesion projects are addressing these disparities, thereby widening the cancer profiling market footprint.
Asia-Pacific records the fastest growth at 14.01% CAGR as China’s domestic NGS manufacturers scale capacity and Japan integrates tumor boards within public insurance. South Korea pilots AI-assisted multi-omics panels, while India’s private networks roll out low-cost gene bundles alongside tele-oncology consultations. Workforce shortages remain acute, but regional governments are funding molecular-pathology fellowships, underscoring long-run commitment to the cancer profiling market.


Competitive Landscape
Competitive Landscape
The cancer profiling market displays moderate concentration as incumbent diagnostic companies, pharmaceutical firms with companion diagnostic portfolios, and agile liquid-biopsy specialists compete for share. Leading players are gradually moving from single-platform offerings toward end-to-end profiling solutions that cover tissue, blood, and other sample types across genomic, transcriptomic, and epigenomic biomarkers. Guardant Health illustrated this shift in April 2025 with the release of Guardant360 Tissue, a test that aligns with its liquid-biopsy franchise while requiring 40% fewer tissue slides than prevailing laboratory protocols.[3]Guardant360 Tissue Launches Multi-omic Cancer Profiling,” investors.guardanthealth.comOther large platforms are purchasing bioinformatics start-ups to accelerate multiomic data interpretation, and many have upgraded internal R&D teams to embed artificial-intelligence models into clinical reporting workflows.
Partnership activity between diagnostics manufacturers and pharmaceutical innovators is reshaping competitive dynamics. Co-development arrangements dominate the launch of companion diagnostics with targeted therapies, shortening timelines and sharing regulatory risk. Contracts often include joint clinical-trial enrollment, regulatory submissions, and coordinated market-access efforts, giving partnered tests an edge in payor negotiations post drug approvals. Companies are racing to validate minimal-residual-disease assays that can be performed serially and reimbursed under existing molecular-pathology codes. Early-cancer detection is another white-space arena, with proof-of-concept studies quickly advancing to multi-center trials backed by venture funding.
Technological capability increasingly separates leaders from followers. Vendors that combine large clinical variant databases with AI-driven annotation engines can deliver actionable reports in under 5 days, a turnaround time that influences hospital purchasing decisions. Multiomic integration allows these firms to detect copy-number changes, fusions, and methylation patterns within a single workflow, improving oncologist confidence in test selection. As clinical evidence bolsters the case for comprehensive genomic profiling in cancer treatment, payors are increasingly tying reimbursements to the outcomes of these profiles. This shift underscores the growing competitive edge in the healthcare market for those offering extensive profiling panels backed by robust analytics.
Cancer Profiling Industry Leaders
Illumina, Inc
QIAGEN
Sysmex Corporation
NeoGenomics Laboratories
HTG Molecular Diagnostics, Inc.
- *Disclaimer: Major Players sorted in no particular order

Recent Industry Developments
- May 2025: Leica Biosystems and Bristol Myers Squibb announced a strategic CDx partnership.
- May 2025: NeoGenomics debuted the PanTracer family of genomic profiling tests and Paletrra spatial-proteomics platform.
- April 2025: QIAGEN introduced 700-plus-gene QIAseq panels and partnerships with Element Biosciences and Myriad Genetics.
- January 2025: Guardant Health received Medicare coverage for Guardant Reveal MRD testing in colorectal-cancer surveillance.


Research Methodology Framework and Report Scope
Market Definitions and Key Coverage
Our study defines the cancer profiling market as every commercial test or related consumable, software, and service that interrogates tumor DNA, RNA, or protein signatures from tissue or liquid specimens to guide diagnosis, prognosis, treatment selection, or research. This includes comprehensive genomic panels, single-gene PCR kits, multi-omics bioinformatics pipelines, and the laboratory instruments that enable them.
Scope exclusion: routine histopathology that does not generate molecular readouts is outside the market.
Segmentation Overview
- By Product & Service
- Instruments
- Consumables
- Services
- Software & Bioinformatics
- By Technology
- Immunoassays
- Next-Generation Sequencing (NGS)
- Polymerase Chain Reaction (PCR)
- In-situ Hybridization (ISH)
- Microarrays
- Mass Spectrometry
- Other Technologies
- By Biomarker Type
- Genetic Biomarkers
- Protein Biomarkers
- Metabolic Biomarkers
- Circulating Tumor Cells (CTCs)
- Exosomal & cfDNA Biomarkers
- Other Biomarker Types
- By Cancer Type
- Breast Cancer
- Lung Cancer
- Colorectal Cancer
- Prostate Cancer
- Melanoma
- Other Cancer Types
- By Sample Type
- Tissue-based Samples
- Liquid Biopsy (Blood)
- Urine & Other Biofluids
- By Application
- Diagnostics
- Prognosis & Risk Assessment
- Treatment Selection & Monitoring
- Research Applications
- Screening & Early Detection
- By End User
- Hospitals & Reference Laboratories
- Academic & Research Institutes
- Pharmaceutical & Biotechnology Companies
- Contract Research Organizations
- By Geography
- North America
- United States
- Canada
- Mexico
- Europe
- Germany
- United Kingdom
- France
- Italy
- Spain
- Rest of Europe
- Asia-Pacific
- China
- Japan
- India
- Australia
- South Korea
- Rest of Asia-Pacific
- Middle East & Africa
- GCC
- South Africa
- Rest of Middle East & Africa
- South America
- Brazil
- Argentina
- Rest of South America
- North America
Detailed Research Methodology and Data Validation
Primary Research
Our analysts interviewed molecular oncologists, reference-lab managers, payor policy advisers, and sequencing-platform engineers across North America, Europe, and Asia-Pacific. These conversations validated test utilization rates, average selling prices, reimbursement uptake, and capacity additions, and they revealed region-specific bottlenecks that desk work alone could miss.
Desk Research
We mapped the universe of addressable tests through public registries such as GLOBOCAN, SEER, and the European Cancer Information System, matched reimbursement codes from CMS and Japan's MHLW schedules, and analyzed import-export HS-code flows for NGS instruments. Journals indexed on PubMed and clinical-trial registries clarified emerging biomarkers, while trade associations like CAP and the Personalized Medicine Coalition framed regulatory context. Subscription feeds from D&B Hoovers and Dow Jones Factiva supplied company revenues and new-product news. These references illustrate, not exhaust, the secondary corpus consulted; many further sources were captured to round out volumes, prices, and pipeline momentum.
Market-Sizing & Forecasting
A top-down prevalence-to-treated-cohort reconstruction anchored the 2024 base, starting with incidence of high-priority cancers, biopsy rates, and test adoption shares, which are then multiplied by blended ASPs. Supplier roll-ups and sampled hospital channel checks provided bottom-up cross-tests, adjusting totals where gaps appeared. Key model fingerprints include: 1) yearly sequencing cost per Gb, 2) CAP-accredited lab installed base, 3) Medicare CPT code payment trends, 4) share of liquid biopsies in metastatic monitoring, and 5) FDA companion-diagnostic approvals. Multivariate regression, informed by these drivers and expert consensus, projects volumes through 2030 under conservative, base, and accelerated uptake scenarios.
Data Validation & Update Cycle
Outputs pass anomaly screens, peer review, and a senior analyst sign-off. The model refreshes annually and is re-opened when material events, such as major reimbursement wins, regulatory shifts, or step-change technology launches, occur, ensuring clients always receive a current view.
Why Mordor's Cancer Profiling Baseline Commands Reliability
Published estimates often diverge because firms pick different cut-off years, bundle adjacent biomarker segments, or assume uniform pricing across geographies.
Key gap drivers include narrower technology scopes, optimistic penetration curves that ignore reimbursement lag, and infrequent refresh cycles that miss rapid ASP erosion for NGS panels. Mordor's analysts revisit scope every year, align currency conversions to IMF averages, and temper forecasts with verified lab-capacity additions, which keeps our baseline grounded.
Benchmark comparison
| Market Size | Anonymized source | Primary gap driver |
|---|---|---|
| 12.64 B (2025) | Mordor Intelligence | - |
| 13.48 B (2024) | Global Consultancy A | Combines broad biomarker kits with imaging agents; refresh every three years |
| 11.50 B (2023) | Industry Association B | Uses list prices, no regional ASP adjustments |
| 10.50 B (2023) | Trade Journal C | Excludes liquid-biopsy volumes now widely reimbursed |
Taken together, the comparison shows that when scope clarity, timely updates, and dual-track validation are applied, Mordor's numbers form a balanced baseline that decision-makers can trace, replicate, and confidently use.


Key Questions Answered in the Report
What is the current value of the cancer profiling market?
The cancer profiling market generated USD 14.03 billion in 2026 and is projected to reach USD 23.67 billion by 2031, supported by a 11.03% CAGR over 2026-2031.
Which technology accounts for the largest share of cancer profiling tests?
Next-generation sequencing held 35.78% revenue in 2025, making it the leading technology due to its ability to interrogate hundreds of genes simultaneously.
How fast is liquid biopsy growing within cancer profiling?
Liquid biopsy testing is expanding at a 14.92% CAGR through 2031 because ctDNA assays enable non-invasive minimal residual disease monitoring and real-time treatment adjustment.
Which region is expected to exhibit the highest growth?
Asia-Pacific is forecast to grow at 14.01% CAGR through 2031 as sequencing costs fall and national genomics initiatives boost testing capacity across China, India, and Japan.
Why are data-interoperability standards important for laboratories?
Interoperability frameworks such as mCODE allow genomic results to integrate into electronic medical records, shortening therapy decision times and enabling longitudinal outcome analysis.
Page last updated on:


