
Market Overview
| Study Period | 2020 - 2031 |
|---|---|
| Forecast Data Period | 2026 - 2031 |
| Base Year Market Size (2025) | USD 3.83 Billion |
| Market Size (2026) | USD 5.06 Billion |
| Market Size (2031) | USD 20.39 Billion |
| Growth Rate (2026 - 2031) | 32.15 % |
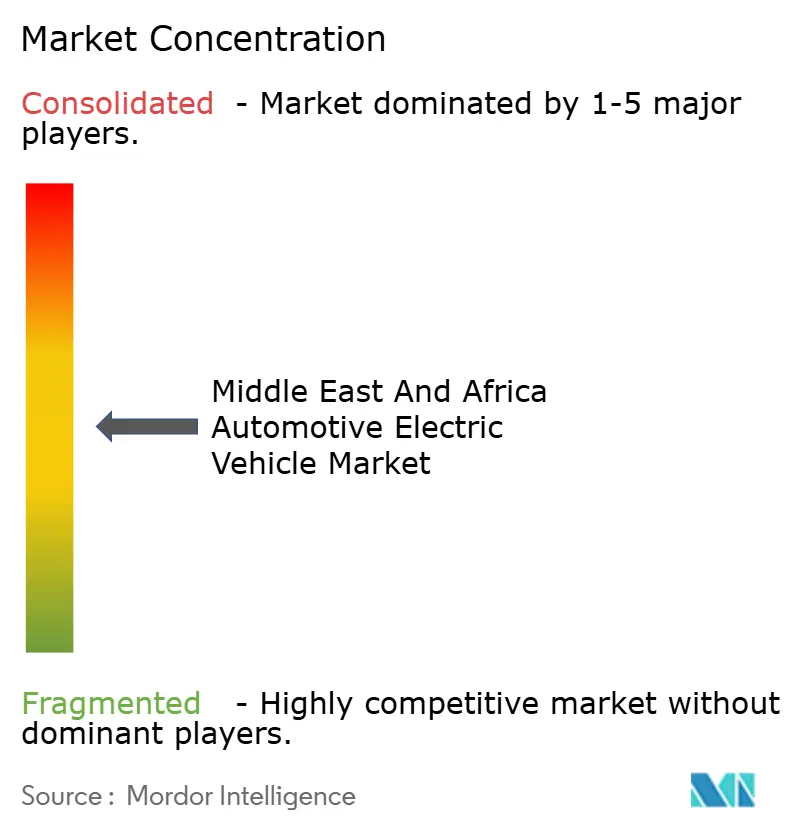
| Market Concentration | Medium |
Major Players *Disclaimer: Major Players sorted in no particular order Image © Mordor Intelligence. Reuse requires attribution under CC BY 4.0. | |
Middle East and Africa Electric Vehicle Market Analysis by Mordor Intelligence
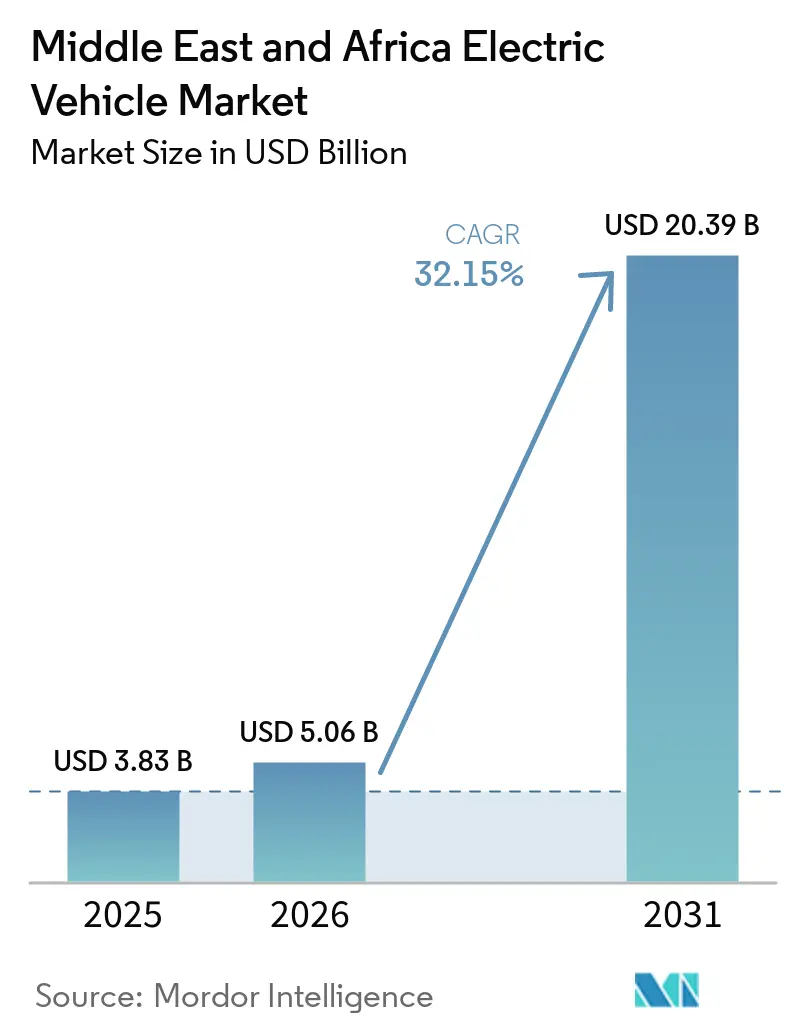
The electric vehicle market size in the Middle East and Africa was valued at USD 3.83 billion in 2025 and estimated to grow from USD 5.06 billion in 2026 to reach USD 20.39 billion by 2031, at a CAGR of 32.15% during the forecast period (2026-2031). Sovereign wealth funds are directing multibillion-dollar allocations toward domestic production ecosystems, and oil-exporting nations are leveraging abundant solar resources to lower charging costs and attract global original-equipment manufacturers (OEMs). Binding decarbonization mandates, falling battery costs, and the rollout of public fast-charging corridors reinforce demand momentum even as used internal-combustion-engine (ICE) imports remain a short-term headwind. Passenger cars retain the most extensive installed base, yet commercial fleets increasingly dominate incremental volume as oil-and-gas operators issue bulk electrification tenders. Strategic partnerships between energy majors and automakers and hot-climate battery-thermal innovations are positioning the region as a technical test bed for extreme-heat EV performance.
Key Report Takeaways
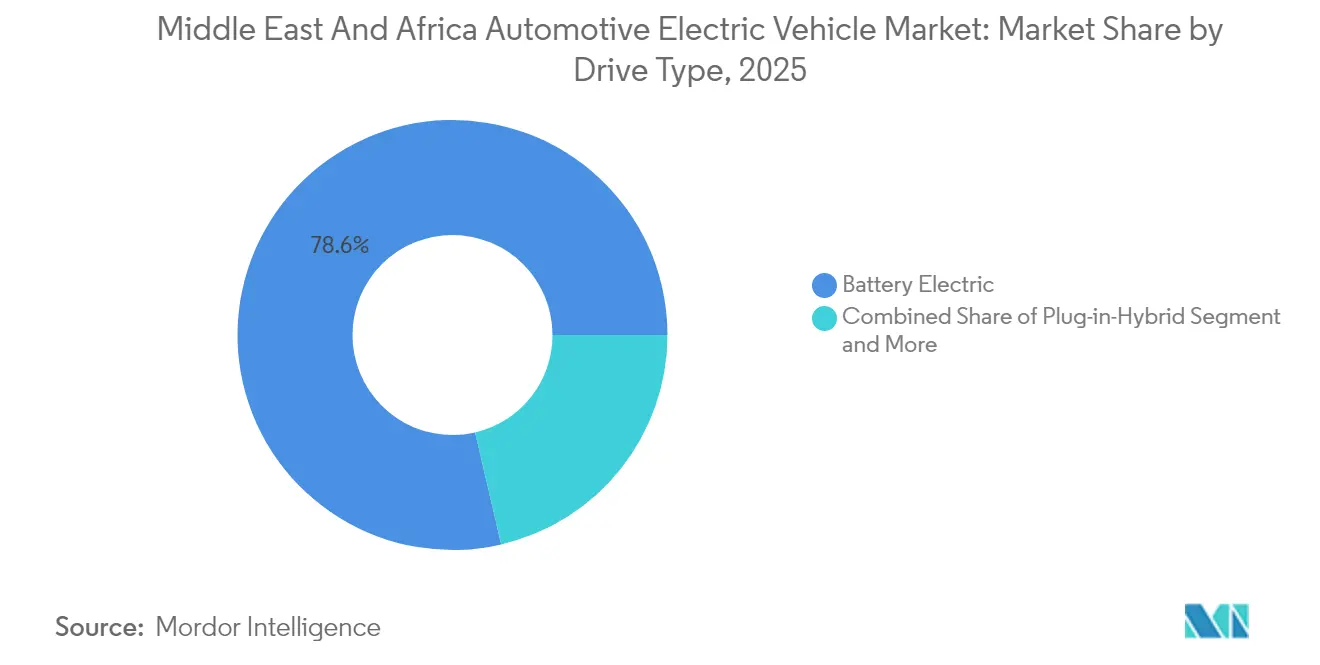
- By drive type, battery-electric vehicles held 78.64% of the Middle East and Africa automotive electric vehicle market share in 2025, while fuel-cell models are forecast to advance at a 35.90% CAGR through 2031.
- By vehicle type, passenger cars accounted for 64.05% of the Middle East and Africa automotive electric vehicle market share in 2025, and medium & heavy commercial vehicles are projected to expand at a 35.05% CAGR to 2031.
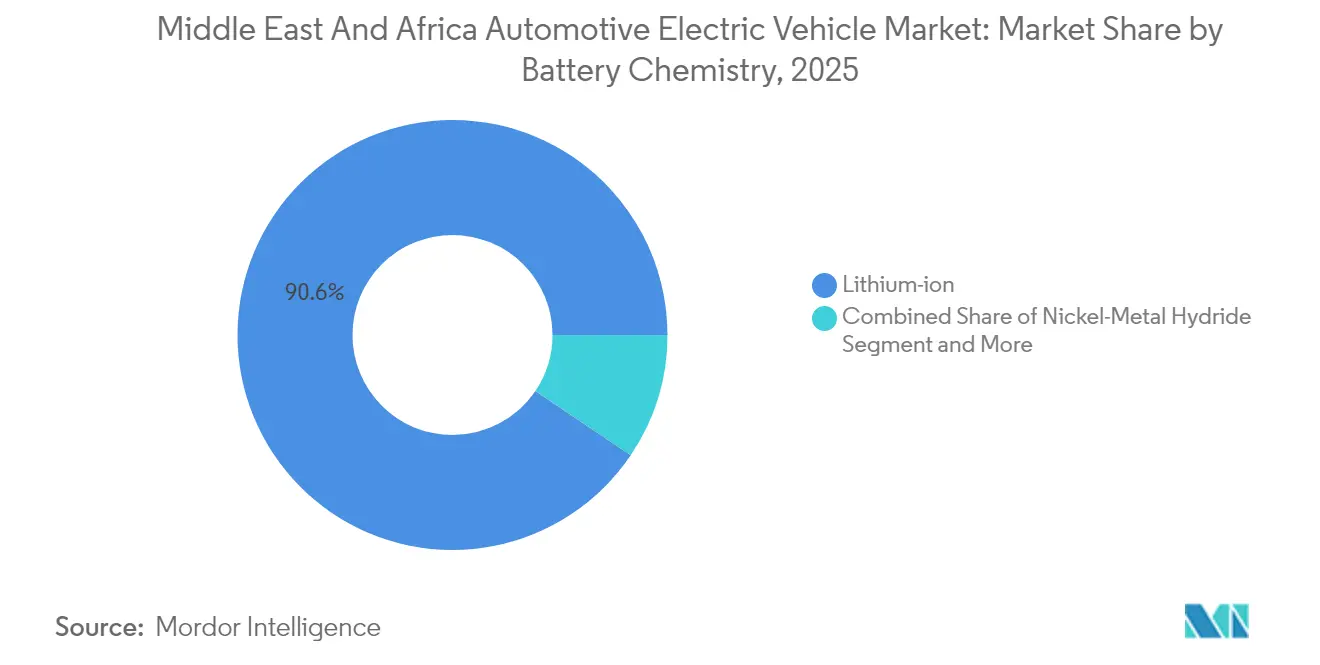
- By battery chemistry, lithium-ion captured 90.55% of the Middle East and Africa automotive electric vehicle market share in 2025, whereas “other” chemistries are poised for the fastest 39.40% CAGR through 2031.
- By charging level, AC installations below 7 kW dominated the Middle East and Africa automotive electric vehicle market share in 2025 deployments, with 50.62%; DC fast chargers above 22 kW are expected to climb at a 38.95% CAGR over the forecast horizon.
- By country, the UAE led with a 32.20% of the Middle East and Africa automotive electric vehicle market share in 2025, and Saudi Arabia is projected to record the highest 32.10% CAGR between 2026-2031.
Note: Market size and forecast figures in this report are generated using Mordor Intelligence’s proprietary estimation framework, updated with the latest available data and insights as of 2026.
Market Trends and Insights
Drivers Impact Analysis of Middle East and Africa Electric Vehicle Market*
| Driver | (~) % Impact on CAGR Forecast | Geographic Relevance | Impact Timeline |
|---|---|---|---|
| Decarbonization Mandates and ICE Bans | +8.2% | GCC, Egypt, South Africa | Medium term (2-4 years) |
| DC Fast-Charger Corridor Rollout | +6.3% | Saudi Arabia, UAE, Morocco | Medium term (2-4 years) |
| EV Import Subsidies And Zero Duties | +5.7% | UAE, Saudi Arabia, Qatar, Oman | Short term (≤ 2 years) |
| Falling Battery Costs And Longer Range | +4.9% | Global spillover to MENA | Long term (≥ 4 years) |
| Solar Surplus And Low-Tariff Charging | +4.4% | MENA & Sub-Saharan Africa | Long term (≥ 4 years) |
| Oil And Gas Fleet Electrification | +3.8% | Saudi Arabia, other GCC members | Medium term (2-4 years) |
| Source: Mordor Intelligence | |||
Government Decarbonization Mandates and ICE-Ban Targets
Gulf Cooperation Council (GCC) members have embedded electric-mobility quotas into national development agendas, creating demand floors that anchor OEM investment decisions. Saudi Arabia’s Vision 2030 compels 30% of Riyadh’s vehicles to be electric by 2030, while the UAE’s federal strategy targets a 50% electric-vehicle mix by 2050[1]. These directives funnel public-sector procurement toward zero-emission models, catalyze private-sector fleet conversions, and standardize certification under Gulf Standardization Organization (GSO) rules, which ease cross-border trade. Morocco’s mandates 2,500 charging points by 2026, illustrating how firm policy anchors accelerate infrastructure scale-up. Binding targets dovetail with COP28 commitments, giving investors long-cycle visibility, compensating for initial demand volatility.
Rapid Rollout of Public DC Fast-Charging Corridors
Intercity fast-charging corridors convert EVs from urban runabouts into region-wide mobility options. EVIQ’s flagship 150 kW site on the Riyadh–Qassim motorway demonstrates highway viability and signals forthcoming coverage of the kingdom’s 10 busiest arterial routes. In parallel, the UAE plans 70,000 public chargers across Abu Dhabi by 2030, while Dubai targets 1,000 sites by 2025, effectively eliminating intra-emirate range anxiety[2]. Morocco’s plan links Casablanca, Rabat, and Tangier with green-energy-powered DC units that supply sub-30-minute stops. Nigeria’s 2025 inauguration of West Africa’s largest assembled charging hub widens the infrastructure map to frontier markets. Corridor density materially lifts commercial-vehicle uptime, unlocking electrification for freight operators serving ports such as Jebel Ali.
Day-Time Solar-PV Surplus Driving Ultra-Low-Cost Charging Tariffs
With levelized solar costs already under USD 0.02 per kWh in parts of MENA, midday generation surpluses have opened a pathway to sub-USD 0.10 / L-gasoline-equivalent charging tariffs. Saudi Arabia aims for 58.7 GW of renewables by 2030, aligning solar peaks with workplace-charging demand[3]. Morocco’s renewables-backed Tangier-Kenitra automotive zone feeds car plants and charging forecourts from the same grid, erasing fossil-linked price volatility. Vehicle-to-grid programs in Jordan and Israel now monetize idle battery storage during evening peaks, creating ancillary revenue streams that sweeten fleet business cases.
Oil-and-Gas Fleet-Electrification Pledges Unlocking Bulk Orders
Hydrocarbon producers increasingly hard-wire sustainability into capital plans, spawning predictable multi-thousand-unit purchase orders that justify local assembly lines. Aramco’s acquisition of 10% of HORSE Powertrain Limited for EUR 7.4 billion (USD 8.1 billion) facilitates hybrid and battery-electric conversion [4]. Saudi hydrogen pilots expand the business case to fuel-cell trucks servicing refinery clusters. Similar pledges by ADNOC, ENOC, and Sonangol are enlarging the regional addressable fleet pool beyond passenger cars. These enterprise contracts shorten OEM payback periods, lowering break-even volumes for Saudi Arabia’s Ceer, Turkey’s Togg, and Hyundai-PIF’s new King Abdullah Economic City plant.
Restraints Impact Analysis of Middle East and Africa Electric Vehicle Market*
| Restraint | (~) % Impact on CAGR Forecast | Geographic Relevance | Impact Timeline |
|---|---|---|---|
| High Upfront Price and Weak Financing | -4.8% | Africa, lower-income MENA markets | Short term (≤ 2 years) |
| Cheap Used ICE Imports | -3.7% | Africa, with spillover to MENA | Long term (≥ 4 years) |
| Limited Hot-Climate EV Models | -3.2% | GCC countries, North Africa | Medium term (2-4 years) |
| Grid Unreliability and Charger Downtime | -2.9% | Sub-Saharan Africa | Medium term (2-4 years) |
| Source: Mordor Intelligence | |||
High Upfront Vehicle Price and Limited Consumer Financing
Purchase-price premiums continue to deter mass-market adoption in lower-income segments even as batteries cheapen. Egypt’s EV share remains just 0.1% of new-car sales due to limited installment plans and hard-currency outlays that expose buyers to exchange-rate swings. Traditional lenders, accustomed to securitizing used imports, lack residual-value benchmarks for electric vehicle market loans, inflating interest spreads. In Sub-Saharan Africa, microfinance mechanisms target two-wheeler taxis rather than four-wheeler purchases, further stalling scale economics for OEMs.
Influx of Cheap Used ICE Imports Undermines EV Demand
Eighty-five percent of Africa’s circulating fleet comprises second-hand ICE vehicles shipped from stricter-emission jurisdictions, maintaining a low-price alternative that undercuts new EVs [5]. Loosely enforced age caps in markets like Nigeria and Benin prolong the diesel influx, weakening policy-driven electrification signals. This saturation compresses residual-value forecasts for new models, complicating lease and loan product design. Regulatory fragmentation also impedes harmonized scrap and recycling standards, allowing high-emission units to cross borders and dilute air-quality gains promised by the electric vehicle market. Policymakers in Kenya and Ghana have begun tightening import-age ceilings, but enforcement capacity remains uneven.
*Our forecasts treat driver/restraint impacts as directional, not additive. The impact forecasts reflect baseline growth, mix effects, and variable interactions.
Middle East and Africa Electric Vehicle Market Segment Analysis
By Drive Type:
Battery-Electric Vehicles Consolidate DominanceBattery-electric vehicles (BEVs) commanded 78.64% of the electric vehicle market share in 2025, validating the region’s preference for fully electric drivetrains and sidestepping the fuel-duty complexity of plug-in hybrids. BEV appeal stems from simpler maintenance and the rollout of destination chargers at malls, airports, and industrial parks. The segment’s robust margin structure has enticed Tesla, BYD, and Geely to launch direct-to-consumer sales portals that bypass traditional dealerships.
Fleet operators adopt BEVs for depot-night charging, reducing daytime operational disruptions. Fuel-cell electric vehicles post a 35.90% CAGR through 2031 as Saudi Arabia scales green-hydrogen refueling nodes around its industrial corridors, underscoring their long-haul potential. Meanwhile, plug-in hybrids remain transitional, offering range security where grid reliability lags. The drive-type mix therefore mirrors infrastructure maturity, with BEVs prevailing in the urban Gulf and fuel-cells rising along desert freight links.

By Vehicle Type:
Commercial Fleets Gain Share MomentumPassenger cars controlled 64.05% of 2025 revenue, yet medium and heavy commercial vehicles are forecast to outpace with a 35.05% CAGR to 2031, expanding the electric vehicle market size in corporate procurement channels. Oil-field service trucks and last-mile delivery vans accrue higher daily mileage, magnifying fuel savings and carbon audit benefits. Logistics firms in the Jeddah free zone now specify electric models in tenders to comply with port authority emissions limits. Bus electrification pilots in Cairo and Cape Town indicate growing public-transport appetite, while ride-hailing operators deploy small hatchback EVs to meet city-center clean-air mandates. OEMs are responding with region-tuned payload ratings, enhanced cabin HVAC, and reinforced suspensions for unpaved routes. As commercial volumes climb, supply-chain localization deepens because truck bodies, battery enclosures, and telematics services can all be sourced domestically.
By Battery Chemistry:
Lithium-Ion Retains Supremacy Amid Emerging AlternativesLithium-ion technologies captured 90.55% of 2025 sales and underpin the current electric vehicle market size due to mature supply chains and favorable energy-density-to-cost ratios. Morocco’s fast-growing cathode-materials cluster and UAE-based cell-pack assemblers shorten lead times and reduce import duties. However, sodium-ion and lithium-iron-manganese-phosphate (LFMP) chemistries are gaining ground, driving a 39.40% CAGR in the “other” category through 2031. These chemistries reduce cobalt dependency and offer superior thermal tolerance for Gulf summers, aligning with OEM ambitions to cut material volatility. Recycling capacity expansions in South Africa and Bahrain aim to recover nickel and manganese, supporting a circular ecosystem. Nickel-metal hydride batteries continue in hybrid niches where cost is paramount, particularly in lower-income North-African fleets. Overall, chemistry diversification lowers supply-security risks and encourages domestic R&D investments.
By Charging Level:
Fast-Charging Surge Reinforces Intercity ViabilityAC units below 7 kW represented 50.62% of the the installed base in 2025, reflecting home-garage and workplace dominance during the early adoption phase of the electric vehicle market. Nonetheless, DC fast chargers exceeding 22 kW are projected to have a 38.95% CAGR by 2031 as governments co-finance highway corridors. Saudi Arabia’s plan for 5,000 high-power plugs will fill desert gaps and relay trucks between ports and inland dry docks. Emerging megawatt-scale systems support heavy-duty rigs, trimming recharge downtime to mandated driver-rest windows. Solar-roof canopies and grid-storage batteries offset peak-time draws, demonstrating integrated energy-mobility business models. Semi-fast AC (7–22 kW) bridges suburban malls and fleet depots where dwell times sit below eight hours. The charging-mix evolution thus underpins mass adoption by matching dwell patterns across user segments.
Geography Analysis
EMEA Electric Vehicle Market
The UAE held 32.20% of 2025 sales, testimony to early infrastructure, streamlined import duties, and affluent buyers willing to pay premiums for advanced infotainment packages. Dubai Electricity and Water Authority’s target of 42,000 on-road EVs by 2030 cements a flywheel where charging density and consumer uptake reinforce each other. Saudi Arabia’s 32.10% CAGR through 2031 reflects Vision 2030’s USD 39 billion ecosystem investment spanning mining, cathode materials, and final vehicle assembly. Egypt is positioning itself as an export base to Africa and Europe by targeting over 60% of local content, which is helped by free-trade access to EU markets. Morocco leverages its rail-connected Atlantic ports for battery precursor exports, while South Africa banks on automotive tooling expertise to capture drivetrain and thermal-management contracts. Israel’s software sector supplies battery analytics firmware, widening the region’s value-chain spectrum.
North Africa Electric Vehicle Market
North Africa is maturing into a dual manufacturing-and-demand hub. Morocco targets 100,000 EV units by 2025 and 2,500 public chargers by 2026, using integrated supply parks that support MEA electric vehicle battery manufacturing vehicle assembly, and export logistics. Egypt’s CKD partnerships with Chinese OEMs aim at 30,000-unit annual lines in Giza, leveraging Suez-Canal proximity for export flow. Tunisia and Algeria are drafting net-zero roadmaps that earmark fiscal credits for R&D spend, intending to piggyback on Morocco’s established export lanes.
Sub-Saharan Africa Electric Vehicle Market
Sub-Saharan Africa remains nascent but strategically important for minerals. South Africa’s seasoned auto workforce, coupled with nickel and manganese reserves, positions the country for component clusters once grid stability improves. Kenya, Ghana, and Nigeria deploy policy toolkits such as duty rebates, assembly credits, and state-backed lease schemes to stimulate adoption amid used-car dominance. Zimbabwe’s lithium and the Democratic Republic of Congo’s cobalt reserves anchor upstream leverage, but road networks and port congestion still curb cost-effective extraction logistics. Regional development banks are stepping in with concessional lines for charging and grid reinforcement.
Regulatory Landscape
Across the GCC, electric vehicles are increasingly governed by harmonized technical requirements under the Gulf Standardization Organization (GSO), with conformity assessment, safety testing, and documentation requirements forming the gatekeeper for imported M- and N-category EVs. Saudi Arabia operationalizes these requirements via the Saudi Standards, Metrology and Quality Organization (SASO) conformity and compliance certificate processes, which tie market access to formal model approval and supporting quality and technical documentation, such as battery MSDS and test reports.
In the UAE, the policy direction combines EV enablement and tighter environmental controls. The UAE National Electric Vehicles Policy (as published on the UAE government portal/legislation platform) provides a framework spanning charging infrastructure and broader enabling measures, while the implementation guideline for new vehicle emission limits sets a compliance anchor. Updated emission limits taking effect from January 1, 2026 require vehicles to meet at least Euro 6B, reinforcing the shift away from older, higher-emitting vehicle imports and supporting EV uptake in regulated urban fleets.
Value Chain Analysis
The regional EV value chain is building around a mix of import-led vehicle supply and targeted localization of manufacturing and components, with sovereign-backed industrial platforms acting as anchors for assembly and supplier clustering. Upstream leverage is linked to Africa-connected minerals, notably lithium, cobalt, nickel, and manganese. Midstream activity is strengthening around battery materials and pack assembly, including Morocco-referenced materials production initiatives from the report context, while Gulf industrial zones attract power electronics, thermal-management, and integration suppliers.
Downstream, charging-network buildout and grid-integration services increasingly shape the go-to-market stack. Public-private partnership models are expanding charger operations and maintenance as a distinct service layer. Qatar MCIT and KAHRAMAA, for instance, are rolling out the second release of the Tarsheed Smart Electric Vehicle Charging Platform, connecting more than 135 charging points, and Abu Dhabi Mobility has appointed operators for EV charging stations under PPP contracts. On the OEM side, capability localization extends beyond assembly into software and R&D, illustrated by NIO and CYVN Holdings forming NIO MENA with plans for an Abu Dhabi R&D center focused on autonomous driving and AI. Saudi Arabia is also advancing highway charging, with EVIQ inaugurating the first highway EV charging station on the Riyadh-Qassim route, tightening the link between corridors, fleet uptime, and commercial adoption.
Competitive Landscape
The electric vehicle market exhibits moderate concentration as global titans blend with sovereign-backed newcomers. BYD logged CNY 777.1 billion (USD 107.2 billion) in 2024 revenue and shipped 4.27 million units, setting the performance benchmark for Asia-to-Gulf exports. Hyundai and Saudi Arabia’s Public Investment Fund have earmarked USD 500 million for a 50,000-unit King Abdullah Economic City plant, marrying Korean drivetrain IP with local workforce incentives. Tesla maintains a showroom presence in Dubai and a concierge delivery model for Riyadh, though it has yet to localize assembly.
Regional startups inject competitive spice. Ceer targets 30,000 jobs and multiple crossover models by 2034, leveraging Foxconn’s MIH platform and Siemens’ digital-twin design suite. Turkey’s Togg is finalizing GCC homologation and eyeing Saudi distribution partners. Strategic tie-ups are proliferating: Aramco’s EUR 7.4 billion (USD 7.8 billion) stake in HORSE secures hybrid propulsion optionality, while ADNOC collaborates with NIO on battery-swap depots in Abu Dhabi industrial zones. OEMs differentiate through desert-tuned HVAC, battery-cooling trickery, and IoT-based predictive maintenance.
Competition also plays out in charging and software ecosystems. DEWA’s “EV Green Charger” network grants loyalty credits redeemable on utility bills, whereas EVIQ bundles subscription charging for Saudi fleet operators. Israeli startups offer over-the-air battery-health analytics now embedded by Chinese automakers to enhance residual-value assurances. Taken together, the market’s competitive theater spans hardware, energy integration, and digital services—broadening consumer choice while compressing incumbents’ price umbrellas.
Middle East and Africa Electric Vehicle Industry Leaders
-
Volkswagen AG
-
Nissan Motor Co. Ltd
-
Hyundai Motor Company
-
Tesla Inc.
-
BYD Co. Ltd.
- *Disclaimer: Major Players sorted in no particular order
Middle East and Africa Electric Vehicle Market Companies Covered in this Report
- Tesla Inc.
- BYD Co. Ltd.
- Hyundai Motor Co.
- Kia Corp.
- Volkswagen AG
- Nissan Motor Co. Ltd.
- BMW Group
- Toyota Motor Corp.
- Stellantis N.V.
- Mercedes-Benz Group AG
- Renault Group
- Jaguar Land Rover Ltd.
- Zhejiang Geely Holding
- Lucid Group
- Ceer Motors
- Togg A.S.
- General Motors Co.
- SAIC-MG Motor
- Ford Motor Co.
- Rivian Automotive Inc.
Read Analysis of Middle East and Africa Electric Vehicle Companies
Market Opportunities and Future Outlook
Public charging deployment programs and city-led parking retrofits are creating near-term whitespace for charge-point operators, hardware suppliers, and O&M providers, particularly where governments are underwriting rollout. Dubai Municipality and UAEV announced a Dh150 million program to install supercharging stations across 600 parking spaces, with 150 planned to be operational within two years. ADNOC Distribution also expanded the UAE charging investment narrative by opening a superfast hub on the E11 highway in January 2026 and aligning network expansion under its E2GO program target of up to 750 charging points by 2028. In Saudi Arabia, EVIQ signed an agreement with New Murabba Development Company to deploy EV charging infrastructure across assets within the New Murabba giga-project, reinforcing site design, grid connections, energy storage add-ons, and fleet-oriented subscription charging.
Manufacturing and export-oriented assembly is another opportunity lane, as new capacity announcements extend the market beyond vehicle imports into localized production ecosystems. ROX ESI Egypt, formed by Ezz Elarab Elsewedy Investments with ROX Motor, announced a manufacturing partnership for new-energy vehicles in Egypt with an initial capacity of 40,000 vehicles and an export orientation toward Gulf and African markets. This adds pull-through demand for localized components, homologation, and logistics through North Africa. Saudi Arabia continues to use industrial policy and sovereign-backed joint ventures, including Hyundai Motor Manufacturing Middle East with PIF targeting 50,000 annual production capacity, to deepen regional supplier participation, supporting demand for battery thermal-management solutions tailored to extreme heat, fleet telematics, and depot charging systems for oil-and-gas and logistics operators.
Recent Industry Developments in Middle East and Africa Electric Vehicle Market
- June 2026: ROX ESI Egypt (Ezz Elarab Elsewedy Investments and ROX Motor) announced a USD 500 million joint venture to manufacture range-extended electric vehicles at a 100,000 square meter facility in the Sixth of October industrial district in Egypt. The project formalizes a local manufacturing node with an export angle toward Gulf and African markets, supporting a broader shift from import dependence to regional assembly and supplier localization.
- January 2026: ADNOC Distribution launched what it described as the largest superfast EV charging hub in the Middle East, Africa, and Turkiye on the E11 highway in Abu Dhabi. The site adds visible high-power charging capacity on a key transport corridor and strengthens the case for centralized network operators driving adoption through reliability and route coverage.
- October 2024: NIO and CYVN Holdings formed NIO MENA, including plans for an R&D center in Abu Dhabi focused on autonomous driving and artificial intelligence. The initiative embeds software and advanced engineering capabilities in-region, complementing vehicle sales with local development and integration work that supports longer-term EV ecosystem maturity.
Middle East and Africa Electric Vehicle Market Report Scope and Research Methodology
Market Definition and Coverage
This market covers the value of electric vehicles sold and used across the Middle East and Africa, including battery electric, plug in hybrid, and fuel cell models across major on road vehicle classes, tracked in USD for the study period.
Scope exclusions: Off road electric equipment and charging infrastructure revenues are not counted in the market value unless they are explicitly bundled into the vehicle transaction.
Segments Covered in This Report
- By Drive Type
- Battery-Electric (BEV)
- Plug-in Hybrid (PHEV)
- Fuel-Cell Electric (FCEV)
- By Vehicle Type
- Passenger Cars
- Light Commercial Vehicles
- Medium and Heavy Commercial Vehicles
- Buses and Coaches
- Two and Three Wheelers
- By Battery Chemistry
- Lithium-ion (NMC / NCA / LFP)
- Nickel-Metal Hydride
- Others
- By Charging Level
- AC below 7 kW (Slow)
- AC above 7 kW - 22 kW (Semi-fast)
- DC above 22 kW (Fast / Ultra-fast)
- By Country
- Saudi Arabia
- United Arab Emirates
- Israel
- Egypt
- South Africa
- Nigeria
- Kenya
- Qatar
- Oman
- Rest of Middle East and Africa
Data Sources, Market Sizing, and Validation
Desk Research
Desk work starts with building a clear country map for the region and then lining up consistent time series for vehicle sales, parc, and pricing signals. We rely on public sources such as national transport and road authority publications, energy and electricity regulators, customs and trade statistics portals, and multilateral datasets from groups like the IEA and the World Bank. These help us understand how fast EV registrations are moving, where charging access is improving, and how policy changes are shifting demand.
On top of that, we review company annual reports, investor decks, and press releases for product launches, local assembly plans, and order announcements, which are then screened for one time effects. A paid subscription used for company financials and news helps cross check revenue exposure and timeline claims, and we also use patent databases to sanity check activity in batteries and power electronics. The sources listed here are illustrative only, and many other public documents were also used to collect, validate, and clarify data points.
Primary Interviews and Surveys
Primary interviews were run with automakers and importers, fleet and mobility operators, dealers, charging network teams, and policy-linked stakeholders, so gaps left by public data could be closed. For a region like MEA, we spread coverage across the Gulf, North Africa, and Sub Saharan markets to confirm differences in vehicle mix, incentive structures, and on road price behavior, and then we recontact sources when assumptions change.
Distribution of primary research fieldwork respondents
| Company type | Respondent position |
|---|---|
| Top tier: 32% | CXOs: 14% |
| Mid tier: 51% | Functional/Unit leaders: 41% |
| Smaller Players: 17% | Managers: 45% |
Market-Sizing & Forecasting
The sizing model is built top down by reconstructing an addressable demand pool from country EV registrations and sales direction, and then translating volumes into value using observed price bands and powertrain mix. To keep the numbers practical, we used a limited set of inputs that can be repeated each year, such as passenger versus commercial mix, BEV versus PHEV versus FCEV share, battery pack cost trend, import duties and incentive levels, and public charging rollout pace.
The outputs are then checked using selective bottom up approximations, such as sampling average selling prices by vehicle class and validating volumes through dealer and fleet channel checks in key countries. Where country data is thin, gaps are handled by proxying from similar markets in the region, followed by adjustment using local interviews and policy timelines. Forecasting is mainly scenario analysis supported by short series trend checks, because policy shifts and new model availability can change adoption quickly, and we align scenario assumptions with what regional experts expect for subsidy durability and charging corridor buildouts.
Data Validation & Update Cycle
Validation happens in steps, starting with reconciling the model against independent signals like new vehicle import patterns, registration momentum, and public charger counts where available. We check for unusual jumps by country and vehicle class, and then rework assumptions when price, policy, or mix changes explain the variance better than pure growth. Before sign off, the analysis goes through an internal review so that definitions, currency conversion timing, and growth logic are consistent across the dataset.
The report is refreshed annually, and interim updates are triggered when material events happen, such as major incentive revisions, new local assembly programs, or step changes in vehicle availability. Right before delivery, an analyst runs a final pass to capture the latest public releases and interview feedback so clients receive an updated view.
Mordor Intelligence's Middle East and Africa Automotive Electric Vehicle Market Size Versus Other Published Estimates
It is normal to see different market size figures for MEA EVs, even when the topic name looks the same, because publishers choose different vehicle sets, different country lists, and different ways to convert volumes into USD value. Timing also matters, since some studies anchor on a base year that is already outdated, and others assume faster or slower price declines than what the market is actually showing.
Some estimates narrow the definition to only passenger EVs or only MENA, and they often mix in charging infrastructure value or use aggressive sales ramp assumptions without showing the registration checks behind them. The spread is also driven by how BEV versus PHEV versus FCEV shares are handled by country, how import duties and incentives are netted into the transaction value, and whether currencies are converted using an annual average or a single point in time.
Benchmark comparison
| Source | Market Size | Gaps in Research Methodology |
|---|---|---|
| Mordor Intelligence | USD 3.83 B (2025) | |
| Regional Consultancy A | USD 7.80 B (2024) | Uses a different geography cut and publishes MENA focused totals anchored on 2024, which can inflate comparability when high adoption Gulf markets are weighted more heavily and pricing is not normalized across Africa. |
| Industry Publisher B | USD 3.30 B (2023) | Typically emphasizes BEV and PHEV demand and blends in infrastructure readiness discussion, and the earlier base year can miss the recent model launch cycle and incentive changes seen in several MEA countries. |
The table shows that the biggest differences come from country coverage and what gets counted as part of the vehicle market value, and then the timing of the base year adds another layer. Some sources focus on MENA only or treat passenger EVs as the full market, and then the total moves higher or lower depending on the mix and pricing assumption. In Mordor Intelligence, the MEA total is kept to on road EVs across passenger and commercial classes, and it is reconciled to country level adoption signals before it is rolled up to a regional USD figure.
Key Questions Answered in the Report
What is the projected value of the Middle East and Africa electric vehicle market in 2031?
The market is forecast to reach USD 20.39 billion by 2031, expanding at a 32.15% CAGR.
Which country currently leads regional EV adoption?
The UAE commanded a 32.20% revenue share in 2025 thanks to dense charging infrastructure and import-duty relief.
Which vehicle category is expected to grow fastest by 2031?
Medium and heavy commercial vehicles are set to grow at a 35.05% CAGR as fleet operators electrify trucks and buses.
How significant is lithium-ion technology in regional battery supply?
Lithium-ion batteries accounted for 90.55% of 2025 sales and remain the dominant chemistry despite emerging alternatives.
Which policy lever most accelerates consumer uptake in GCC markets?
Subsidies and near-zero customs duties sharply reduce upfront prices, tipping total cost of ownership in favor of EVs.