Microwave Devices Market Size and Share
Market Overview
| Study Period | 2020 - 2031 |
|---|---|
| Market Size (2026) | USD 7.27 Billion |
| Market Size (2031) | USD 9.22 Billion |
| Growth Rate (2026 - 2031) | 4.87% CAGR |
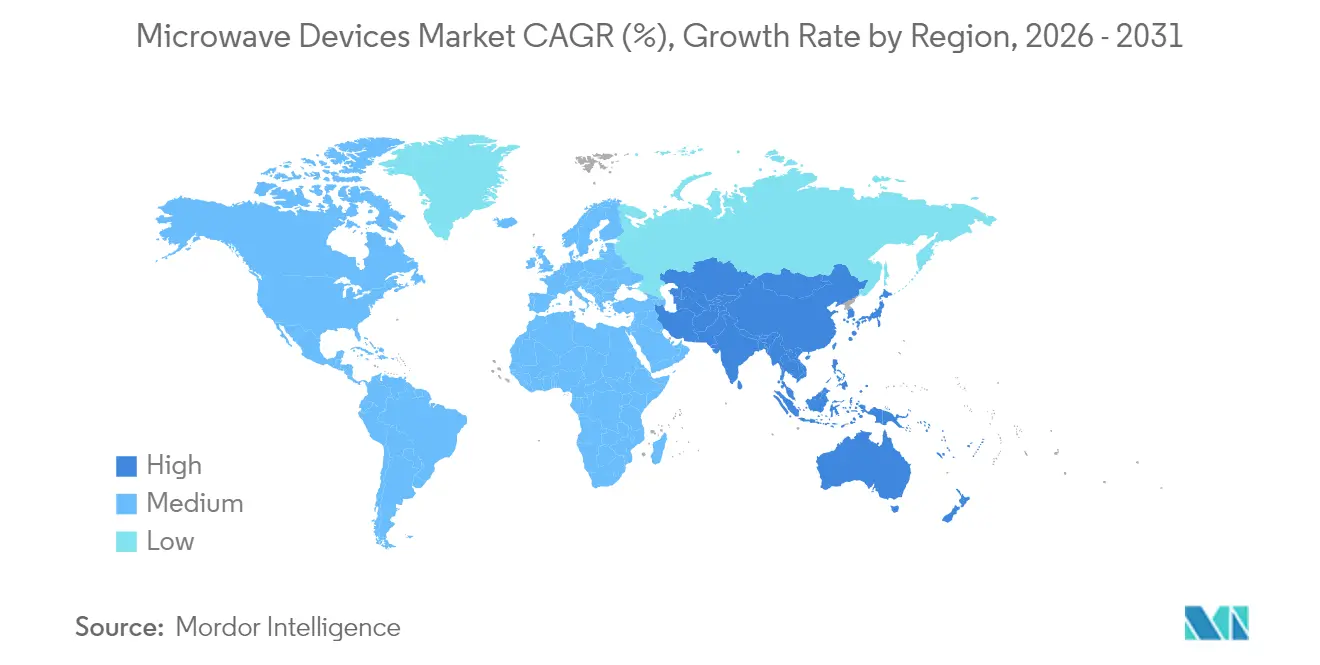
| Fastest Growing Market | Asia Pacific |
| Largest Market | North America |
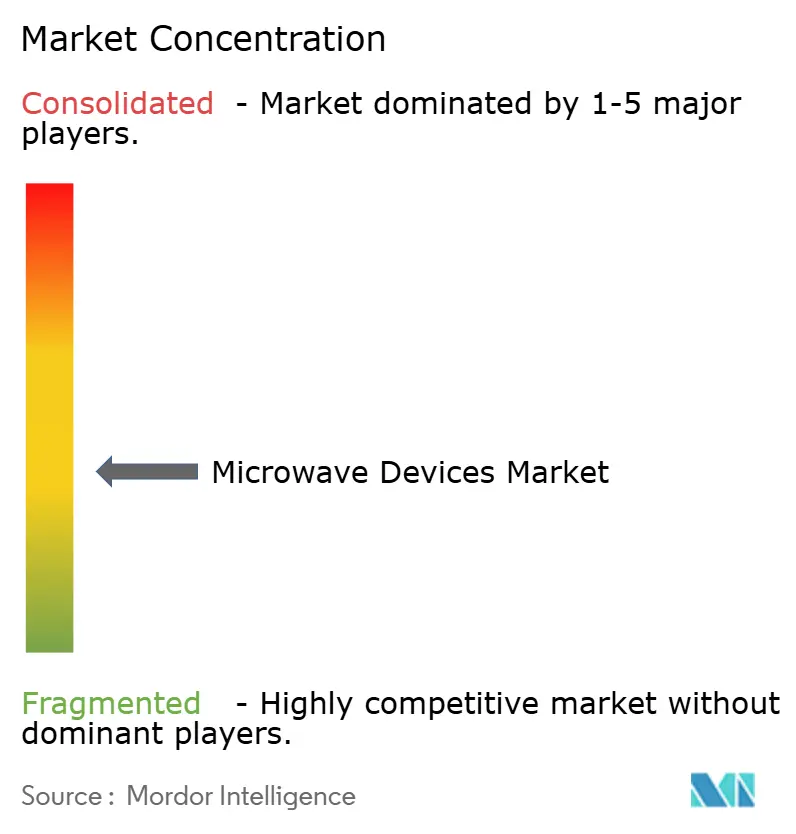
| Market Concentration | Medium |
Major Players *Disclaimer: Major Players sorted in no particular order Image © Mordor Intelligence. Reuse requires attribution under CC BY 4.0. | |
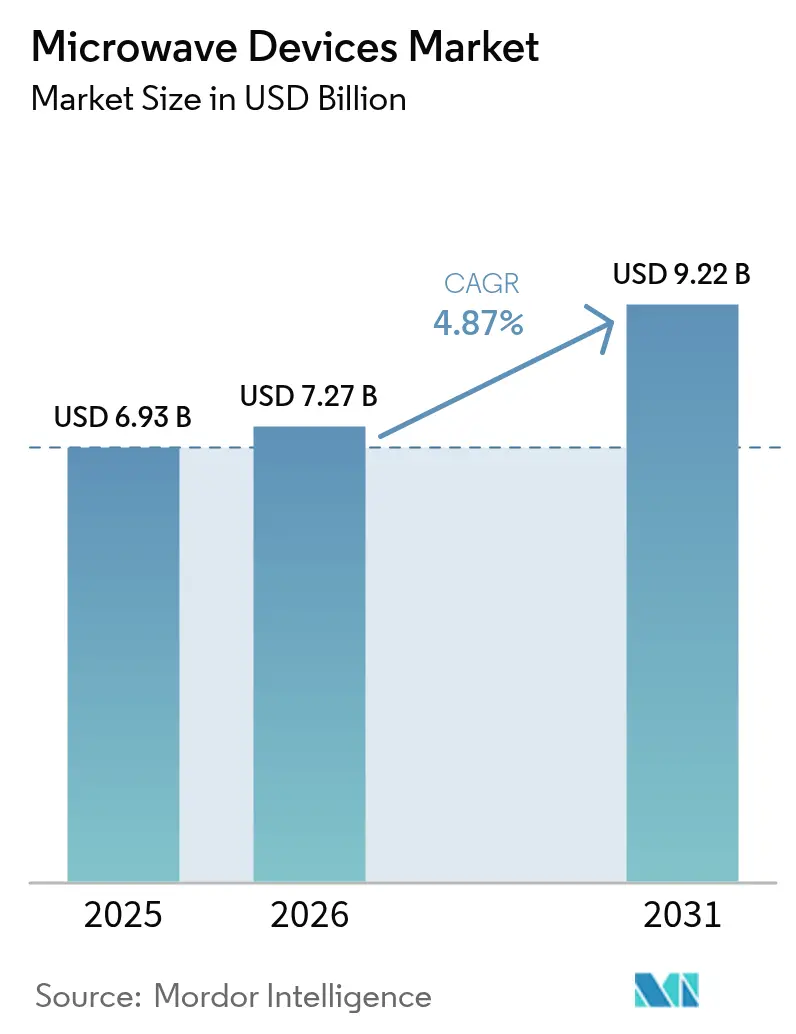
Microwave Devices Market Analysis by Mordor Intelligence
Microwave devices market size in 2026 is estimated at USD 7.27 billion, growing from 2025 value of USD 6.93 billion with 2031 projections showing USD 9.22 billion, growing at 4.87% CAGR over 2026-2031. Gains track a mature yet durable demand profile spanning defense, satellite communications, 5G back-haul, and emerging medical therapies. Gallium nitride (GaN) power devices continue to displace legacy gallium arsenide solutions, improving power density and efficiency while trimming system footprint and cooling loads.[1]Infineon Technologies AG, “Infineon showcases first 300 mm GaN power wafer technology,” infineon.com. Ongoing defense modernization programs, highlighted by directed-energy weapon prototypes now on contract with the U.S. Department of Defense, underpin a robust baseline of high-power orders.[2]Raytheon, “Raytheon receives DEFEND program HPM prototype contract,” rtx.com. Parallel roll-outs of 5G fixed-wireless access in the E- and V-bands sustain commercial momentum even as mass-tier handset volumes soften. Medical microwave ablation platforms round out a diversified demand stack, offering hospitals faster procedures and deeper lesion penetration than radiofrequency alternatives.
Key Report Takeaways
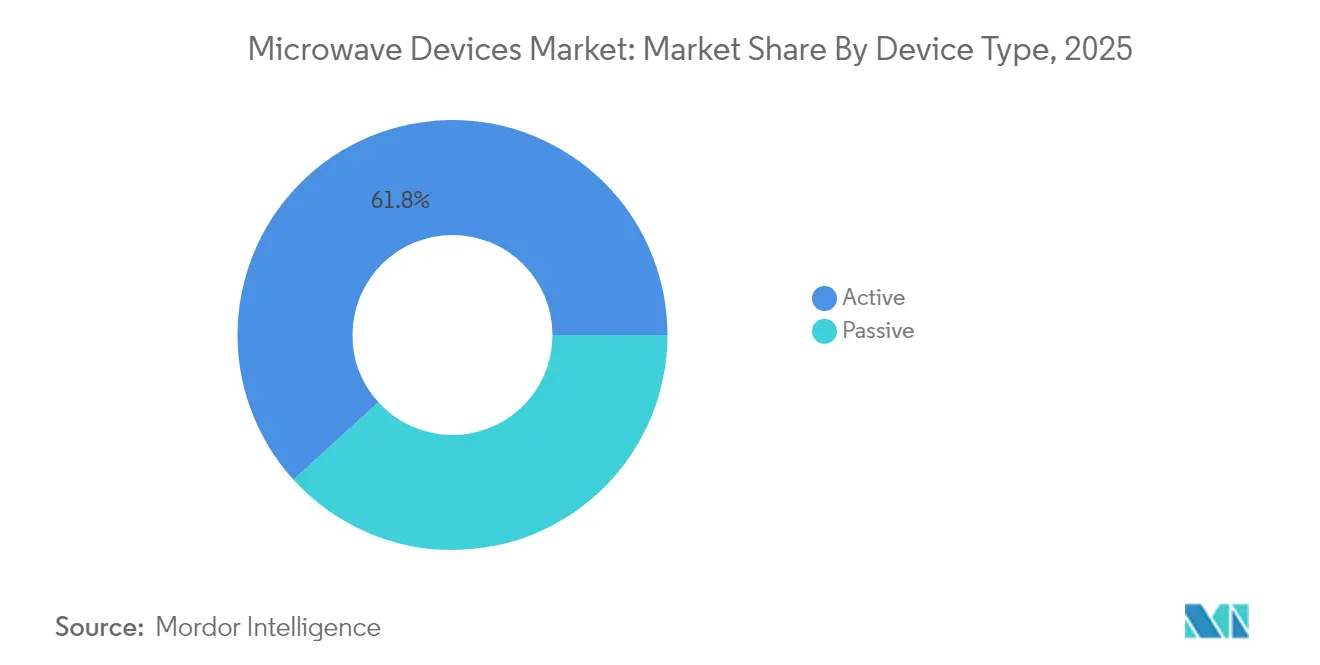
- By device type, active devices held 61.75% of the microwave devices market share in 2025, while the segment advances at a 7.42% CAGR through 2031.
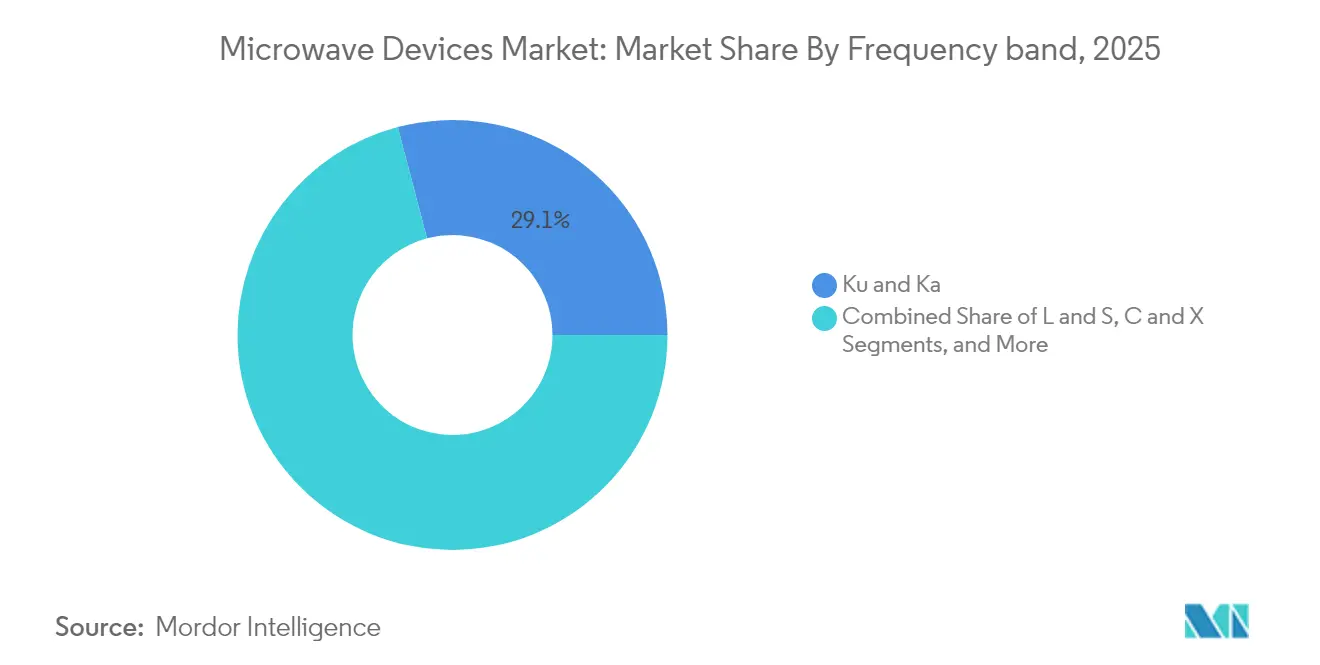
- By frequency band, V- and E-band components post the fastest growth at 5.55% CAGR to 2031.
- By application, space and communication accounted for 47.10% of the microwave devices market size in 2025; medical applications register the highest 5.92% CAGR through 2031.
- By geography, North America led with 37.60% revenue share in 2025, whereas Asia Pacific records the quickest 7.01% CAGR through 2031.
Note: Market size and forecast figures in this report are generated using Mordor Intelligence’s proprietary estimation framework, updated with the latest available data and insights as of 2026.
Global Microwave Devices Market Trends and Insights
Drivers Impact Analysis*
| Driver | (~) % Impact on CAGR Forecast | Geographic Relevance | Impact Timeline |
|---|---|---|---|
| Surge in secure military SATCOM demand | +1.2% | North America and Europe | Medium term (2-4 years) |
| 5G and FWA backhaul deployment in E- and V-bands | +0.8% | Asia Pacific and North America | Short term (≤ 2 years) |
| Medical microwave ablation adoption | +0.6% | North America and Europe | Long term (≥ 4 years) |
| GaN-based solid-state PA cost declines | +0.9% | Global | Medium term (2-4 years) |
| Regulatory incentives for rural broadband | +0.4% | North America and selective Asia Pacific markets | Short term (≤ 2 years) |
| Demand for high-power directed-energy systems | +0.7% | North America and Europe | Medium term (2-4 years) |
| Source: Mordor Intelligence | |||
Surge in Secure Military SATCOM Demand
Modern armed-forces networks require jam-resilient links and multi-band versatility. Recent U.S. Army fielding of modular VSAT terminals, backed by a USD 60 million contract with L3Harris, illustrates the shift toward compact systems that merge high data rates with quick deployment.[3]L3Harris Technologies, “U.S. Army selects Hawkeye III Lite VSAT,” l3harris.com. GaN amplifiers enable the power levels and bandwidth now specified, speeding the retirement of vacuum tubes. Parallel Chinese investment in gigawatt-class high-power microwave (HPM) weapons fuels a technology race that keeps defense procurement pipelines active.
5G and FWA Backhaul Deployment in E- and V-Bands
Fixed-wireless backhaul offers gigabit-class throughput where fiber costs remain prohibitive. The FCC’s USD 9 billion 5G Fund for Rural America anchors near-term demand for E- and V-band links. Satellites add another pull: a USD 19.7 million order from SpaceX for E-band solid-state power amplifiers affirms commercial scale for high-frequency microwave payloads.
Medical Microwave Ablation Adoption
Hospitals turn to microwave ablation for larger, deeper tumors that exceed radiofrequency reach. Platforms such as IntelliBlate deliver predictable ablation zones, aided by solid-state power control and low phase-noise operation. Regulatory clearances expanding into arrhythmia and pain applications open long-term growth vectors.
GaN-Based Solid-State PA Cost Declines
Infineon’s 300 mm GaN wafer process yields over twice the die count of 200 mm lines, moving GaN toward silicon parity by 2025, according to Infineon Technologies AG. Higher yield and smaller heat sinks lower end-system cost, widening adoption across telecom, automotive, and consumer segments.
Restraints Impact Analysis*
| Restraint | (~) % Impact on CAGR Forecast | Geographic Relevance | Impact Timeline |
|---|---|---|---|
| High R&D cost of wide-bandgap devices | -0.6% | Advanced manufacturing hubs | Long term (≥ 4 years) |
| Export controls on critical RF components | -0.4% | US-China trade corridors | Short term (≤ 2 years) |
| Thermal management limits above 100 GHz | -0.3% | Global | Medium term (2-4 years) |
| Competition from photonic links in X-haul | -0.2% | Fiber-rich markets | Long term (≥ 4 years) |
| Source: Mordor Intelligence | |||
High R&D Cost of Wide-Bandgap Devices
Epitaxial reactors for GaN and SiC run into the tens of millions of dollars, creating high entry barriers. Leading suppliers devote 15-20% of turnover to process optimization, a hurdle few new entrants can clear.
Export Controls on Critical RF Components
The U.S. Bureau of Industry and Security expanded its Entity List in December 2024, tightening licenses for advanced semiconductor tools. China’s countermove restricting gallium exports raises raw-material prices, magnifying supply-chain risk for GaN production.[4]U.S. Geological Survey, “Mineral Commodity Summary: Gallium 2025,” usgs.gov.
*Our forecasts treat driver/restraint impacts as directional, not additive. The impact forecasts reflect baseline growth, mix effects, and variable interactions.
Segment Analysis
By Device Type: Active Devices Dominate Through Innovation
Active devices accounted for 61.75% of the microwave devices market in 2025 and advanced at a 7.42% CAGR to 2031. Size, weight, and reliability advantages are accelerating the swap from vacuum electron devices to GaN solid-state power amplifiers. The Microwave devices market size for active devices is on track to reach USD 6.56 billion by 2031. Integration trends fold beam-forming and gain-control logic into the amplifier die, enabling software-defined radio platforms. Vacuum tube products still serve ultra-high-power radar, but cede volume share as defense programs standardize on solid-state modules.
Second-level effects cascade into the passive segment, where discrete filters and couplers face pricing pressure as functions move on-chip. Medical ablation platforms prefer active solutions for millisecond-scale power modulation, reinforcing the segment’s long-term growth trajectory. Product pipelines show rising demand for 24 V and 28 V GaN devices that align with emerging 5G macro radio architectures.


By Frequency Band: mmWave Segments Lead Growth
Ku-band held 29.10% of 2025 revenues, yet V- and E-band shipments show the strongest 5.55% CAGR through 2031. The microwave devices market size for V- and E-band components is projected to exceed USD 2.23 billion by the end of the forecast period. Space constellations exploit the bands’ narrow beam-widths, while 5G operators adopt them for dense urban backhaul. Thermal loads rise sharply above 50 GHz, directing investment toward advanced ceramic packages and diamond heat spreaders.
L-, S-, C- and X-bands keep a stable baseline for long-range radar and navigational aids. Research road-maps from leading OEMs show prototypes at 120–140 GHz for early 6G trials, foreshadowing a fresh wave of device innovation. Wide-bandgap technology plus conformal cooling techniques will be essential as junction temperature limits tighten.
By Application: Space Communications Drive Premium Demand
Space and communication platforms captured 47.10% of 2025 revenues, reflecting premium pricing for radiation-hardened, zero-defect parts. The microwave devices market share of this segment remains dominant through 2031 as mega-constellation roll-outs multiply payload counts. Satellite builders favor GaN MMIC lineups that pack high power into small footprints and reduce launch mass.
The medical segment posts the swiftest 5.92% CAGR as healthcare systems adopt minimally invasive ablation for oncology, cardiology, and pain therapy. Industrial microwave heating gains momentum in waste treatment and material processing, while automotive advanced driver-assistance projects move GaN amplifiers into high-volume vehicle platforms.
Geography Analysis
North America retained a 37.60% stake in 2025, anchored by USD 9 billion in federal 5G subsidies and strong U.S. defense budgets. The microwave devices market continues to benefit from directed-energy weapon programs and rural broadband build-outs. Export-license compliance introduces cost friction, but established primes sustain local sourcing strategies that cushion supply disruptions.
Asia Pacific delivers the highest 7.01% CAGR to 2031. China controls 98% of mined gallium, giving domestic fabs cost leverage while exposing foreign integrators to price volatility. Regional governments fund 300 mm power-semiconductor fabs, and India’s newly opened design houses add talent depth for RF front-end innovation. South Korea and Japan supply advanced test and packaging capacity, reinforcing a self-contained value chain.
Europe balances sovereign defense needs with commercial telecom expansion. EU policy incentives aim to localize GaN epitaxy and packaging capacity. Cross-Atlantic partnerships send European RF designs to North American fabs for pilot runs, then bring volume back to domestic lines, mitigating geopolitical risk. Sustainability directives further nudge network operators toward energy-efficient GaN platforms in new 5G and future 6G nodes.

Competitive Landscape
The microwave devices market features moderate fragmentation. Qorvo, Analog Devices, MACOM, and Infineon maintain edge positions via vertical integration. MACOM’s 2024 purchase of ENGIN-IC extended European GaN MMIC know-how, while its earlier OMMIC transaction secured a wafer source in France. Infineon’s 300 mm GaN milestone lowers unit cost and safeguards supply against gallium export shocks.
Merger strategies concentrate on packaging, beam-forming IP, and cryogenic amplifiers for quantum computing. Smaller innovators partner with foundries such as GlobalFoundries to tap advanced nodes without owning fabrication assets. Open-RAN adoption introduces new entrants that couple software control with multi-band hardware, pressuring incumbents to accelerate configurable PA road-maps.
Supply-chain resilience shapes investment patterns. Firms diversify assembly to Southeast Asia and Eastern Europe in response to U.S.–China trade friction. Patent filings reveal intensified focus on thermal interface materials and phased-array calibration algorithms. Competitive intensity stays high, yet top-five vendors still command over 45% of global revenue, underscoring a market that rewards R&D scale.
Microwave Devices Industry Leaders
L3 Technologies
Thales Group
Richardson Electronics, Ltd
Teledyne Technologies
Toshiba Corporation
- *Disclaimer: Major Players sorted in no particular order

Recent Industry Developments
- February 2025: MaxLinear and RFHIC unveiled a GaN power amplifier achieving 55.2% efficiency for 5G macro radios.
- January 2025: onsemi completed the USD 115 million purchase of Qorvo’s SiC JFET portfolio, broadening its EliteSiC offerings.
- December 2025: AMD announced Versal RF SoCs with integrated 32 GSPS ADCs aimed at aerospace and defense payloads.
- December 2024: Microamp and Radisys partnered on Open-RAN mmWave radios achieving 67 dBm EIRP.
- November 2024: MACOM bought ENGIN-IC, adding GaN MMIC design talent for defense assemblies.


Research Methodology Framework and Report Scope
Market Definitions and Key Coverage
Our study treats the microwave devices market as the combined revenues generated by active and passive hardware that generate, amplify, filter, or route electromagnetic waves between 1 GHz and 110 GHz across space and communication, defense, medical, and industrial heating systems.
Scope exclusion: consumer microwave ovens and sub-3 GHz low-power RF discretes lie outside this assessment.
Segmentation Overview
- By Device Type
- Active (Solid-state, Vacuum Electron)
- Passive (Filters, Couplers, etc.)
- By Frequency Band
- L and S
- C and X
- Ku and Ka
- V and E (mmWave)
- By Application
- Space and Communication
- Defense (Radar, EW, DEW)
- Medical (Ablation, Imaging)
- Commercial and Industrial Heating
- By Geography
- North America
- United States
- Canada
- Mexico
- South America
- Brazil
- Argentina
- Rest of South America
- Europe
- United Kingdom
- France
- Germany
- Italy
- Rest of Europe
- Asia Pacific
- China
- Japan
- India
- South Korea
- Rest of Asia Pacific
- Middle East and Africa
- United Arab Emirates
- Saudi Arabia
- South Africa
- Rest of Middle East and Africa
- North America
Detailed Research Methodology and Data Validation
Primary Research
Interviews and short surveys with device OEM engineers, satellite operators, defense procurement officers, and hospital biomedical heads across North America, Europe, and Asia helped confirm real-world ASP shifts, procurement cycles, and frequency-band penetration. Feedback also tested early model outputs and refined forecast drivers flagged during desk work.
Desk Research
We began with publicly available datasets from bodies such as the International Telecommunication Union, NASA launch records, SIPRI defense expenditure tables, and customs shipment logs. We then enriched them with patent analytics from Questel and company filings collated through D&B Hoovers. Trade-association white papers (for example, IEEE MTT-S) and peer-reviewed journals supplied adoption benchmarks for emerging V and E band gear. These inputs offered baseline volumes, average selling prices, and frequency mix clues. The sources listed illustrate our wider evidence pool; many additional publications supported data validation and gap filling.
Market-Sizing and Forecasting
The core model starts with a top-down reconstruction of global demand using satellite launches, telecom mmWave base-station counts, defense radar inventories, and industrial microwave heater shipments, which are then multiplied by band-specific device content factors. Supplier roll-ups and sampled ASP multiplied by volume checks act as bottom-up guardrails. Variables such as GaN wafer cost trends, defense electronics budgets, export volumes of waveguide assemblies, and regulatory spectrum releases feed a multivariate regression forecast that projects values through 2030. Any opaque sub-segment is cross-checked against primary feedback before being accepted or adjusted.
Data Validation and Update Cycle
Each draft undergoes anomaly scans, currency reconciliation, and senior analyst review. We refresh the model annually and trigger interim updates when satellite launch manifests, major defense awards, or disruptive component price swings materially shift assumptions. Clients therefore receive numbers vetted at least twice before publication.
Why Our Microwave Devices Baseline Commands Reliability
Published values often diverge because studies pick different device lists, starting years, or currency conversions. By tying scope to the full 1-110 GHz hardware stack and refreshing inputs every twelve months, Mordor Intelligence offers a balanced midpoint that decision-makers can reference with confidence.
Benchmark comparison
| Market Size | Anonymized source | Primary gap driver |
|---|---|---|
| USD 6.93 B (2025) | Mordor Intelligence | - |
| USD 6.70 B (2021) | Global Consultancy A | Earlier base year and narrower active device taxonomy |
| USD 8.55 B (2025) | Industry Association B | Relies mainly on revenue surveys from large primes and omits passive waveguide clusters |
Differences stem chiefly from scope limits and update cadence. By blending transparent device definitions with frequent primary validation, we deliver a dependable baseline that sits between optimistic revenue tallies and conservative unit-only counts.


Key Questions Answered in the Report
What is the current size of the microwave devices market?
The market is valued at USD 7.27 billion in 2026 and is forecast to reach USD 9.22 billion by 2031 on a 4.87% CAGR.
Which segment holds the largest microwave devices market share?
Active devices command 61.75% of 2025 revenue owing to widespread GaN amplifier adoption.
Which application area is growing the fastest?
Medical microwave ablation platforms post the highest 5.92% CAGR through 2031 as minimally invasive oncology and cardiology procedures scale.
Why is GaN technology critical to future growth?
GaN offers higher power density and efficiency, with 300 mm wafer processes bringing cost parity to silicon by 2025, opening mass-market opportunities.
Which region is expanding the quickest?
Asia Pacific registers a 7.01% CAGR through 2031, driven by large-scale 5G deployments and growing semiconductor manufacturing capacity.
How are export controls affecting the microwave devices industry?
U.S.–China trade restrictions on semiconductor tools and China’s gallium export curbs raise material costs and drive supply-chain diversification efforts.
Page last updated on:


