
Wi-Fi Market Size and Share
Market Overview
| Study Period | 2020 - 2031 |
|---|---|
| Market Size (2026) | USD 21.06 Billion |
| Market Size (2031) | USD 40.44 Billion |
| Growth Rate (2026 - 2031) | 13.94 % |
| Fastest Growing Market | Asia Pacific |
| Largest Market | North America |
| Market Concentration | Medium |
Major Players *Disclaimer: Major Players sorted in no particular order Image © Mordor Intelligence. Reuse requires attribution under CC BY 4.0. | |
Wi-Fi Market Analysis by Mordor Intelligence
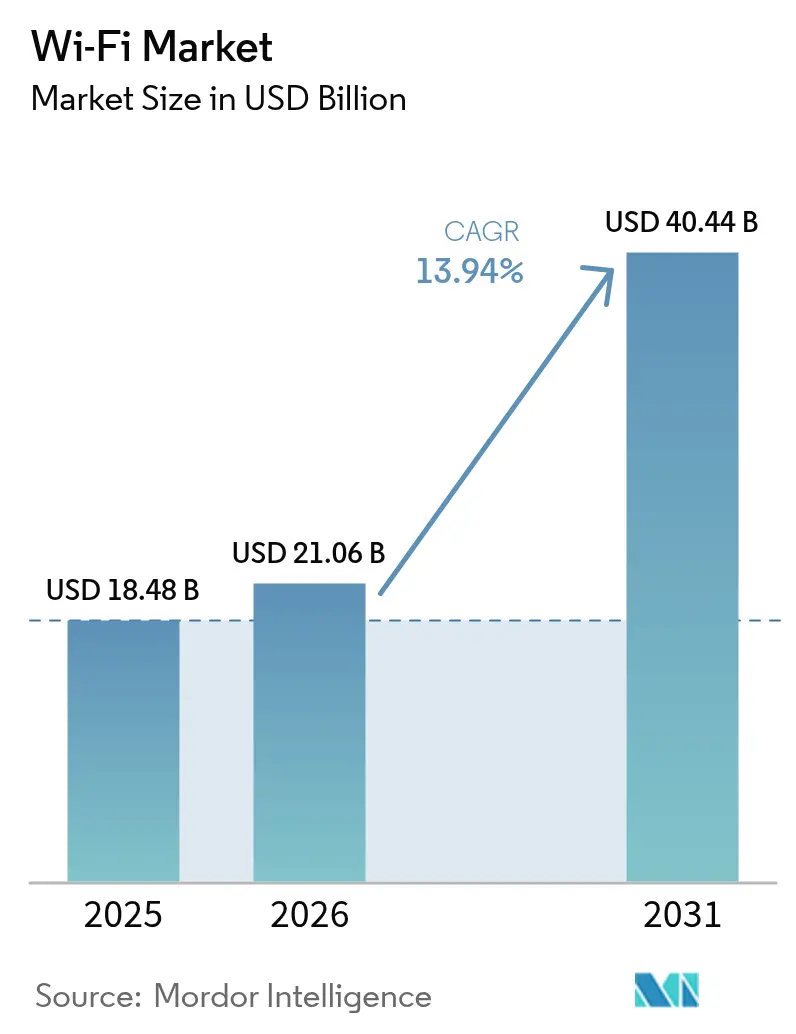
The Wi-Fi Market size was valued at USD 18.48 billion in 2025 and estimated to grow from USD 21.06 billion in 2026 to reach USD 40.44 billion by 2031, at a CAGR of 13.94% during the forecast period (2026-2031). Growing enterprise preference for wireless-first architecture, the commercial debut of Wi-Fi 7, and the adoption of OpenRoaming standards are the primary forces propelling this acceleration [1]Kevin Robinson, “Wi-Fi 7 Momentum in 2025,” Wi-Fi Alliance, wifi.org. Enterprises view high-capacity WLAN as pivotal for hybrid work enablement, edge-hosted artificial intelligence, and real-time industrial automation, prompting refresh cycles that shorten from eight years to five. Rapid mesh penetration in residential and small-office environments further broadens the addressable base, while federal broadband programs in North America stimulate public-sector opportunities. Spectrum allocations in the 6 GHz band supply temporary congestion relief, yet also spark demand for tri-band access points that can assure deterministic latency for robotics, telemedicine, and immersive reality services. The competitive landscape remains open because interoperability requirements prevent lock-in, allowing new service-centric entrants to challenge incumbent hardware vendors.
Key Report Takeaways
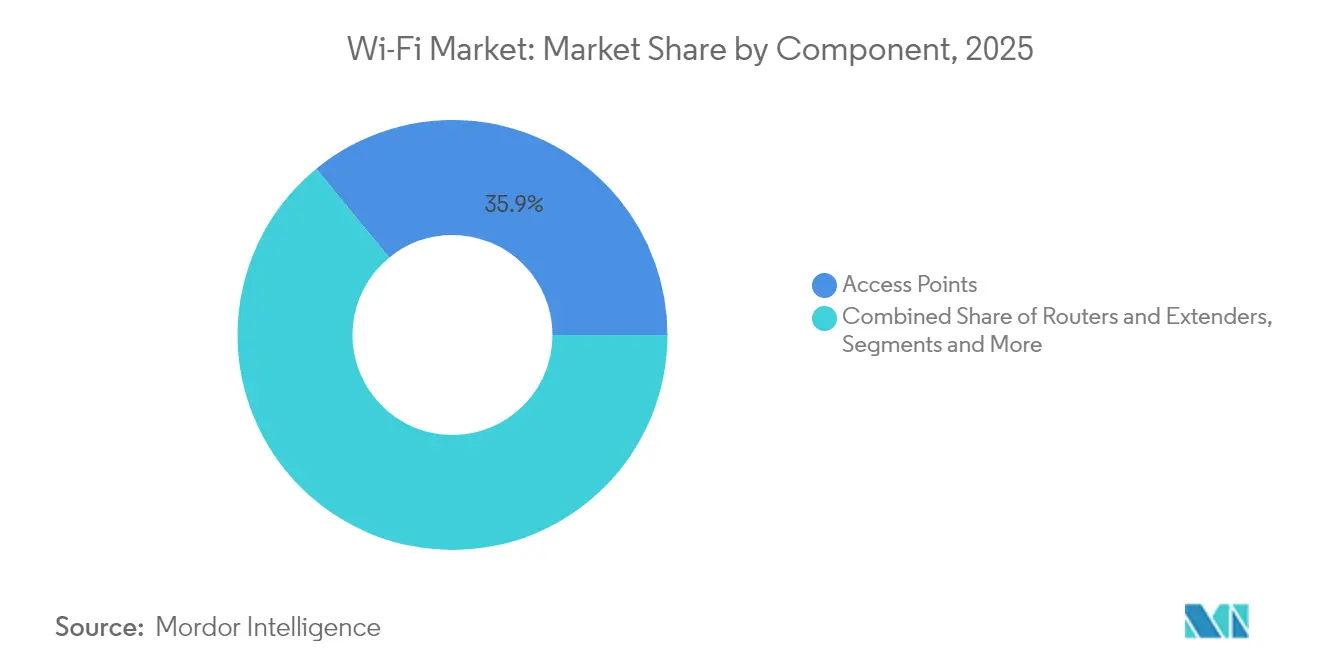
- By component, access points held 35.92% of the Wi-Fi market share in 2025, while the services segment is projected to advance at a 15.98% CAGR through 2031.
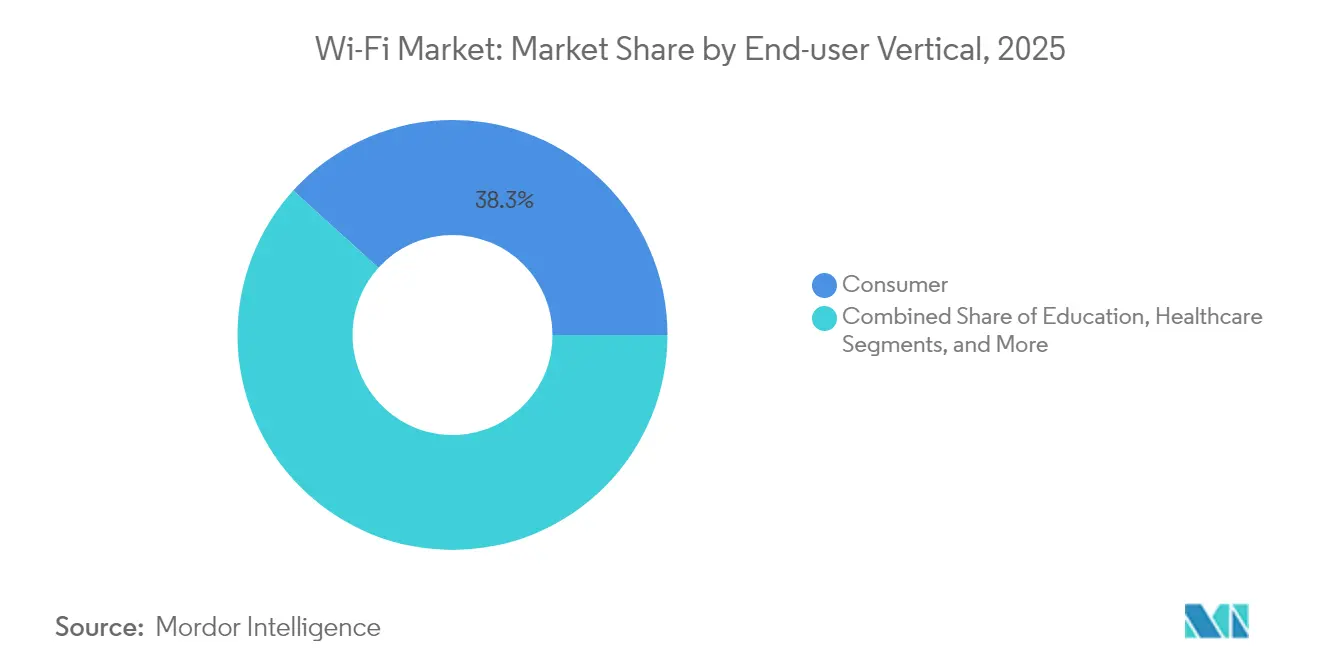
- By end-user vertical, consumer applications led with 38.28% revenue share in 2025; industrial and logistics is forecast to expand at a 17.18% CAGR to 2031.
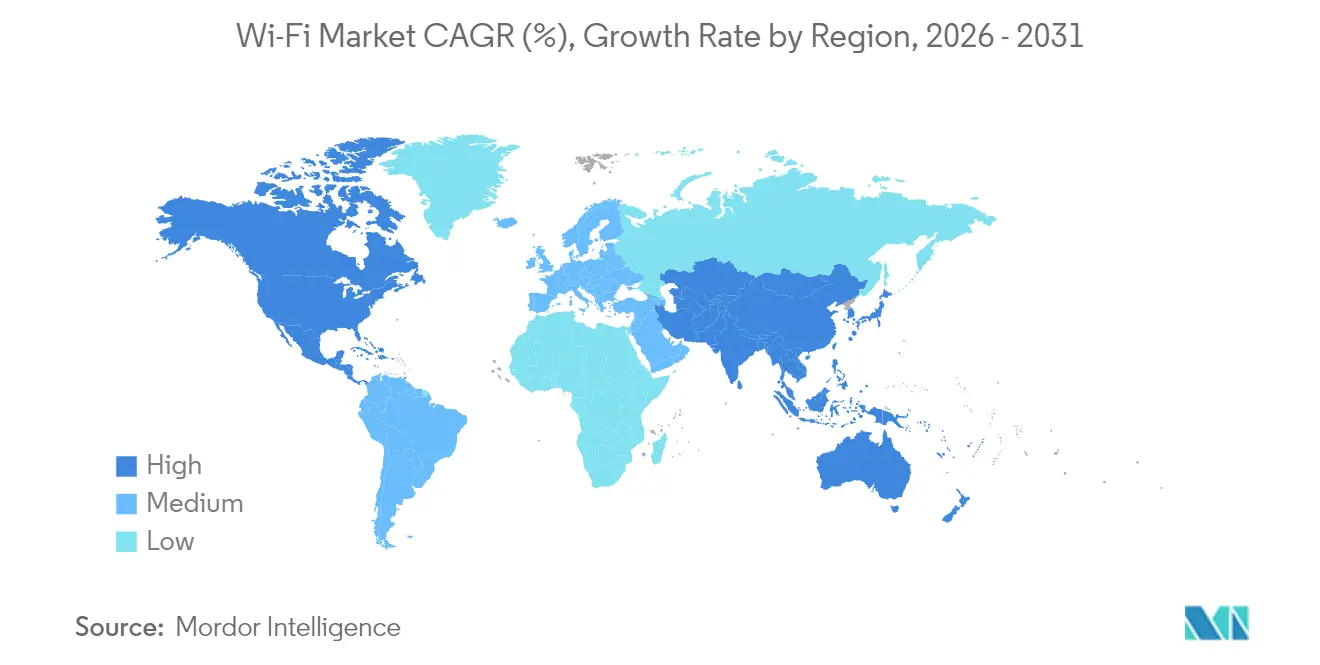
- By geography, North America commanded a 40.55% share of the Wi-Fi market in 2025, whereas the Asia Pacific is advancing at a 15.12% CAGR through 2031.
Note: Market size and forecast figures in this report are generated using Mordor Intelligence’s proprietary estimation framework, updated with the latest available data and insights as of 2026.
Market Trends and Insights
Drivers Impact Analysis of Wi-Fi Market*
| Driver | (~) % Impact on CAGR Forecast | Geographic Relevance | Impact Timeline |
|---|---|---|---|
| Proliferation of IoT and smart devices | +2.8% | Global; strongest in Asia Pacific | Medium term (2-4 years) |
| Smart-city initiatives and public WiFi roll-outs | +2.1% | North America, EU; spreading to APAC | Long term (≥ 4 years) |
| Rapid adoption of WiFi 6/6E and upcoming WiFi 7 | +3.2% | Global; enterprise-led in developed markets | Short term (≤ 2 years) |
| Hybrid/remote work models demanding high-capacity WLAN | +2.5% | North America and EU; spillover to APAC | Medium term (2-4 years) |
| Convergence of WiFi and 5G via OpenRoaming/Passpoint | +1.9% | Global; carrier partnerships pivotal | Long term (≥ 4 years) |
| Energy-efficient TWT features for battery-powered IoT nodes | +1.5% | Global; industrial and smart building | Medium term (2-4 years) |
| Source: Mordor Intelligence | |||
Proliferation of IoT and smart devices
Enterprises deploy dense sensor networks that often exceed 100 connected endpoints per access point, a profile economically serviced only by Wi-Fi 6E’s OFDMA scheduling and multi-user MIMO capabilities. Smart-building operators integrate HVAC, lighting, and surveillance over Wi-Fi mesh to cut structured-cabling costs by 40% and enable predictive maintenance analytics. Demand for sub-10 ms response in edge inference workflows makes Wi-Fi 7’s multi-link operation attractive because it sustains jitter-free traffic under load. Industrial automation pilots report 99.9% uptime on dedicated 6 GHz channels versus 97.8% on congested 5 GHz links, validating the migration to new spectrum for mission-critical robotics. These gains encourage organizations to absorb higher capital outlays in return for long-run productivity [2]Qualcomm Incorporated, “FY2025 1st Quarter Earnings Presentation,” Qualcomm, qualcomm.com.
Smart-city initiatives and public Wi-Fi roll-outs
Municipal broadband programs increasingly favor Wi-Fi as the primary medium for digital inclusion because installation is quicker and less capital-intensive than fiber in sprawling rural territories. The Philippines commits USD 1.2 billion to deploy more than 100,000 public hotspots across 17,000 barangays by 2028, a template mirrored by several emerging economies. Europe’s Digital Decade targets gigabit coverage by 2030 and positions Wi-Fi 7 mesh as an affordable last-mile alternative in mountainous and island regions. Cities monetize infrastructure by layering sensor backhaul for traffic, air-quality, and emergency-response schemes that self-fund through efficiency gains. Neutral-host deployments that blend Wi-Fi and 5G radios under OpenRoaming agreements generate fresh revenue as roaming fees while delivering seamless citizen connectivity.
Rapid adoption of Wi-Fi 6/6E and upcoming Wi-Fi 7
Enterprises accelerate refresh cycles because Wi-Fi 7 aggregates 2.4 GHz, 5 GHz, and 6 GHz links to deliver cumulative throughput beyond 40 Gbps, a prerequisite for high-definition collaborative platforms and immersive reality content. Leading silicon suppliers booked record pre-orders for Wi-Fi 7 chipsets in early 2025, highlighting pent-up demand. Hospitals adopt Wi-Fi 7 to support latency-intolerant surgical robotics and telemetry that classical WLAN cannot guarantee. Universities observe a three-fold rise in concurrent 4K streams once Wi-Fi 7 infrastructure is in place, sustaining hybrid classroom models without quality degradation. Backward compatibility smooths migration and protects prior device investments, reinforcing the upgrade imperative.
Hybrid/remote work models demanding high-capacity WLAN
Flexible workspace layouts force IT departments to implement software-defined WLAN that scales bandwidth to shifting occupancy. Video-conference concurrency climbed 250% since 2024, impelling organizations to dedicate 6 GHz spectrum for real-time applications and thereby eliminate interference from legacy 2.4 GHz equipment. Managed Wi-Fi revenue grows at double digits as firms offload network operations to specialists and refocus talent on core initiatives. Productivity studies reveal that workers experiencing sub-50 ms latency achieve 23% higher task completion rates than peers on congested links, reinforcing WLAN investment. Network-as-a-Service contracts trim operating expense swings by matching capacity to actual footfall, with some corporations cutting non-productive spend by 35% [3]Cisco Systems, “Redefining Network Management: The Advantages of Cisco Managed Campus for MSPs,” Cisco, cisco.com .
Restraints Impact Analysis of Wi-Fi Market*
| Restraint | (~) % Impact on CAGR Forecast | Geographic Relevance | Impact Timeline |
|---|---|---|---|
| Spectrum congestion and interference in unlicensed bands | –1.8% | Global; acute in dense cities | Short term (≤ 2 years) |
| Heightened data-privacy/security compliance costs | –1.2% | EU, North America | Medium term (2-4 years) |
| Li-Fi and 60 GHz alternatives cannibalizing dense-WiFi use cases | –0.9% | Niche deployments | Long term (≥ 4 years) |
| Chipset supply constraints delaying WiFi 7 device launches | –1.4% | Global; Asia manufacturing | Short term (≤ 2 years) |
| Source: Mordor Intelligence | |||
Spectrum congestion and interference in unlicensed bands
Dense urban precincts such as Manhattan experience throughput drops near 60% during peak usage, even when Wi-Fi 6E hardware is present, because legacy devices crowd the 2.4 GHz spectrum. Microwave ovens, Bluetooth handsets, and older routers create overlapping noise that adaptive algorithms cannot fully evade. Enterprises increasingly hire spectrum consultants, a service costing USD 50,000-200,000 on expansive campuses, to engineer channel plans that meet service-level objectives. Regulators consider quasi-licensed regimes akin to CBRS so that critical IoT traffic can operate free of consumer interference. Although the 6 GHz allocation temporarily alleviates pressure, forecasts show saturation within five years as IoT endpoints grow exponentially.
Heightened data-privacy and security compliance costs
Stringent regulations such as GDPR and CCPA obligate encryption, audit trails, and data-sovereignty controls that raise WLAN complexity by 40%. A 500-bed hospital attributes USD 1.5 million to Wi-Fi security upgrades needed for HIPAA compliance, including micro-segmentation and continuous vulnerability scanning. Zero-trust postures mandate integration with identity providers, public-key infrastructure, and real-time analytics, tripling day-to-day operational overhead. Financial firms isolate trading-floor traffic with hardware-enforced segmentation that costs USD 5,000 per access point, a premium many small organizations struggle to justify. Maintaining annual certifications across multi-vendor estates further inflates budgets and slows expansion in cost-sensitive markets.
*Our forecasts treat driver/restraint impacts as directional, not additive. The impact forecasts reflect baseline growth, mix effects, and variable interactions.
Wi-Fi Market Segment Analysis
By Component:
Services-led operating models gain momentumIn 2025, access points contributed 35.92% to the Wi-Fi market share, underlining hardware’s continuing relevance even as revenue mix shifts. The services segment, however, is projected to compound at 15.98% through 2031, reflecting the pivot to Network-as-a-Service frameworks that convert upfront capital into recurring operating expense. Cost pressures commoditize standalone routers and range extenders, while cloud-native orchestration platforms take over the policy and analytics roles previously executed by on-premises controllers. Managed service providers leverage artificial intelligence to automate channel allocation, load balancing, and anomaly detection, ultimately delivering 75% fewer unplanned-outage minutes than customer-operated networks. By 2031, the Wi-Fi market size attributed to software and services is expected to eclipse hardware contribution in mature economies as organizations prioritize life-cycle flexibility over asset ownership.
The shift mirrors broader IT procurement trends that favor outcomes over ownership. Consumption-based pricing aligns WLAN costs with occupancy levels, flattening budget spikes and improving CFO visibility. Vendors bundle proactive maintenance, security compliance, and real-time experience scoring to differentiate beyond hardware. Edge gateways and ruggedized IoT bridges constitute a small but fast-rising category, supplying deterministic connectivity in harsh industrial zones where vibration, dust, and temperature extremes invalidate consumer-grade gear. As AI chips embed inside access points, even commodity hardware gains value when offered as a managed experience that abstracts complexity and accelerates time to productivity.



By End-user Vertical:
Industrial automation steals the growth spotlightConsumer deployments accounted for 38.28% of the Wi-Fi market in 2025 because mesh systems proliferated across dense housing and home-office scenarios. Growth nevertheless moderates as penetration nears saturation in developed economies. In contrast, industrial and logistics environments are forecast to post a 17.18% CAGR through 2031, lifted by autonomous guided vehicles, digital twins, and asset-tracking tags that require deterministic latency and rapid handoff. Production lines integrate Wi-Fi robotics and sensor arrays that achieve 99.9% uptime on 6 GHz channels, reinforcing migration to the latest standards. Healthcare facilities adopt Wi-Fi-enabled patient telemetry that improves clinical outcomes by enabling continuous monitoring without tethering, while education systems broaden one-to-one device programs that rely on tri-band WLAN to sustain simultaneous 4K streams for remote learners.
Enterprise campuses modernize to support hybrid work, installing high-density AP clusters and analytics engines that optimize seating usage in real time. Hospitality groups deploy captive portals and loyalty apps over Wi-Fi to personalize guest experiences and upsell services. Retailers integrate point-of-sale, inventory robotics, and customer-facing AR navigation, extracting data that drives price optimization. These cross-sector uses expand the Wi-Fi market size well beyond its original consumer orientation, deepening vendor addressable revenue pools.
Geography Analysis
North America Wi-Fi Market
North America accounts for 40.55% of the Wi-Fi market in 2025, owing to USD 65 billion in broadband incentives and rapid enterprise refresh cycles. Early access to 6 GHz spectrum allows institutions to pioneer tri-band deployments, creating a performance gap over regions still seeking regulatory clearance. Fortune 500 companies refresh their WLAN every five years, two years faster than the global average, to equip smart offices tailored for hybrid work. Healthcare and education pillars represent robust growth nodes as telehealth and distance learning require enterprise-grade reliability.
APAC Wi-Fi Market
Asia Pacific records the fastest trajectory with a 15.12% CAGR through 2031, enabled by national digital strategies that treat wireless as primary rather than complementary infrastructure. China’s factory-automation boom, amplified by policy to cultivate domestic chipset capability, translates to bulk orders for industrial-grade Wi-Fi 6E equipment. India’s Digital India mission envisions connecting 600,000 villages via Wi-Fi mesh, making wireless the linchpin of rural inclusion. Southeast Asian economies integrate WLAN across tourism hubs and export-oriented manufacturing parks, while government subsidies shrink payback periods and accelerate deployments. Smart-city funding rounds across Jakarta, Bangkok, and Ho Chi Minh City further elevate regional demand.
EMEA Wi-Fi Market
Europe’s growth remains orderly as Industry 4.0 uptake and Digital Decade mandates require gigabit household coverage by 2030. Wi-Fi serves as the cost-effective last-mile solution in rugged topographies like the Alps and the Greek islands. OpenRoaming agreements spearheaded by the EU Digital Single Market create frictionless cross-border connectivity, bolstering tourism and remote business travel. Germany leads industrial adoption, whereas Nordic nations focus on smart-grid and sustainability use cases that rely on energy-efficient TWT scheduling. The Middle East and Africa invest in Wi-Fi to diversify economies beyond hydrocarbons and to bridge digital divides in rural deserts and mountainous terrain.

Regulatory Landscape
Wi-Fi regulation continues to be shaped by 6 GHz band rules and power-control frameworks that define where Wi-Fi 6E and Wi-Fi 7 can be deployed at scale. In the United States, the Federal Communications Commission expanded Very Low Power (VLP) operations across the full 6 GHz band (5925-7125 MHz) in March 2025, then adopted a Geofenced Variable Power (GVP) device category in January 2026 (with an April 2026 effective date). This higher-power 6 GHz operation is enabled under location and control constraints designed to protect incumbents.
Regulatory approaches remain uneven across major regions, affecting global SKU strategy and enterprise and public Wi-Fi deployment economics. In the United Kingdom, Ofcom authorized shared access in the Upper 6 GHz band (6425-7125 MHz) in July 2026 for Low Power Indoor (LPI) Wi-Fi alongside mobile under a hybrid sharing model. Across markets, compliance is increasingly tied to dynamic spectrum management concepts (for example, AFC-controlled and geofenced power) and to meeting regional 6 GHz operating conditions, rather than to radio-only performance differentiation.
Value Chain Analysis
The Wi-Fi value chain runs across standards and certification (IEEE 802.11 family and Wi-Fi Alliance programs), silicon and RF components, OEM and ODM manufacturing, enterprise and consumer device brands, and distribution through channel partners, operators, and managed service providers. Wi-Fi 7 raises bill of materials and qualification complexity as dependence increases on advanced RF front-end modules (power amplifiers, switches, and SAW/BAW filters) and higher-performance baseband chipsets from Qualcomm, Broadcom, and MediaTek, while some emerging players scale in lower-cost and IoT edge deployments. Manufacturing concentration in specialized RF processes and acoustic filter capacity also makes supply lead times more sensitive, especially as enterprises shorten WLAN refresh cycles.
Regulatory and test requirements add another gating layer because 6 GHz availability and allowed power modes differ by region, requiring vendors to manage regional configurations and certification pathways. In Europe, harmonization continues through the European harmonised standard EN 303 687 V1.1.1 for 6 GHz RLAN equipment, cited in the Official Journal of the European Union on May 14, 2025, which supports market access for Wi-Fi 6E and Wi-Fi 7 products under defined test conditions and restrictions. Supplier partnerships remain central for time-to-market, including MediaTek selecting Qorvo to supply Wi-Fi 7 front-end modules for the Dimensity 9400 platform (volume shipments commencing in Q4 2024).
Competitive Landscape
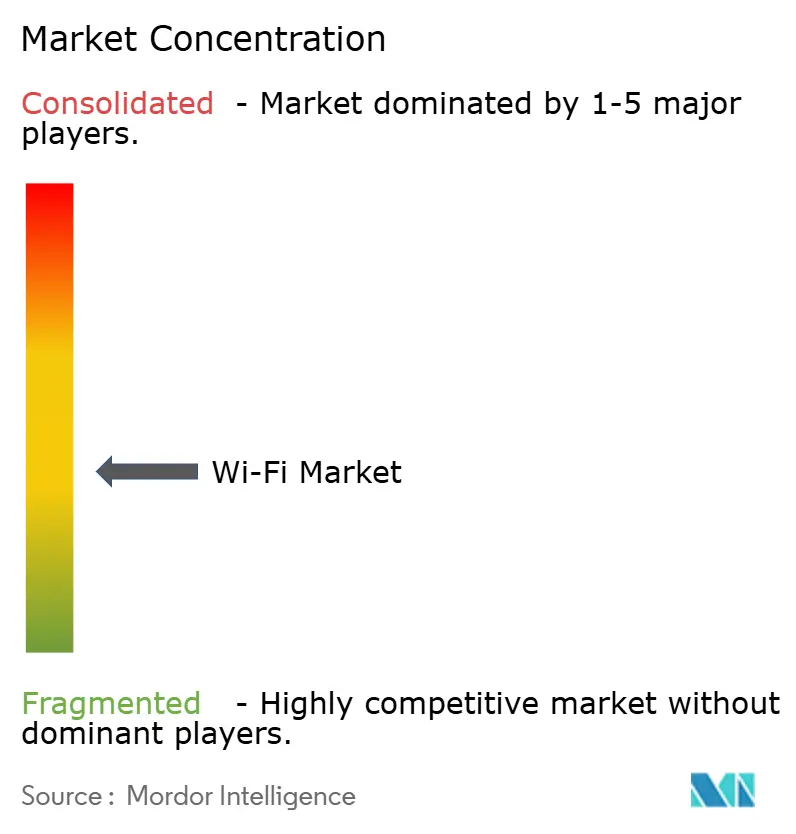
The Wi-Fi market is moderately concentrated. Legacy titans such as Cisco and HPE Aruba leverage extensive channels to defend share, but must contend with service-first entrants that deliver vertically integrated experiences under consumption contracts. Silicon supply is concentrated among Qualcomm, Broadcom, and MediaTek, making chipset availability the gating factor for vendor roadmaps, especially during the Wi-Fi 7 transition. Start-ups position artificial intelligence, zero-trust security, and edge-computing hooks as their levers for differentiation, arguing that the real contest now centers on software efficacy rather than radio specification.
Qualcomm’s FastConnect 7900 introduces AI-powered optimization for power, latency, and throughput, blending Ultra-Wideband for secure ranging and Bluetooth Channel Sounding for positional accuracy. Ubiquiti targets prosumers with simplified cloud dashboards that cut the total cost of ownership for small businesses unable to staff dedicated network teams. Carrier alliances test OpenRoaming to stitch cellular and Wi-Fi authentications, expanding addressable audiences for both camps while blurring traditional demarcations. Meanwhile, industrial specialists secure footholds in hazardous environments with explosion-proof access points that fetch premium margins despite low volume.
Vendor competitiveness thus tilts toward agility in firmware, security orchestration, and consumption-based service bundling. Those slow to integrate AI-driven diagnostics risk relegation to hardware commodity status, underscoring the shrinking window for differentiation during rapid generational shifts. Across segments, the Wi-Fi market size continues to reallocate from one-time equipment sales to recurring software and services, a macro trend that redefines competitive advantage.
Wi-Fi Industry Leaders
Cisco Systems, Inc.
Hewlett Packard Enterprise (Aruba)
Huawei Technologies Co., Ltd.
CommScope Holding Company Inc.(Ruckus Networks)
Telefonaktiebolaget LM Ericsson
- *Disclaimer: Major Players sorted in no particular order
Wi-Fi Market Companies Covered in this Report
- Cisco Systems, Inc.
- Hewlett Packard Enterprise (Aruba)
- Huawei Technologies Co., Ltd.
- CommScope Holding Company Inc.(Ruckus Networks)
- Juniper Networks Inc.
- Telefonaktiebolaget LM Ericsson
- Extreme Networks, Inc.
- Ubiquiti Inc.
- Fortinet Inc.
- TP-Link Technologies Co., Ltd.
- Netgear Inc.
- D-Link Corporation
- Zyxel Communications Corp.
- Qualcomm Technologies, Inc.
- Broadcom Inc.
- Intel Corporation
- MediaTek Inc.
- Cambium Networks Ltd.
- EnGenius Networks, Inc. (Elitegroup)
- Purple WiFi Ltd.
- Cloud4Wi Inc.
- MetTel Inc.
- Singtel Group

Market Opportunities and Future Outlook
Enterprise WLAN refresh cycles and managed operations are a clear whitespace as Wi-Fi shifts from hardware-led rollouts toward service-led operating models that bundle security, compliance, and experience assurance. Demand is supported by Wi-Fi 7 commercialization and interoperability programs, including the Wi-Fi Alliance introducing Wi-Fi CERTIFIED 7 and scheduling Wi-Fi 7 R2 certification activities for early 2026, which helps procurement teams support multi-vendor deployments. The Wireless Broadband Alliance (WBA) Industry Report 2026 also documented near-term deployment intent among surveyed stakeholders for Wi-Fi 7 across enterprise, venue, and operator footprints.
Operator-led Wi-Fi 7 router bundling and converged Wi-Fi/5G authentication frameworks create additional monetization paths beyond one-time equipment sales, particularly where OpenRoaming and Passpoint reduce onboarding friction in public and hospitality networks. Named operators across North America, Europe, and Asia, including Charter Communications, Frontier Communications, Rogers, Telus, Swisscom, Singtel, StarHub, MyRepublic, and ViewQwest, have been cited bundling Wi-Fi 7 routers with premium broadband packages and linking Wi-Fi upgrades to fiber speed tiers and customer experience management. Opportunities also track regulatory enablement, since newly expanded 6 GHz power categories (for example, FCC VLP in 2025 and GVP in 2026, plus Ofcoms 2026 Upper 6 GHz sharing decision) widen the feasible deployment set for dense campuses, outdoor venues, and city-scale public Wi-Fi where permitted.
Recent Industry Developments in Wi-Fi Market
- July 2026: HPE Aruba Networking announced AOS 8.13.3 support for its 7xx Series Wi-Fi 7 access points, extending software coverage for customers maintaining existing Aruba OS 8 environments. The update helps enterprises manage phased migrations to Aruba Central (AOS-10) while keeping Wi-Fi 7 hardware deployments aligned to current operational models.
- May 2026: HPE disclosed Wi-Fi 7 updates including the AP723H, a dual-platform access point designed to boot into either Juniper Mist or Aruba Central management modes. This approach reduces platform lock-in during enterprise refresh cycles and supports mixed management environments as organizations align Wi-Fi operations with broader AI-native networking strategies.
- October 2024: Qorvo announced it was selected by MediaTek as a key supplier for the inaugural wave of Wi-Fi 7 front-end modules integrated into the Dimensity 9400 platform, with volume shipments commencing in Q4 2024. The design win strengthened Qorvos position in Wi-Fi 7 RF content and supported MediaTeks ability to scale Wi-Fi 7 device availability through a major smartphone SoC platform.


Wi-Fi Market Report Scope and Research Methodology
Market Definition and Coverage
For this methodology, the Wi-Fi market covers revenue tied to Wi-Fi connectivity equipment and related deployments that enable wireless local area networking across homes, enterprises, and public environments, measured in USD on a global basis.
Scope exclusions: We exclude cellular access services and wired LAN infrastructure (such as Ethernet switching) unless they are bundled within Wi-Fi equipment revenue.
Segments Covered in This Report
- By Component
- Hardware
- Access Points
- Routers and Extenders
- Wireless Controllers
- Other Device Types
- Solutions
- Services
- Hardware
- By End-user Vertical
- Consumer
- Enterprise/Corporate Campuses
- Education
- Healthcare
- Hospitality and Retail
- Industrial and Logistics
- By Geography
- North America
- United States
- Canada
- Mexico
- South America
- Brazil
- Argentina
- Rest of South America
- Europe
- Germany
- United Kingdom
- France
- Italy
- Spain
- Russia
- Rest of Europe
- Asia Pacific
- China
- Japan
- South Korea
- India
- Australia and New Zealand
- Rest of Asia Pacific
- Middle East
- GCC
- Turkey
- Rest of Middle East
- Africa
- South Africa
- Nigeria
- Rest of Africa
- North America
Data Sources, Market Sizing, and Validation
Desk Research
Desk work starts with aligning the Wi-Fi scope to publicly visible adoption signals, and then mapping them to monetizable equipment demand. We used sources such as Wi-Fi Alliance publications on device shipments and standards momentum, and also spectrum policy updates from regulators such as the FCC and ETSI that shape 6 GHz availability.
For market structure and demand context, we reviewed trade association and standards material (such as IEEE 802.11 releases), customs and trade statistics where they help explain equipment flows, and peer-reviewed networking journals that show where performance and security requirements are moving. Company filings, investor presentations, and reputable press were used to cross-check product cycles, pricing direction, and region level demand commentary. In addition, we selectively used paid subscriptions for company financials and intelligence, and for patent databases to validate timing of standard shifts and product launches. The desk research sources listed here are illustrative, and many other public and paid references were also used for data collection, validation, and clarification.
Primary Interviews and Surveys
Primary work was used to test the demand model assumptions that are not directly visible in public datasets, especially refresh cycles, average selling price movement, and how Wi-Fi 6E and Wi-Fi 7 transitions are being budgeted. We spoke with a mix of equipment suppliers, channel and distribution participants, enterprise IT and network leaders, and service-provider facing roles across major regions so that our regional weights and deployment splits reflect real procurement patterns.
Distribution of primary research fieldwork respondents
| Company type | Respondent position | Region |
|---|---|---|
| Top tier: 30% | CXOs: 14% | APAC: 49% |
| Mid tier: 53% | Functional/Unit leaders: 41% | EMEA: 33% |
| Smaller Players: 17% | Managers: 45% | Americas: 18% |
Market-Sizing & Forecasting
Sizing begins with a top-down build where regional demand is reconstructed using a practical demand pool, including connected device growth, enterprise site counts, broadband household penetration, and the shift in standard mix (Wi-Fi 5 to Wi-Fi 6/6E to Wi-Fi 7). To keep the model grounded, we apply price and mix logic by product class using inputs such as access point attach rates, replacement cycles, public venue deployment intensity, and observed ASP direction from procurement feedback.
The totals are then corroborated with selective bottom-up approximations, where revenue is sanity-checked through supplier and channel roll-ups in a sampled set of regions, followed by ASP times volume checks for representative equipment categories. When gaps appear, especially in smaller public deployments or informal channel routes, we use conservative fill factors that are validated in follow-up calls rather than forcing a full supplier census.
For forecasting, we rely on scenario analysis supported by a light multivariate structure, where forward variables like device density growth, enterprise capex patterns, spectrum availability, and standard adoption timing are varied within realistic bands. Final year-by-year outputs are adjusted only after experts confirm that the implied refresh cadence and pricing trend make sense for typical buying cycles.
Data Validation & Update Cycle
Validation is done in several steps so the numbers do not rely on one data stream. We cross-check outputs against independent signals such as device shipment commentary, enterprise WLAN spending direction, and standard transition timing, and then variance outliers are reworked until they follow a consistent story by region and end environment.
Before sign-off, the model and assumptions go through multi-step analyst reviews, and any large deltas trigger re-contact with interviewees for clarification. Reports are refreshed annually, and we also do interim updates when material events occur, such as major spectrum policy changes, sharp pricing swings, or unexpected demand slowdowns. Right before delivery, a fresh pass is completed so clients receive the most current view that fits the defined scope.
Mordor Intelligence's Wi Fi Market Sizing Compared With Other Published Estimates
Published Wi-Fi market values can differ widely because teams often measure different parts of the ecosystem and do not always align on what counts as Wi-Fi revenue. Differences also come from base-year choice, how pricing is trended, and whether the estimate is anchored to enterprise equipment only or includes broader residential and public deployments.
A common split is whether the figure includes only enterprise WLAN equipment revenue or it also captures consumer routers, extenders, and public Wi-Fi buildouts, and that scope choice can change the total more than any single growth assumption. Some sources also use aggressive standard transition timing that pulls forward Wi-Fi 7 uptake, and others blend service revenue into equipment, which can inflate totals if contract lengths are not normalized, a modeling choice applied by Mordor Intelligence.
Benchmark comparison
| Source | Market Size | Gaps in Research Methodology |
|---|---|---|
| Mordor Intelligence | USD 21.06 B (2026) | |
| Global Consultancy A | USD 22.06 B (2024) | Uses a different base year and may apply a wider definition of Wi-Fi offerings, which can shift totals if services and software layers are counted alongside equipment. |
| Trade Journal B | USD 14.50 B (2023) | The starting year appears earlier and the ramp implied by the forecast is much steeper, which suggests different assumptions on ASP progression and the pace of enterprise and public deployment upgrades. |
The table shows that the spread is largely explained by year selection and what is included inside the Wi-Fi revenue bucket. By keeping scope rules explicit and tying growth to observable adoption signals like standards mix and refresh timing, we get a market size that is easier to replicate and audit across regions and time.


Key Questions Answered in the Report
How fast is the Wi-Fi market expected to grow between 2026 and 2031?
The Wi-Fi market is projected to expand at a 13.94% CAGR, rising from USD 21.06 billion in 2026 to USD 40.44 billion by 2031.
Which region will see the highest growth in new Wi-Fi deployments?
Asia Pacific leads with a 15.12% CAGR through 2031, driven by smart-city funding, factory automation, and rural connectivity initiatives.
Why are enterprises shifting toward Network-as-a-Service models for WLAN?
NaaS converts capital outlays into predictable operating expense and bundles AI-powered optimization, resulting in 75% fewer unplanned-outage minutes than self-managed networks.
What role does 6 GHz spectrum play in next-generation Wi-Fi?
The 6 GHz band adds contiguous channels that mitigate congestion and enable Wi-Fi 7’s multi-link operation, delivering aggregated throughput beyond 40 Gbps for latency-sensitive applications.
Which end-user vertical will grow the fastest through 2031?
The industrial and logistics vertical is forecast to advance at 17.18% CAGR as autonomous vehicles, asset tracking, and predictive maintenance rely on deterministic Wi-Fi links.
How are security regulations affecting enterprise WLAN budgets?
Compliance with GDPR, CCPA, and sector-specific mandates increases WLAN complexity by around 40% and can add USD 5,000 per access point when micro-segmentation and zero-trust features are required.
Page last updated on:


 Your data is secure and never sold or shared.


