
Chip Antenna Market Size and Share
Market Overview
| Study Period | 2020 - 2031 |
|---|---|
| Market Size (2026) | USD 2.49 Billion |
| Market Size (2031) | USD 5.88 Billion |
| Growth Rate (2026 - 2031) | 18.72 % |
| Fastest Growing Market | Asia Pacific |
| Largest Market | Asia Pacific |
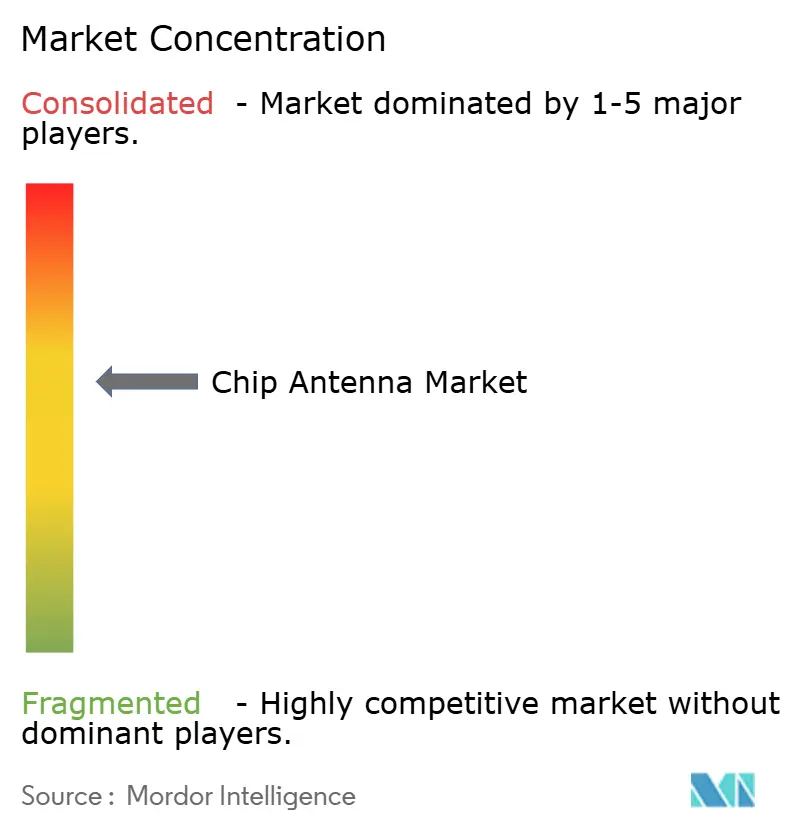
| Market Concentration | Medium |
Major Players *Disclaimer: Major Players sorted in no particular order Image © Mordor Intelligence. Reuse requires attribution under CC BY 4.0. | |
Chip Antenna Market Analysis by Mordor Intelligence
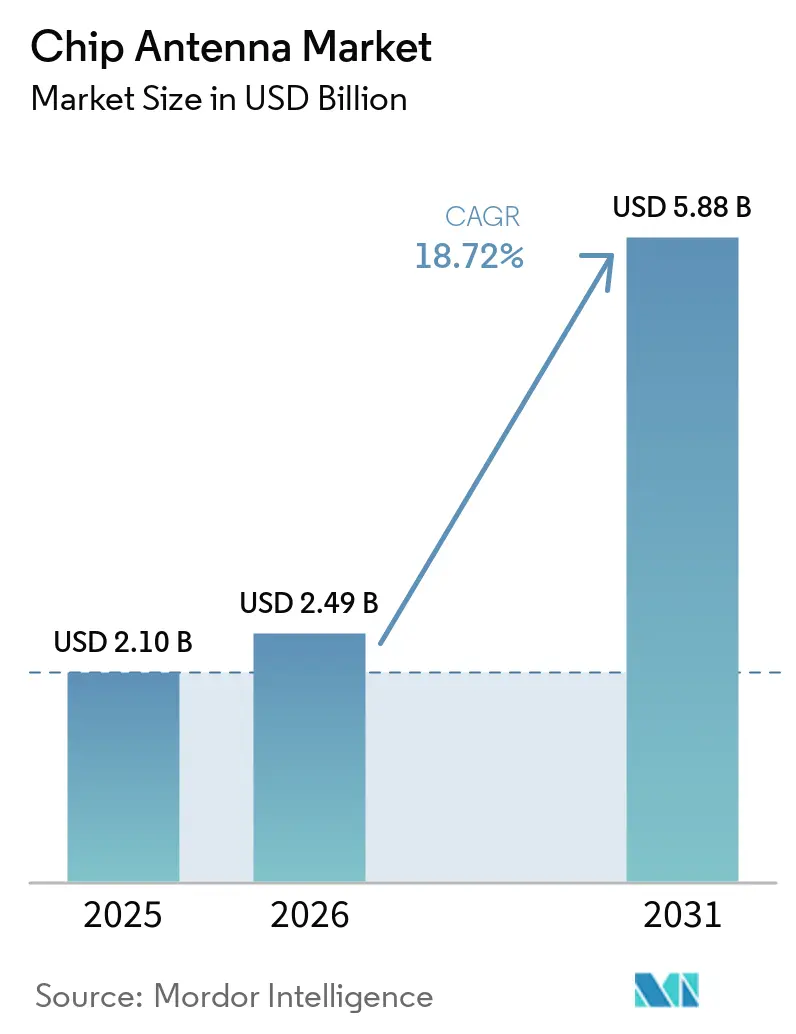
The Chip Antenna Market size was valued at USD 2.10 billion in 2025 and estimated to grow from USD 2.49 billion in 2026 to reach USD 5.88 billion by 2031, at a CAGR of 18.72% during the forecast period (2026-2031).
Rapid miniaturization of consumer electronics, 5G roll-outs, and a growing fleet of IoT devices are the primary forces widening demand for compact, high-performance antennas that fit where classical PCB or FPC formats cannot. Design wins in Bluetooth Low Energy wearables, LTCC adoption in in-cabin radar, and Wi-Fi 6E reference mandates in smart appliances are accelerating volume shipments, while private 5G industrial networks supply an additional layer of long-term growth. Concurrently, patent disputes around fractal geometry and the technical hurdle of multi-radio coexistence in ultra-compact devices are pressing suppliers to pursue inventive materials and form factors that raise efficiency and shrink footprints.
Key Report Takeaways
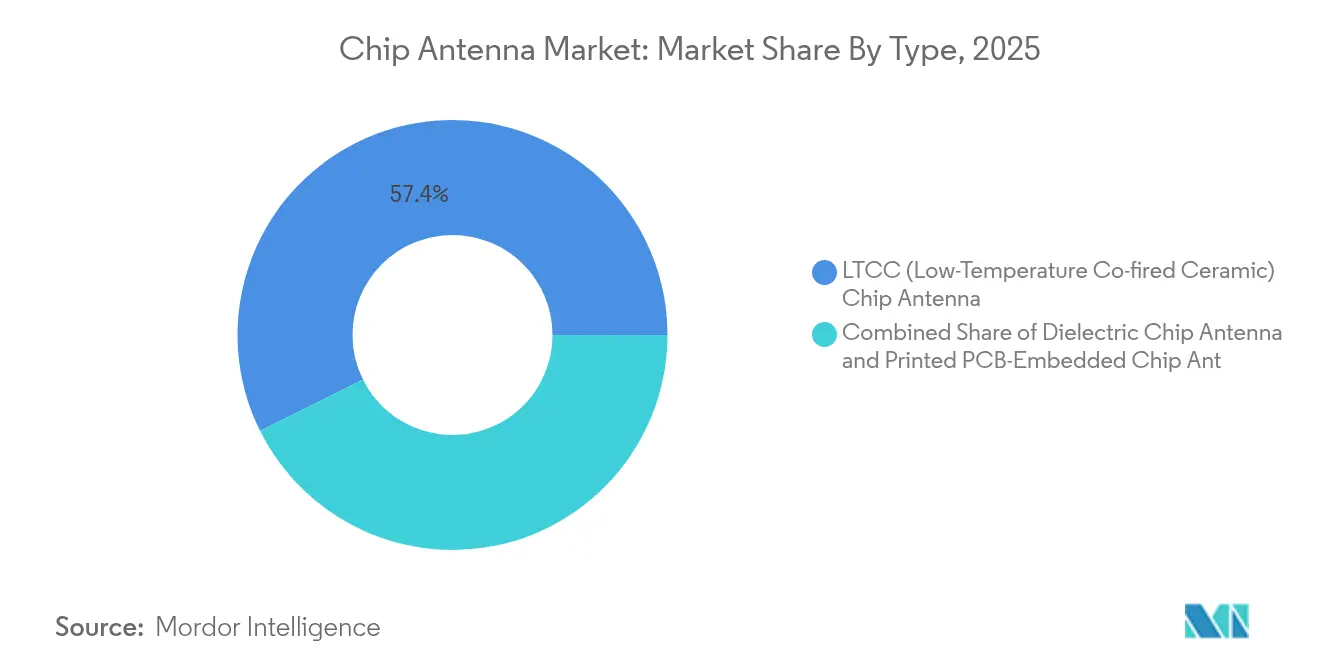
- By type, LTCC captured 57.35% of the chip antenna market share in 2025; dielectric ceramic is projected to grow at a 19.86% CAGR to 2031.
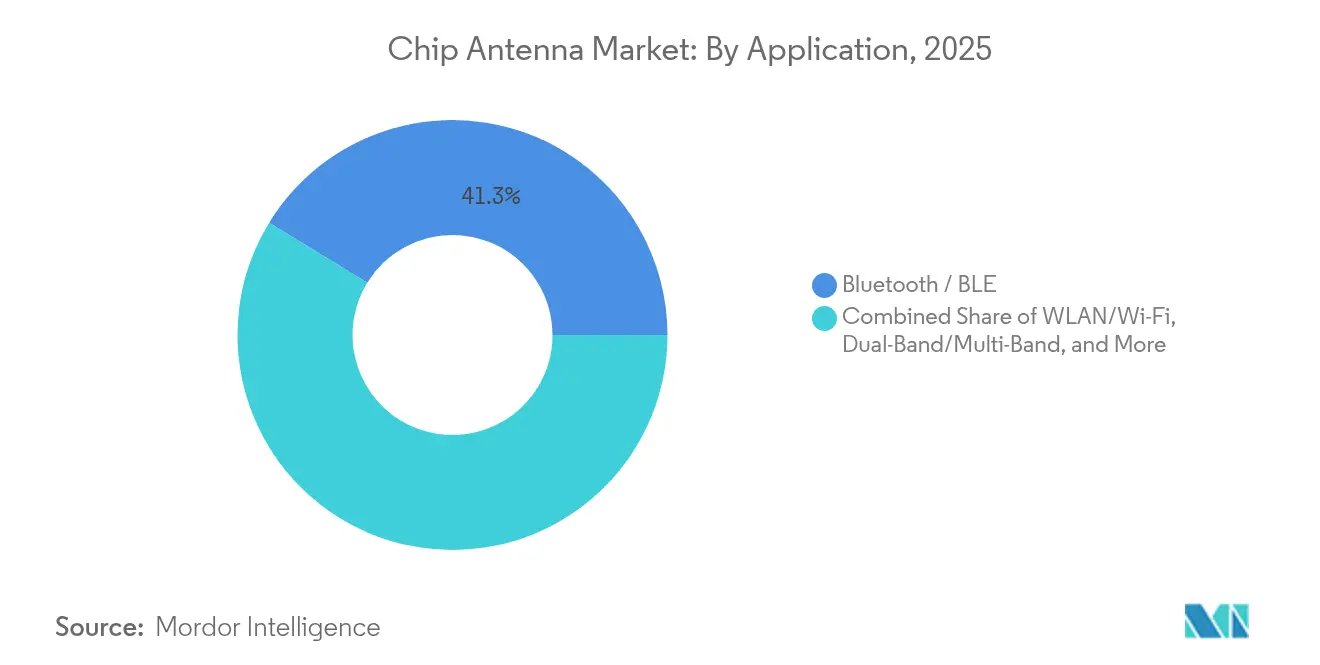
- By application, Bluetooth/BLE held 41.25% of the chip antenna market size in 2025, while GPS/GNSS is projected to expand at a 20.92% CAGR to 2031.
- By end-user, IT & telecommunications infrastructure accounted for 32.45% of revenue in 2025; automotive is advancing at a 19.73% CAGR through 2031.
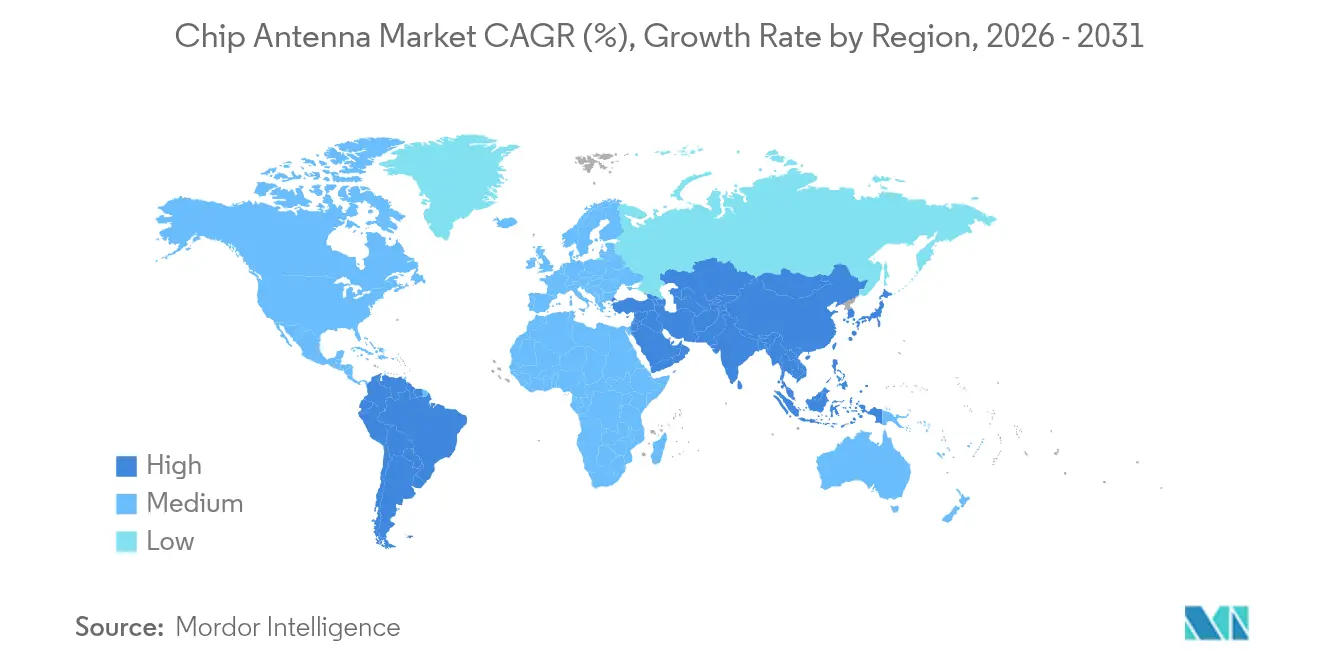
- By region, Asia Pacific led with 45.60% revenue share in 2025; North America is forecast to expand at a 19.55% CAGR through 2031.
Note: Market size and forecast figures in this report are generated using Mordor Intelligence’s proprietary estimation framework, updated with the latest available data and insights as of 2026.
Market Trends and Insights
Drivers Impact Analysis of Chip Antenna Market*
| Driver | (~) % Impact on CAGR Forecast | Geographic Relevance | Impact Timeline |
|---|---|---|---|
| Bluetooth-LE design wins for wearables | +4.80% | North America, Europe, Asia Pacific | Medium term (2-4 years) |
| LTCC antennas in in-cabin ADAS radar | +3.80% | North America, Europe, Asia Pacific | Medium term (2-4 years) |
| Wi-Fi 6E reference designs in smart appliances | +3.40% | Global | Short term (≤ 2 years) |
| Private-5G industrial networks | +2.90% | North America, Europe, Asia Pacific | Long term (≥ 4 years) |
| Source: Mordor Intelligence | |||
Bluetooth-LE design wins for wearables in OEM clusters
Bluetooth Low Energy has become the de facto protocol for smart watches, fitness sensors, and emerging medical wearables. Tier-one OEMs have started standardizing antenna layouts across multiple product families, enabling economy-of-scale procurement and faster platform refresh cycles. Nordic Semiconductor’s nRF54L series underscores the trend with a higher-efficiency radio and reference layout optimized for chip antennas. Annual Bluetooth LE device shipments exceeded 1.8 billion in 2024, a figure that keeps antenna suppliers on an upward capacity trajectory. The design convergence is spreading into industrial and medical categories where reliability, biocompatibility, and firmware-over-air updates add further performance requirements. Consequently, vendors are investing in tunable impedance networks and high-dielectric ceramics to balance size with efficiency.
LTCC antennas adopted in-cabin ADAS radar modules
Automakers increasingly embed radar units behind headliners and dashboards to monitor occupants. These locations demand antennas that withstand heat cycles and deliver stable gain at 76-81 GHz. LTCC substrates meet both needs through low loss tangent and dimensional stability. Johanson Technology’s directional RHCP antenna combines AEC-Q200 qualification with a slim profile that resists detuning from plastic trim[1]Johanson Technology, “2440AT62B0085002U Automotive Antenna,” johansontechnology.com. Parallel R&D alliances, such as Indie Semiconductor with GlobalFoundries, target 77 GHz and 120 GHz radar SoCs that call for equally precise antenna arrays. These moves elevate chip antennas from discretionary items to safety-critical components governed by automotive PPAP and ISO 26262 workflows.
Wi-Fi 6E reference designs mandate chip antennas in smart appliances
Opening the 6 GHz band doubled the unlicensed spectrum ceiling, allowing appliance OEMs to embed true tri-band radios. Reference platforms from chipset vendors now circulate with explicit chip-antenna footprints to maintain isolation across 2.4, 5, and 6 GHz paths. Murata’s Type 2FY module, built around Infineon’s CYW55513, arrives pre-certified for U.S. and EU markets and demonstrates a sub-2 dB return loss uplift on 6 GHz when paired with a 7 mm LTCC antenna[2]Murata Manufacturing, “Type 2FY Wi-Fi 6E/BLE Module Release,” murata.com. Integration places fresh emphasis on spatial-filter structures and matching networks that only specialized antenna vendors currently supply at scale.
Private 5G industrial networks driving sub-6 GHz sensor demand
Factory and warehouse operators are rolling out private NR networks to connect robots, machine vision cameras, and sensor nodes. Investments are pacing at a 42% CAGR toward USD 3.5 billion by 2027, with early adopters citing latency cuts of 40 ms versus Wi-Fi in closed-loop controls. Sub-6 GHz chip antennas see heightened volumes because floor-mounted and ceiling-mounted sensors require compact, omnidirectional elements that tolerate metal enclosures. Advanced features such as ultra-reliable low-latency communication (URLLC) elevate return-loss targets and in-situ calibration support, pushing vendors to integrate temperature-stable ceramics and phased stamping techniques.
Restraints Impact Analysis of Chip Antenna Market*
| Restraint | (~) % Impact on CAGR Forecast | Geographic Relevance | Impact Timeline |
|---|---|---|---|
| Efficiency gap vs. PCB/FPC in mmWave AR | -2.30% | North America, Asia Pacific | Medium term (2-4 years) |
| U.S. fractal-geometry IP litigation | -1.50% | Global (emphasis North America) | Short term (≤ 2 years) |
| Multi-radio coexistence detuning in wearables | -1.30% | Global | Medium term (2-4 years) |
| Source: Mordor Intelligence | |||
Efficiency gap vs. custom PCB/FPC antennas in mmWave AR glasses
Augmented-reality eyewear streams multi-gigabit data over 24 GHz and higher bands. Custom copper traces etched into curved FPCs still outperform discrete chip antennas by up to 2 dB in total radiated power, a gap that directly impacts battery life and graphics latency. Research into transparent slot-loop antennas etched on metal-mesh films shows promise, but mass adoption remains limited due to higher bill-of-materials costs and fragile substrates. Consequently, premium AR/VR brands continue to specify tailored feed structures, sidelining off-the-shelf chip antennas in this niche.
U.S. fractal-geometry IP litigation disrupting supply-chain diversification
Litigation around multilevel fractal antennas, notably patents US9362617B2 and US11349200B2 held by Fractus SA, forces OEMs to weigh licensing fees against redesign timelines. The uncertainty discourages smaller suppliers from entering multi-band antenna niches, consolidating bargaining power among incumbents, and slowing alternative form-factor exploration. Project rollouts aimed at mid-band 5G or dual-band GNSS can face multi-quarter delays when infringement claims surface, translating to real revenue drag for the chip antenna market.
*Our forecasts treat driver/restraint impacts as directional, not additive. The impact forecasts reflect baseline growth, mix effects, and variable interactions.
Chip Antenna Market Segment Analysis
By Type:
LTCC maintains lead through thermal stabilityLTCC antennas held 57.35% of the chip antenna market share in 2025 due to their ability to operate at millimeter-wave frequencies with minimal performance drift under wide temperature swings. This dominance is reinforced by rising adoption in automotive radar modules that must endure up to +105 °C profiles on cabin roofs. Printed dielectric antennas trail in volume but post the fastest growth, riding a 19.86% CAGR as materials science innovations squeeze higher Q-factors into thinner substrates.
Demand is further bolstered by smartphone OEMs that value LTCC’s co-fired multilayer capability, allowing integration of filtering and matching networks inside the same ceramic block. Conversely, PCB-embedded antennas remain an attractive choice for cost-sensitive IoT gateways where performance tolerances are broad and unit counts run into millions. Continuous miniaturization funnels R&D dollars into ultra-short monopole geometries, aiding penetration in medical capsules that require 2.4 GHz telemetry yet measure under 10 mm.



By Application:
Bluetooth leads while GPS acceleratesBluetooth/BLE recorded 41.25% of 2025 revenue, kept aloft by wearables, smart locks, and hearing aids that need ultra-low power yet stable 2.4 GHz links. OEM standardization on BLE shapes a predictable design ecosystem in which catalog chip antennas shorten development cycles and cut certification costs. The GPS/GNSS segment is the fastest riser, moving at a 20.92% CAGR as connected cars, drones, and precision-agriculture handsets demand centimeter-level accuracy.
Next-generation GNSS receivers incorporating L1, L2, and L5 bands raise gain requirements, prompting antenna makers to tailor stacked ceramic resonators. Wi-Fi, especially Wi-Fi 6E, follows close behind as tri-band routers and smart appliances proliferate. Multi-protocol devices that juggle Bluetooth, Wi-Fi, and LPWAN push suppliers toward broadband or dual-feed architectures that keep impedance under control across an octave of frequencies.
By End-User:
Telecom infrastructure dominates while automotive acceleratesIT & telecommunications operators captured 32.45% of the 2025 demand thanks to the densification of 5G small cells and back-haul radios. Indoor DAS and outdoor micro-sites now frequently employ chip antennas as reference elements for auto-calibration routines. Automotive electronics register the steepest climb, at a projected 19.73% CAGR to 2031, mirroring the shift toward advanced driver-assistance features that mandate radar, LTE, and Wi-Fi inside every trim level.
Consumer electronics retains a broad base, yet unit growth decelerates compared with connected-vehicle volumes. Healthcare devices emerge as a strategic frontier where regulatory compliance and biocompatibility elevate margins. Industrial IoT augments long-term visibility because predictive-maintenance sensors rely on low-profile antennas to fit inside metallic housings on factory floors.
Geography Analysis
APAC Chip Antenna Market
Asia Pacific controls 45.60% of the chip antenna market revenue and is expanding at a forecast 19.48% CAGR through 2031. China deploys more than 2.3 million 5G base stations, sustaining a high-volume procurement pipeline for small-form antennas used in CPE routers and UE modules. Japan’s precision-manufacturing heritage positions local suppliers at the premium end of LTCC, cementing supply lines to tier-one automotive clients. South Korean conglomerates leverage in-house capabilities to embed custom multi-band antennas into smartphones and home appliances, reinforcing domestic vertical integration.
North America Chip Antenna Market
North America ranks second as telecom carriers refarm mid-band spectrum and EV makers push data-rich platforms that require robust sub-6 GHz links. The CHIPS and Science Act stimulates domestic substrate and packaging capacity, indirectly supporting antenna production in Arizona and Texas. Demand from defense and aerospace primes further incremental gains because SATCOM terminals and low-earth-orbit user equipment rely on phased arrays with ceramic feed networks.
Europe Chip Antenna Market
Europe trails closely, anchored by Germany’s automotive sector and the EU’s strict EMC regulations that favor higher-quality dielectric solutions. The European Chips Act seeks to replicate parts of Asia’s supply chain, providing funding that could catalyze regional antenna fabrication over the next five years. Regulatory harmonization across L-band GNSS and 6-GHz Wi-Fi also influences antenna tuning priorities for products intended for continental markets.

Regulatory Landscape
Chip antenna adoption is shaped by radio equipment conformity requirements, along with expanding supply-chain security and cybersecurity obligations for connected devices and telecom infrastructure. In the United States, the FCC equipment authorization framework is a key gate for RF-enabled products, and 2026 actions increased scrutiny of the integrity of Telecommunications Certification Bodies as part of the broader equipment authorization ecosystem.
In Europe, the regulatory direction in 2026 tied communications infrastructure policy more closely to cybersecurity and resilience, alongside ongoing harmonization through standards bodies such as ETSI (for example, ETSI EN 302 326-2 V2.2.1 adopted in March 2026 with withdrawal of conflicting national standards by December 31, 2027). In India, the Telecommunication Engineering Centre (TEC) administers MTCTE, which influences go-to-market timelines for wireless equipment sold into the country and raises documentation and test-report readiness expectations across the antenna and module supply chain.
Value Chain Analysis
The chip antenna value chain starts with upstream inputs such as specialty ceramic powders, LTCC tapes, and conductive pastes (silver/palladium), then moves through antenna design, ceramic processing and co-firing, metallization, and SMT packaging. Midstream capability concentrates around RF materials know-how and process control for consistent dielectric properties, followed by RF test, tuning, and reliability qualification that become more stringent in automotive and medical programs, where OEM qualification cycles commonly run 12 to 24 months.
Downstream, chip antennas are designed into modules and end products by OEMs and EMS partners, with distribution typically supported by direct supply agreements and global component channels. Key bottlenecks tend to be advanced ceramic materials, LTCC capacity, and RF engineering resources for placement and detuning mitigation in compact devices. Regionalization is visible in assembly and PCB-related steps expanding across parts of Southeast Asia, while higher-end LTCC production remains anchored in Japan and South Korea, keeping supply continuity tied to a smaller set of material and process hubs.
Competitive Landscape
The global playing field blends specialized firms focused on high-frequency ceramics with diversified component conglomerates that spread risk across connectors, filters, and antennas. The chip antenna market is moderately fragmented; the top five suppliers controlled about 34% of revenue in 2024. Application-specific designs now dominate RFPs, rewarding vendors able to co-optimize radiation, filtering, and EMC performance within a single package.
Johanson Technology illustrates this specialization by rolling out a directional 2.4 GHz chip antenna sporting right-hand circular polarization for over-the-air robustness inside vehicles. Murata integrates chip antennas with certified radio modules, allowing appliance OEMs to meet certification windows without bespoke RF expertise. Molex invests in virtual-antenna technology to offer broadband coverage from 698 MHz to 10.5 GHz, targeting IoT endpoints that require protocol agility.
Intellectual property battles act as a soft barrier to entry. Fractus SA holds key fractal-geometry patents, spurring license negotiations that can influence cost structures for new entrants[3]Fractus SA, “Multilevel Antenna Patent Portfolio,” fractus.com. Meanwhile, suppliers experiment with additive manufacturing and glass-ceramic fusion to sharpen beam steering for sub-THz links aimed at next-generation AR headsets and fixed-wireless access. Buyers increasingly rate vendors by traceability, AEC-Q200 compliance, and dual-sourcing ability in light of geopolitical supply-chain scrutiny.
Chip Antenna Industry Leaders
Vishay Intertechnology, Inc.
Yageo Corporation
Johanson Technology,Inc.
Mitsubishi Materials Corporation
Antenova Ltd.
- *Disclaimer: Major Players sorted in no particular order
Chip Antenna Market Companies Covered in this Report
- Vishay Intertechnology Inc.
- Yageo Corporation
- Johanson Technology Inc.
- Fractus S.A.
- Antenova Ltd.
- Partron Co., Ltd.
- Inpaq Technology Co., Ltd.
- Mitsubishi Materials Corporation
- Taoglas Limited
- Fractus Antennas S.L.
- Murata Manufacturing Co., Ltd.
- KYOCERA AVX Components Corporation
- Molex LLC
- Linx Technologies Inc.
- Pulse Electronics Corp.
- TE Connectivity Ltd.
- Laird Connectivity
- Abracon LLC
- Amphenol Antcom
- Alps Alpine Co., Ltd.

Market Opportunities and Future Outlook
A key whitespace for chip antenna suppliers is multi-radio, multi-band endpoints that need repeatable RF performance without bespoke antenna engineering, particularly where certification-ready modules help shorten OEM product cycles. Wi-Fi 6E reference platforms and pre-certified module approaches (for example, Murata integrating Wi-Fi 6E/BLE modules with defined chip-antenna footprints) support opportunities for catalog antennas and matching-network ecosystems that maintain stable isolation across 2.4/5/6 GHz in space-constrained appliances and gateways.
Another opportunity area is automotive-grade connectivity and positioning, where qualification and reliability requirements raise entry barriers and reward suppliers with AEC-Q200 capable designs and tighter process traceability. The market also points to an adjacent higher-frequency integration frontier: the IEEE heterogeneous integration roadmap and 2026 peer-reviewed research on CMOS-compatible tunable on-chip antenna structures (including ferroelectric HZO varactors and ultra-wideband leaky-wave concepts) reflect ongoing R&D efforts that could affect how antenna functions are partitioned between discrete chip antennas, in-package implementations, and more monolithic solutions at very high frequencies.
Recent Industry Developments in Chip Antenna Market
- February 2026: Yageo Group introduced new antennas targeting higher integration density, including a 2x2 MIMO Wi-Fi 6E/7 antenna and tri-band L1/L2/L5 GNSS antennas for timing use cases. The launch expands its portfolio toward multi-antenna, higher-frequency designs where RF isolation and compact mechanical integration influence supplier selection.
- November 2025: Johanson Technology released the 7987AT45A0200001E, an 8 GHz directional ceramic chip antenna designed for UWB applications. This adds a higher-frequency option for short-range ranging and localization designs and supports OEM migration toward UWB-enabled device platforms.
- August 2024: Johanson Technology highlighted integration of its chip antennas into i-SYST BLE modules (BLYST series) built on Nordic Semiconductor SoCs for IoT designs. The module-level integration underscores the shift toward turnkey, validated RF building blocks that reduce antenna tuning burden for smaller device makers.


Chip Antenna Market Report Scope and Research Methodology
Market Definition and Coverage
This market covers revenue generated from chip antennas mounted on device circuit boards, used to support short-range wireless connectivity in electronics and connected equipment. The sizing reflects sales of the antenna component itself, counted at the point it is supplied into OEM and EMS build cycles.
Scope exclusions: It excludes antenna-in-package solutions, PCB trace antennas, and external antenna formats such as patch, FPC, or stamped metal antennas.
Segments Covered in This Report
- By Type
- LTCC (Low-Temperature Co-fired Ceramic) Chip Antenna
- Dielectric Chip Antenna
- Printed PCB-Embedded Chip Antenna
- By Application
- WLAN/Wi-Fi
- Bluetooth/BLE
- Dual-Band/Multi-Band
- GPS/GNSS
- LPWAN (NB-IoT, LoRa, Sigfox)
- By End-User Industry
- Automotive
- Consumer Electronics
- Healthcare and Medical Devices
- IT and Telecommunications Infrastructure
- Industrial and Retail IoT
- Smart Grid and Smart Home
- By Geography
- North America
- United States
- Canada
- Mexico
- South America
- Brazil
- Argentina
- Rest of South America
- Europe
- Germany
- France
- United Kingdom
- Italy
- Spain
- Nordics
- Rest of Europe
- Middle East
- GCC
- Israel
- Turkey
- Rest of Middle East
- Africa
- South Africa
- Nigeria
- Rest of Africa
- Asia-Pacific
- China
- Japan
- South Korea
- India
- ASEAN
- Rest of Asia-Pacific
- North America
Data Sources, Market Sizing, and Validation
Desk Research
Desk work started with mapping where chip antennas are used and how volume shifts across major device categories, then checking how technology changes affect pricing. Public sources were used to anchor the demand pool and mix shifts, including FCC equipment authorization databases, ITU spectrum and telecom indicators, IEEE and other peer reviewed RF publications, UN Comtrade trade statistics, and customs or tariff schedules that help interpret antenna-related shipments.
We also reviewed company filings and investor presentations for product positioning and capacity commentary, along with industry association pages and reputable press for timing of platform transitions such as Wi-Fi generations and GNSS adoption. A paid subscription for company financials and intelligence and a patent database were used selectively to validate product roadmaps and cross-check manufacturing footprints. These desk sources are not exhaustive, and we used other public references for data collection, validation, and research clarification.
Primary Interviews and Surveys
Primary work focused on interviews and short surveys with component manufacturers, module integrators, OEM procurement teams, and a few channel and distribution participants who see ASP movement early. Because this is a global supply chain, inputs were balanced across APAC, EMEA, and the Americas to verify adoption timing, confirm attach rates by device type, and stress-test realistic price erosion assumptions that desk sources cannot fully capture.
Table below summarizes the distribution of fieldwork respondents by company type, role, and region.
Distribution of primary research fieldwork respondents
| Company type | Respondent position | Region |
|---|---|---|
| Top tier: 35% | CXOs: 14% | APAC: 43% |
| Mid tier: 43% | Functional/Unit leaders: 28% | EMEA: 35% |
| Smaller Players: 22% | Managers: 58% | Americas: 22% |
Market-Sizing & Forecasting
The core model uses a top-down approach where device production and connectivity feature penetration are used to reconstruct the annual demand pool for chip antennas, which is then converted into value using blended ASPs. To keep totals realistic, we check against selective bottom-up approximations by sampling key device categories, applying typical antennas-per-device where relevant, and validating price bands through channel checks and supplier feedback.
Inputs that matter in this market include smartphone and wearable shipment trends, IoT module attach rates, the mix shift across Bluetooth, Wi-Fi, GNSS, and LPWAN use cases, average antennas-per-device as designs move to multi-band, and observed ASP erosion linked to ceramic material costs and process yields. Where bottom-up inputs were not available for smaller niches, we filled gaps using proxy devices and conservative penetration ranges, then pressure-tested the outcome with experts.
For forecasting, we use scenario analysis to reflect uncertainty in consumer electronics cycles and IoT rollout speed, with assumptions refined using interview consensus on design wins and refresh timelines. The forecast path is then aligned with visible technology transitions, such as newer Wi-Fi standards and growth in connected medical and industrial devices.
Data Validation & Update Cycle
Validation is done by comparing the modeled market value against independent signals, including device shipment baselines, trade flow direction, and the implied unit-to-revenue relationship for major application clusters. Outliers are reviewed, and when a variance cannot be explained by mix or pricing, we re-check inputs and re-contact a small set of respondents to confirm what changed.
Before sign-off, the model goes through a multi-step analyst review that includes consistency checks across regions, years, and application mixes, followed by a final pass for currency timing and rounding logic. Reports are refreshed annually, and interim updates are triggered when material events occur, such as major standard shifts, supply disruptions, or sharp price movements. Right before delivery, an analyst performs a fresh pass so the view reflects the latest available data.
Mordor Intelligence's Chip Antenna Market Size Compared Against Other Published Estimates
Published market values for chip antennas can differ even when they appear to describe the same scope, because the product boundary is easy to stretch and the pricing story changes quickly in wireless device supply chains. Differences usually come from what is counted as a chip antenna, which years are treated as the base, and how ASP declines are applied across fast moving wireless applications.
Antenna-in-package solutions sit outside Mordor Intelligence's scope here, and that single exclusion can pull totals away from estimates that bundle chip antennas together with integrated RF front-end packaging. Some sources also treat PCB trace antennas and external formats as part of the same spend, or they apply aggressive unit growth without checking whether multi-band designs change antennas-per-device. Currency timing and refresh cadence matter too, since small shifts in pricing assumptions can compound across a high growth forecast window.
Benchmark comparison
| Source | Market Size | Gaps in Research Methodology |
|---|---|---|
| Mordor Intelligence | USD 2.49 B (2026) | |
| Global Publisher A | USD 4.05 B (2025) | The scope appears broader, with market framing that commonly groups chip antennas with adjacent antenna formats and sometimes integrated packages, which inflates the addressable revenue versus a component-only view. |
| Industry Publisher B | USD 2.93 B (2025) | Uses a different base year and forecast window and may apply higher starting ASPs across major applications, which lifts the near-term value even when growth drivers are similar. |
Overall, the spread is mainly explained by what is included in the product definition and how the base year price level is set before forecasting. By keeping inputs tied to a clear device demand pool, realistic attach rates, and verifiable ASP ranges, the sizing stays traceable and repeatable when assumptions are revisited.


Key Questions Answered in the Report
What is the current value of the chip antenna market?
The chip antenna market size is USD 2.49 billion in 2026 and is forecast to reach USD 5.88 billion by 2031.
Which region leads the chip antenna market?
Asia Pacific holds the top position with 45.60% revenue share in 2025 and a projected 19.48% CAGR through 2031.
Why are LTCC antennas so dominant?
LTCC offers thermal stability and low loss at millimeter-wave frequencies, giving it 57.35% chip antenna market share in 2025, especially in automotive and high-frequency telecom equipment.
Which application segment is growing the fastest?
Which application segment is growing the fastest? GPS/GNSS applications are expanding at a 20.92% CAGR to 2031 as precise location services proliferate across automotive, drone, and precision-farming devices.
How does intellectual-property litigation affect suppliers?
Ongoing fractal-geometry patent disputes can delay product launches and elevate licensing costs, reducing supplier diversity and nudging prices upward for multi-band antenna designs.
What technological trend is reshaping smart appliances?
Wi-Fi 6E reference designs now mandate tri-band chip antennas, creating fresh demand for broadband ceramic parts that maintain low return loss across 2.4, 5, and 6 GHz bands.
Page last updated on:


 Your data is secure and never sold or shared.


