5G mmWave Market Size and Share
Market Overview
| Study Period | 2020 - 2031 |
|---|---|
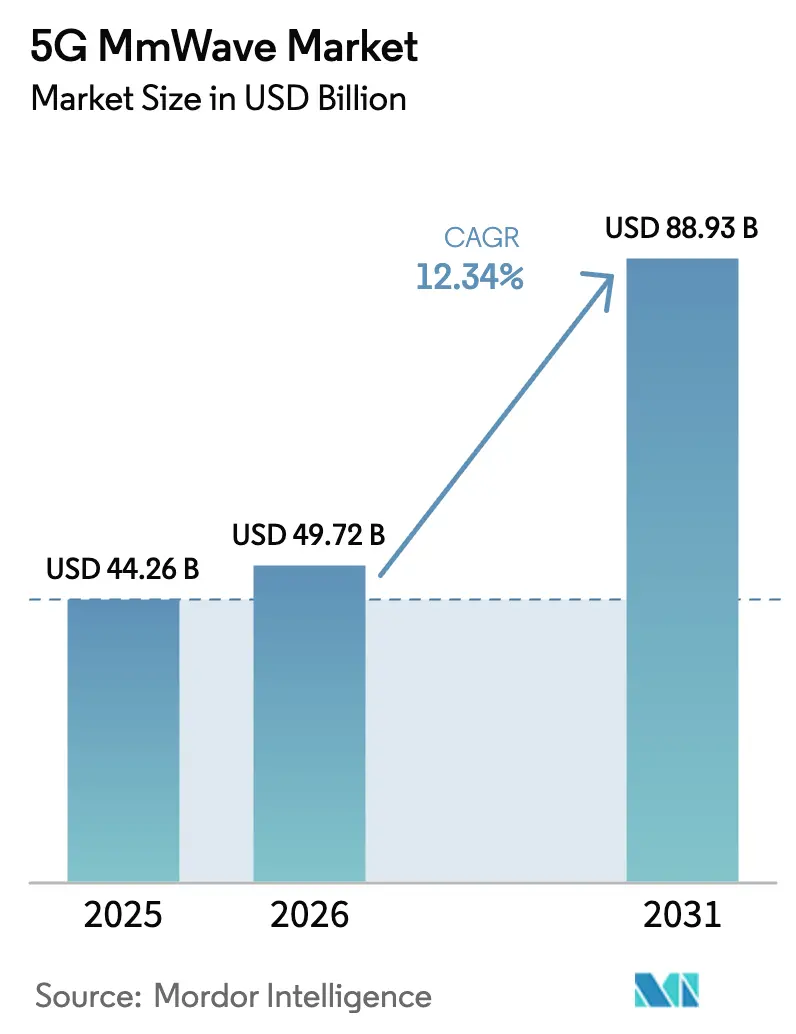
| Market Size (2026) | USD 49.72 Billion |
| Market Size (2031) | USD 88.93 Billion |
| Growth Rate (2026 - 2031) | 12.34% CAGR |
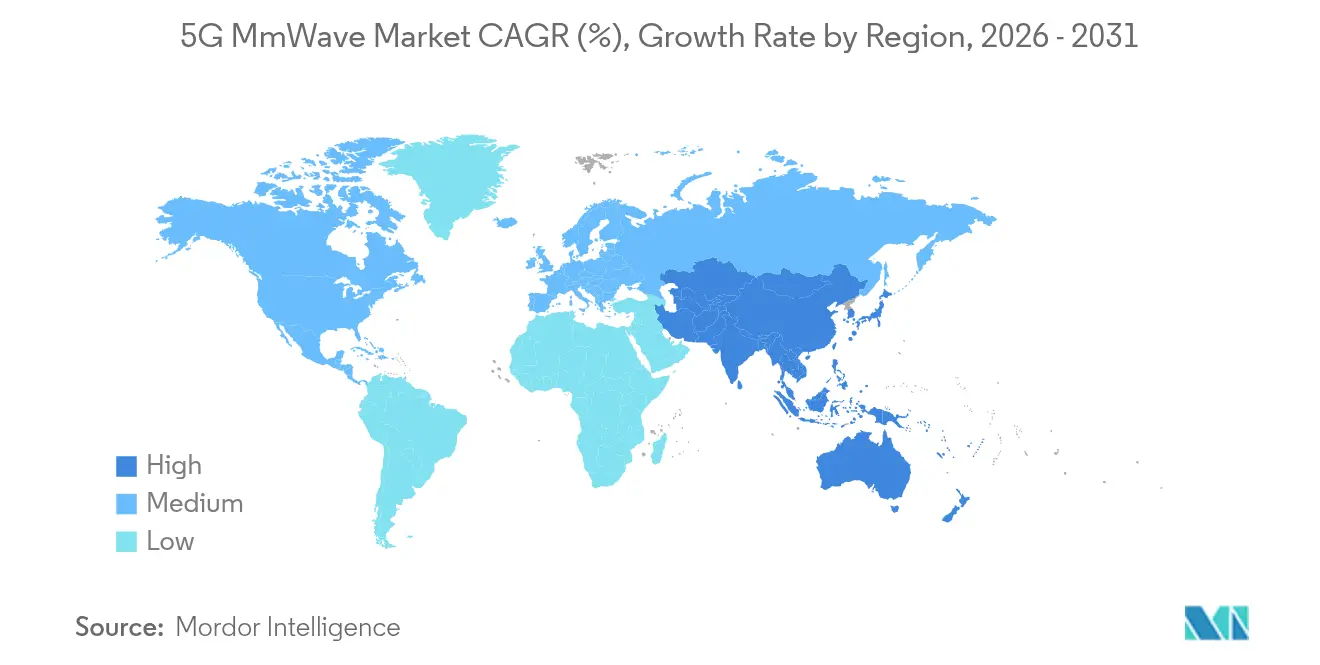
| Fastest Growing Market | Asia Pacific |
| Largest Market | Asia Pacific |
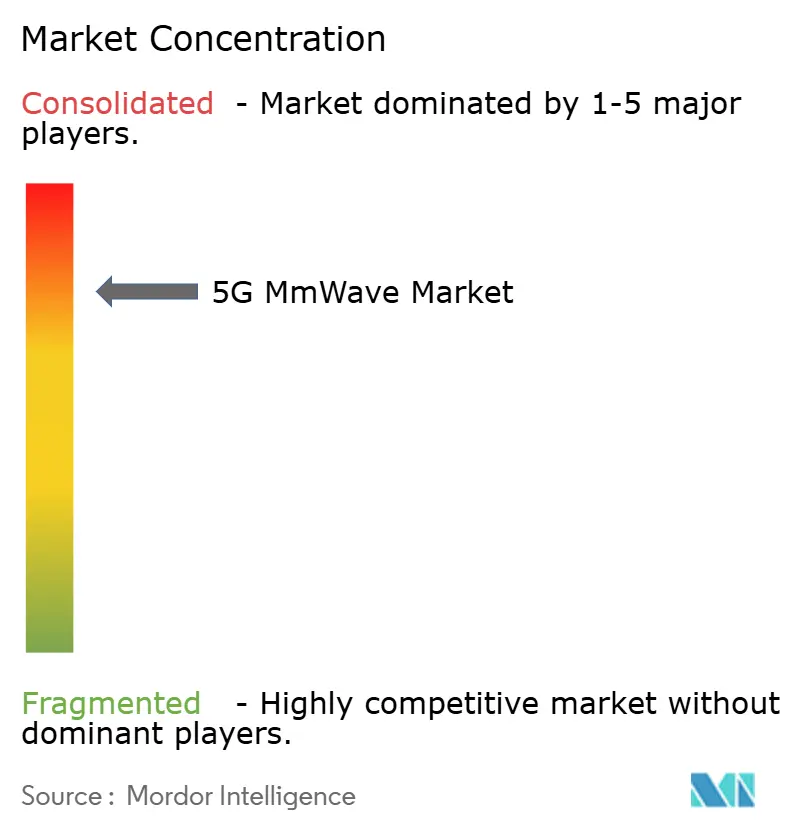
| Market Concentration | High |
Major Players *Disclaimer: Major Players sorted in no particular order Image © Mordor Intelligence. Reuse requires attribution under CC BY 4.0. | |
5G mmWave Market Analysis by Mordor Intelligence
5G MmWave market size in 2026 is estimated at USD 49.72 billion, growing from 2025 value of USD 44.26 billion with 2031 projections showing USD 88.93 billion, growing at 12.34% CAGR over 2026-2031.
Robust spectrum-liberalization programs covering the 26 GHz, 28 GHz, and 39 GHz bands have moved the technology from pilot trials to city-wide roll-outs that deliver peak downlink speeds above 6 Gbps in select commercial zones. Operators now view dense mmWave cells as the primary remedy for urban capacity congestion, while AI-enabled beamforming resolves previously prohibitive non-line-of-sight constraints. Asia Pacific’s tightened policy coordination, including China’s USD 3 billion 5G-Advanced upgrade cycle, lowers per-site costs, speeds component sourcing, and consolidates manufacturing scale. However, gallium- and germanium-export restrictions expose supply-chain vulnerabilities that elevate device pricing and spur regional diversification of semiconductor fabrication. Competitive dynamics stay balanced because infrastructure incumbents still command integration know-how, while specialist chip firms and open-radio software vendors continue to capture adjacency revenue as the 5G mmWave market broadens into healthcare, transportation, and smart-factory use cases.
Key Report Takeaways
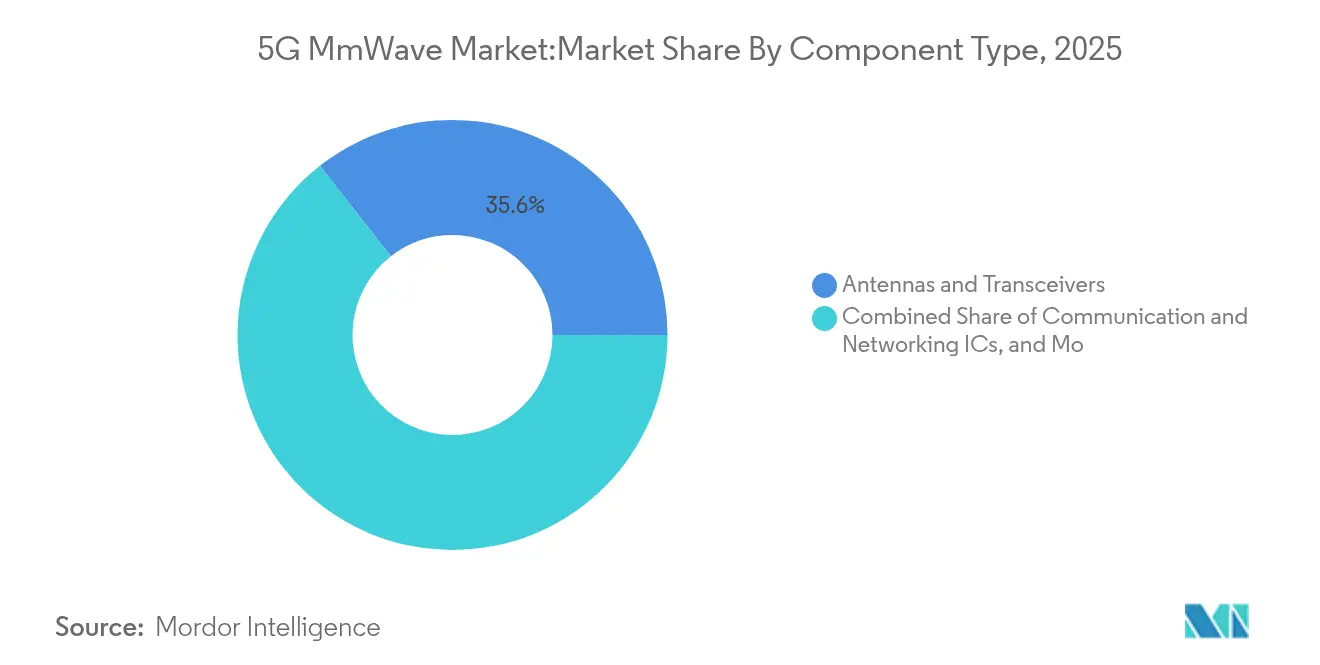
- By component, antennas and transceivers led the 5G mmWave market with a 35.58% share in 2025; communication and networking ICs are expanding at the fastest rate, with a 13.92% CAGR through 2031.
- By product, telecommunication equipment accounted for 47.25% of the 5G mmWave market size in 2025 and is projected to advance at a 13.32% CAGR.
- By frequency, the 24-57 GHz V-band held 51.35% of the 5G mmWave market size in 2025, whereas the 95-300 GHz W/D-bands recorded the highest 15.76% CAGR.
- By application, ultra-HD video streaming captured 31.60% of 2025 revenue, while augmented/virtual reality is rising at a 16.85% CAGR.
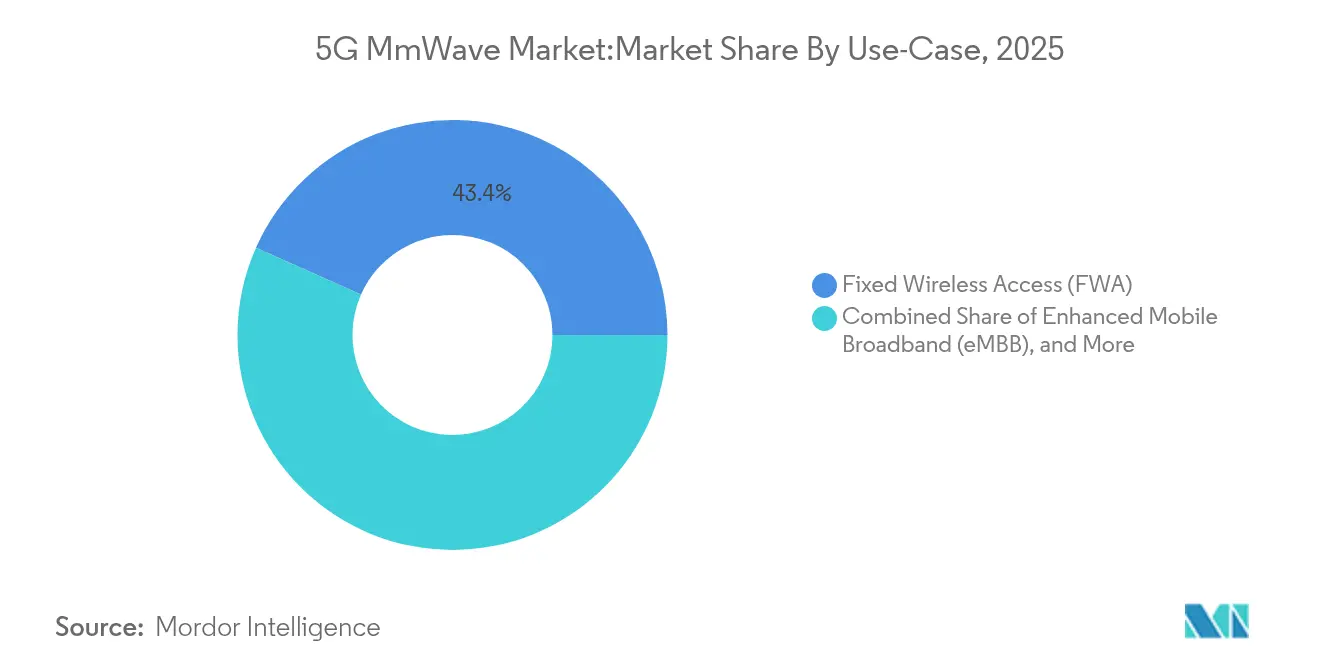
- By use case, fixed wireless access commanded 43.35% of the 5G mmWave market in 2025; ultra-reliable low-latency communications showed the fastest 18.44% CAGR.
- By end-user industry, telecommunications operators led with 48.40% of 5G mmWave market share in 2025, while healthcare and life sciences grew at 15.90% CAGR.
- By geography, Asia Pacific held 39.45% share in 2025 and is the quickest-growing region with a 18.46% CAGR.
Note: Market size and forecast figures in this report are generated using Mordor Intelligence’s proprietary estimation framework, updated with the latest available data and insights as of 2026.
Global 5G mmWave Market Trends and Insights
Drivers Impact Analysis*
| Driver | (~) % Impact on CAGR Forecast | Geographic Relevance | Impact Timeline |
|---|---|---|---|
| Exploding mobile data traffic in dense urban hotspots | +2.20% | Global megacities | Short term (≤ 2 years) |
| Spectrum auctions unlocking 26/28/39 GHz bands | +2.80% | North America, Europe, Asia Pacific | Medium term (2–4 years) |
| Rapid roll-out of 5G fixed wireless access (FWA) | +2.10% | India, Australia, US rural markets | Short term (≤ 2 years) |
| AI-driven beam-forming chipsets enabling NLOS links | +2.70% | US, China, South Korea | Medium term (2–4 years) |
| Glass-substrate antenna arrays lowering handset BOM | +2.40% | US, China, Europe smartphone OEM clusters | Medium term (2–4 years) |
| AI-driven beam-forming chipsets enabling NLOS links | +2.70% | US, China, South Korea | Medium term (2–4 years) |
| Source: Mordor Intelligence | |||
Exploding Mobile Data Traffic in Dense Urban Hotspots
Rush-hour consumption now crosses 10 Gbps per square kilometre in megacities such as Seoul, Tokyo, and New York. Legacy macro cells saturate even after capacity-enhancing code upgrades, compelling carriers to add thousands of 5G mmWave small cells to lamp posts, kiosks, and building façades. Deutsche Telekom’s production shop floor achieved 4 Gbps downloads with less than 4 ms latency, enabling AI-driven robotic arms to perform real-time quality inspections. The improved experience supports 8K live sports streaming and mixed-reality overlays in stadiums, where spectators pay premium ticket prices that include guaranteed multi-gigabit service tiers. Such monetisation momentum adds recurring revenue to the 5G mmWave market and encourages CapEx discipline despite high site densities.
Spectrum Auctions Unlocking 26/28/39 GHz Bands
Since 2024, global regulators have raised more than USD 80 billion by licensing mmWave blocks, often bundling enterprise innovation zones that enable factories to deploy local networks without national coverage obligations. The US 37 GHz co-equal sharing framework sets a reference for dynamic access between federal and commercial entities, unlocking capacity that was previously reserved for defense. In Europe, Germany’s industry-campus allocations encourage private 5G mmWave market installations within automotive plants, which now stream 4K machine-vision feeds to edge servers. Flexible permitting quickens ROI by matching spectrum supply to granular industrial demand.
Rapid Roll-out of 5G Fixed Wireless Access (FWA)
Operators exploit FWA to deliver fibre-like speeds at 30-50% lower cost, bypassing right-of-way trenching. Reliance Jio’s AirFiber service already covers all top-10 Indian metros, signing 2.8 million households by September 2024. In Australia, an Ericsson-NBN-Qualcomm field test sustained gigabit throughput 14 kilometres from the base station using 400 MHz at 28 GHz. This performance expands the addressable market for 5G mmWave in low-density suburbs and rural areas, shielding carriers from fiber rollout delays and enhancing average revenue per user.
AI-driven Beam-forming Chipsets Enabling NLOS Links
Qualcomm’s eighth-generation modem integrates an AI coprocessor that predicts obstacles and re-steers beams, achieving peak speeds of 12.5 Gbps without power drain penalties. Automotive OEMs utilize this feature to maintain uninterrupted infotainment streams through tunnels, while hospitals trial remote surgery across 1,000 km links with a round-trip delay of less than 50 ms. As a result, non-line-of-sight limitations shrink, and enterprise decision-makers green-light more 5G mmWave market deployments in confined industrial halls and densely built downtown corridors.
Restraints Impact Analysis*
| Restraint | (~) % Impact on CAGR Forecast | Geographic Relevance | Impact Timeline |
|---|---|---|---|
| High CAPEX of ultra-dense small-cell grids | -3.60% | Global, high-labour-cost markets | Short term (≤ 2 years) |
| GaN power-amp supply bottlenecks | -4.10% | China, Taiwan-centric supply | Medium term (2–4 years) |
| Poor penetration and rain-fade propagation limits | -2.30% | Tropical monsoon zones (APAC, LATAM); coastal EMEA | Medium → Long term (3–5+ years) |
| Municipal aesthetic rules curbing rooftop sites | -1.90% | Europe & North America, dense NIMBY municipal zones | Medium term (2–4 years) |
| Source: Mordor Intelligence | |||
High CAPEX of Ultra-dense Small-cell Grids
A 5G mmWave market small cell can cost USD 10,000–50,000 before installation. Fibre backhaul adds as much as 30% in core urban zones, and HVAC retrofits inflate rooftop rents when power dissipates exceed 1 kW per site. Shared-infrastructure consortia lower expenses by 40%, but intricate co-siting rules for thermal and RF emissions slow municipal approvals, extending payback horizons in North American and Western European metropolitan areas.
GaN Power-Amp Supply Bottlenecks
Gallium nitride’s wide-band-gap efficiency makes it indispensable for mmWave PAs; yet 95% of raw gallium imports into the US come from China. July 2024 export controls drove spot prices up 150%, prompting Infineon to fast-track a EUR 2.4 billion German wafer plant scheduled for 2027. Component shortages ripple across smartphones and base stations, diluting near-term shipment volumes and trimming the 5G mmWave market forecast by 4.1 percentage points.
*Our forecasts treat driver/restraint impacts as directional, not additive. The impact forecasts reflect baseline growth, mix effects, and variable interactions.
Segment Analysis
By Component Type: Antenna Innovation Drives Market Evolution
Antennas and transceivers secured 35.58% of the 5G mmWave market in 2025, underscoring their gatekeeper role in beam management. Communication and networking ICs are expected to surge at a 13.92% CAGR due to on-chip AI, which simplifies calibration, reduces board counts, and mitigates thermal loss. Interface chips and RF filters keep steady momentum as carriers retrofit legacy macro sites. Imaging modules unlock autonomous-vehicle perception layers by blending mmWave depth sensing with lidar and camera feeds.
Glass-substrate arrays promise to reduce handset bill-of-materials by up to 30% while increasing gain; TSMC, Intel, and Samsung plan to initiate volume runs by 2026. Multi-function packages that fuse PA, LNA, and phase-shifters in a single stack shrink footprint, enhancing reliability and winning design slots in the latest smartphones. Despite material bottlenecks, the 5G mmWave market component ecosystem stays vibrant as suppliers diversify gallium inputs and invest in wafer-level RF testing lines.


By Product: Telecommunication Equipment Dominance Reflects Infrastructure Focus
Telecommunication equipment comprised 47.25% of the 5G mmWave market size in 2025 and is expected to expand at a 13.32% CAGR through 2031, driven by operators’ densification cycles and campus-network contracts. Scanning systems fill the security and industrial analytics niches, utilizing mmWave technology to detect micro-gestures and track high-speed conveyor belts. Radar and satellite terminals serve the aerospace and defence sectors, where mmWave’s small antenna aperture fits cramped payload envelopes.
Nokia signed 55 new private-5G customers in 2024, while Ericsson’s enterprise wireless revenue rose 17%, showing vendor cross-selling strength. Customers prefer turnkey bundles that integrate edge compute, RAN, and device certification into a managed service. This one-stop model advances the 5G mmWave market, as enterprises lacking RF expertise outsource connectivity in the same way they have adopted the public cloud.
By Frequency Band: V-Band Leadership Faces W/D-Band Challenge
The V-band (24-57 GHz) held 51.35% 5G mmWave market share in 2025, owing to early spectrum availability and mature radio modules. The E-band (57-95 GHz) addresses rooftop backhaul and campus links requiring 20 Gbps pipes. W/D-bands (95-300 GHz) boast a 15.76% CAGR following NTT's demonstration of a 280 Gbps single-carrier stream at 300 GHz.
V-band maintains an edge in foliage-heavy suburbs, while E-band serves as the sweet spot for medium-haul microwave, where fibre is impractical. Semiconductor R&D now centers on integrating W-band PAs with CMOS logic, thereby trimming costs and power. As these breakthroughs mature, high-density indoor kiosks, data-centre interconnects, and untethered VR gaming will propel additional 5G mmWave market demand.
By Application: AR/VR Growth Challenges, Video Streaming Dominance
Ultra-HD video streaming generated 31.60% of 2025 revenue, reflecting subscribers’ appetite for 8K sports and real-time content sharing. Augmented/virtual reality is projected to grow at a 16.85% CAGR as enterprises adopt digital twins for training, maintenance, and remote collaboration. Industry 4.0 automation leverages deterministic latency for closed-loop control, while transport connectivity facilitates the movement of terabytes of sensor data among vehicles, roads, and cloud instances.
Meta’s mmWave-based face-tracking patent improves avatar realism, bolstering adoption among industrial designers. Real-time surveillance cameras utilize the same networks, enabling multi-layer analytics in crowded venues. Such variety cushions the 5G mmWave market against saturation from a single application and keeps traffic growth distributed across both consumer and enterprise domains.
By Use-Case: URLLC Growth Signals Industrial Transformation
Fixed wireless access captured 43.35% of the 5G mmWave market in 2025, thanks to simplified deployment and hybrid fixed-mobile billing. Ultra-reliable low-latency communications are projected to rise at a 18.44% CAGR, underpinning robotics, remote surgery, and cooperative-vehicle control. Enhanced mobile broadband continues to monetize smartphone demand, while massive machine-type communications support high sensor densities in utilities and smart cities.
URLLC’s breakthrough came when surgeons in Tokyo assisted their peers in Osaka via mmWave links, maintaining latency of less than 50 ms during microsuture procedures. Such proof reduces risk perception among hospital administrators and accelerates sectoral spending, adding resilience to the overall 5G mmWave market trajectory.
By End-User Industry: Healthcare Acceleration Challenges, Telecom Dominance
Telecommunications operators retained a 48.40% share in 2025, yet healthcare and life sciences are expanding at a 15.90% CAGR. Automotive manufacturers rely on mmWave V2X modules for cooperative perception, while aerospace and defense agencies integrate compact mmWave radios for satellite communications and electronic warfare payloads. Media houses deploy portable mmWave backpacks to stream uncompressed 8K content from outdoor events.
Oulu University Hospital’s private 5G grid utilizes mmWave for real-time imaging, reducing CT-scan upload times from 90 seconds to 9 seconds. The result: patient throughput increases and surgeons access cloud analytics instantly. Public-safety outfits contract dedicated slices on shared infrastructure, guaranteeing bandwidth during emergencies. This end-user diversification enlarges the 5G mmWave market beyond cyclical operator CapEx to steadier mission-critical verticals.
Geography Analysis
Asia Pacific accounted for 39.45% of the 5G mmWave market size in 2025 and is growing at a 18.46% CAGR. China alone upgraded 400,000 macro sites to 5G-Advanced by mid-2025, funnelling USD 3 billion into mmWave-ready hardware. Japan’s NTT DOCOMO commercialised 6.6 Gbps NR-DC handsets that aggregate sub-6 and 28 GHz spectra. South Korea opened private-network licenses for 35 conglomerates, enabling Samsung and Hyundai to digitize their factories end-to-end. India’s FWA subscriber base is forecast to hit 30 million by 2027, confirming mmWave viability in price-sensitive regions.
FCC auctions have raised USD 80 billion since 2024, and Verizon’s MDU FWA blueprint shows how to retrofit existing apartment wiring fast. T-Mobile’s network slicing for first responders across 29 cities offers guaranteed QoS without extra charges. Canada’s consultation on 26/38 GHz signals future release, while Mexico’s cross-border spectrum planning aligns with US-based equipment ecosystems.
Ofcom allocated 6.25 GHz for city-scale permits, and German regulators reserved 26 GHz blocks for factories that require deterministic latency. France’s Istres pilot merges mmWave with Wi-Fi for public-safety video and smart-parking. Rome’s EUR 97.7 million roll-out finances 2,200 small cells ahead of Jubilee 2025, demonstrating municipal willingness to underwrite communal backhaul for tourism and security.

Competitive Landscape
The 5G mmWave market is moderately concentrated, with Ericsson, Nokia, and Huawei supplying turnkey networks, while Qualcomm, Samsung, and Intel dominate chipset IP. Ericsson holds more than 60,000 standard-essential patents and monetises licences for each activated handset. Qualcomm’s Snapdragon X85 integrates AI beam management, raising device efficiency by 20% amid thermal limits. Samsung’s 3nm gate-all-around process positions it for low-power mmWave SoCs, providing handset OEMs with extra battery headroom.
Equipment makers now partner with hyperscale clouds, including Azure, AWS, and Google Cloud, to bundle edge compute and 5G mmWave private RAN within factory campuses. Open-RAN start-ups release software-defined radios that slash CapEx, but must still certify compliance with carrier-grade performance. Neutral-host tower companies build lampposts that accommodate three-operator antennas, cutting urban densification costs by one-third. Patent portfolios are expanding as vendors rush to secure foundational claims in W-band duplexers, ensuring royalty streams when sub-terahertz devices are commercialized later in the decade.
5G mmWave Industry Leaders
Qualcomm
Ericsson
Verizon
Huawei
NXP Semiconductors
- *Disclaimer: Major Players sorted in no particular order

Recent Industry Developments
- June 2025: NTT Corporation, NTT Innovative Devices, and Keysight demonstrated 280 Gbps at 300 GHz, validating sub-terahertz use-cases.
- June 2025: Ericsson activated a private 5G network in Istres, France, improving public services and safety.
- May 2025: NTT DOCOMO formed NTT DOCOMO GLOBAL to export advanced mobile tech to Southeast Asia and North America.
- March 2025: Ericsson, NBN Co, and Qualcomm extended mmWave FWA coverage to 14 km with gigabit speeds.


Research Methodology Framework and Report Scope
Market Definitions and Key Coverage
Our study frames the 5G millimeter-wave market as all hardware, software, and service revenues that rely on licensed or lightly licensed spectrum above 24 GHz to deliver commercial or private 5G connectivity for fixed wireless access, enhanced mobile broadband, ultra-low-latency links, and emerging industrial use cases.
Scope exclusion: Equipment and services that operate only in sub-6 GHz 5G or legacy bands are kept outside the valuation.
Segmentation Overview
- By Component Type
- Antennas and Transceivers
- Communication and Networking ICs
- Interface Chips
- Frequency-Control and Filters
- Imaging Modules
- Other Components
- By Product
- Radar and Satellite Comms Systems
- Scanning Systems
- Telecommunication Equipment
- Other Products
- By Frequency Band
- 24 - 57 GHz (V-Band)
- 57 - 95 GHz (E-Band)
- 95 -300 GHz (W/D-Bands)
- By Application
- Real-time Surveillance Cameras
- Augmented/Virtual Reality
- Industry 4.0 Automation
- Ultra-HD Video Streaming
- Transport Connectivity
- Live Streaming
- Other Applications
- By Use-Case
- Fixed Wireless Access (FWA)
- Enhanced Mobile Broadband (eMBB)
- Massive Machine-Type Comms (mMTC)
- Ultra-Reliable Low-Latency Comms (URLLC)
- By End-User Industry
- Aerospace and Defense
- Telecommunications Operators
- Automotive and Transportation
- Healthcare and Life Sciences
- Public Safety and Emergency Services
- Media and Entertainment
- By Geography
- North America
- United States
- Canada
- Mexico
- South America
- Brazil
- Argentina
- Rest of South America
- Europe
- Germany
- United Kingdom
- France
- Italy
- Spain
- Rest of Europe
- Asia-Pacific
- China
- Japan
- South Korea
- India
- Australia
- Rest of Asia-Pacific
- Middle East
- United Arab Emirates
- Saudi Arabia
- Turkey
- Rest of Middle East
- Africa
- South Africa
- Nigeria
- Rest of Africa
- North America
Detailed Research Methodology and Data Validation
Primary Research
Mordor analysts next interviewed mobile operators, neutral-host tower firms, small-cell OEMs, RF-front-end suppliers, and spectrum economists across North America, Europe, and high-growth Asian hubs. Conversations clarified active-antenna bill-of-materials, small-cell rollout costs, typical service ARPU uplift, and adoption timelines, filling gaps left by publicly reported data.
Desk Research
We began with open datasets from bodies such as ITU, FCC, 3GPP, and national regulators that publish spectrum auctions, deployment counts, and tariff rules. Trade-group dashboards from GSMA, GSA, and the IEEE Xplore patent portal helped size device design wins and chipset tape-outs, while import-export ledgers from Volza and shipping manifests from UN Comtrade traced mmWave radio consignments. Company 10-Ks, vendor investor decks, and reputable business press added price points and contract volumes. This catalogue is illustrative; many additional public and paid references, including D&B Hoovers and Dow Jones Factiva, informed the desk phase.
A second pass aligned conflicting shipment tallies, normalized currencies to 2025 average USD, and logged spectrum caps by country so later model ratios rest on comparable baselines.
Market-Sizing & Forecasting
A top-down demand pool was first built from population-weighted data-traffic forecasts and 5G site densities, which are then split by announced mmWave spectrum allocations. Selective bottom-up cross-checks, such as sampled radio unit ASP × volumes, chipset tape-out counts, and operator capex disclosures, validated and adjusted totals. Key model variables include spectrum auction timing, small-cell cost curves, FWA household penetration, handset attach rates, and regulatory power-density limits. Multivariate regression links these drivers to historical uptake and projects the market to 2030, while scenario analysis stresses optimistic and constrained rollout paths. Assumptions are revisited where bottom-up rolls differ by more than five percent.
Data Validation & Update Cycle
Outputs flow through variance checks, senior-analyst peer review, and a final reconciliation against quarterly capex trackers. Mordor refreshes the dataset annually, triggering interim updates when spectrum awards, large vendor mergers, or material policy changes occur.
Why Mordor Intelligence's 5G Mmwave Baseline Earns Decision-Makers' Trust
Published estimates often diverge because providers choose different scopes, valuation layers, and refresh cadences.
Key gap drivers include whether services revenue is counted, how hybrid radios are treated, the currency year used for normalization, and the depth of primary validation.
Benchmark comparison
| Market Size | Anonymized source | Primary gap driver |
|---|---|---|
| USD 44.26 B (2025) | Mordor Intelligence | - |
| USD 3.03 B (2024) | Global Consultancy A | Focuses on component sales only and applies cost-plus markup without service revenue |
| USD 5.18 B (2024) | Industry Association B | Blends mmWave with sub-6 GHz devices and relies on press-release shipment figures |
| USD 3.41 B (2024) | Trade Journal C | Excludes network infrastructure and uses intermittent FX updates |
The comparison shows that Mordor's broader service-inclusive scope, dual-layer validation, and yearly refresh provide a balanced, transparent baseline that planners can replicate and trust.


Key Questions Answered in the Report
What is the current value of the 5G mmWave Market?
The 5G mmWave Market stands at USD 49.72 billion in 2026.
How quickly will the 5G mmWave Market grow by 2031?
It is forecast to expand at a 12.34% CAGR, reaching USD 88.93 billion by 2031.
Which region leads 5G mmWave deployment?
Asia Pacific holds a 39.45% share and is advancing fastest at a 18.46% CAGR.
Which component segment is growing most rapidly?
Communication and networking ICs post the highest 13.92% CAGR through 2031.
Why are gallium-nitride shortages a concern?
Export restrictions have lifted GaN prices by 150%, delaying radio shipments and trimming overall growth.
How does fixed wireless access influence adoption?
FWA delivers fibre-class speeds at a lower cost, already securing 43.35% of 5G mmWave Market revenue and accelerating subscriber uptake in suburban and rural zones.
Page last updated on:


