
Hospitality and Tourism
13th MayUnlocking Saudi Arabia’s Regional Tourism Growth Potential
5 Min Read
MICE Market is Segmented Into Event Type (Meetings, Incentives, Conferences, and Exhibitions), by Service Type (Event Planning and Management, Venue Sourcing and Management and More), by Organizer Type (Corporate, Government and Public Sector and More), by End-User Industry (IT and Telecom, Healthcare and Life Sciences and More), and by Geography. The Market Forecasts are Provided in Terms of Value (USD).
Market Overview
| Study Period | 2019 - 2030 |
|---|---|
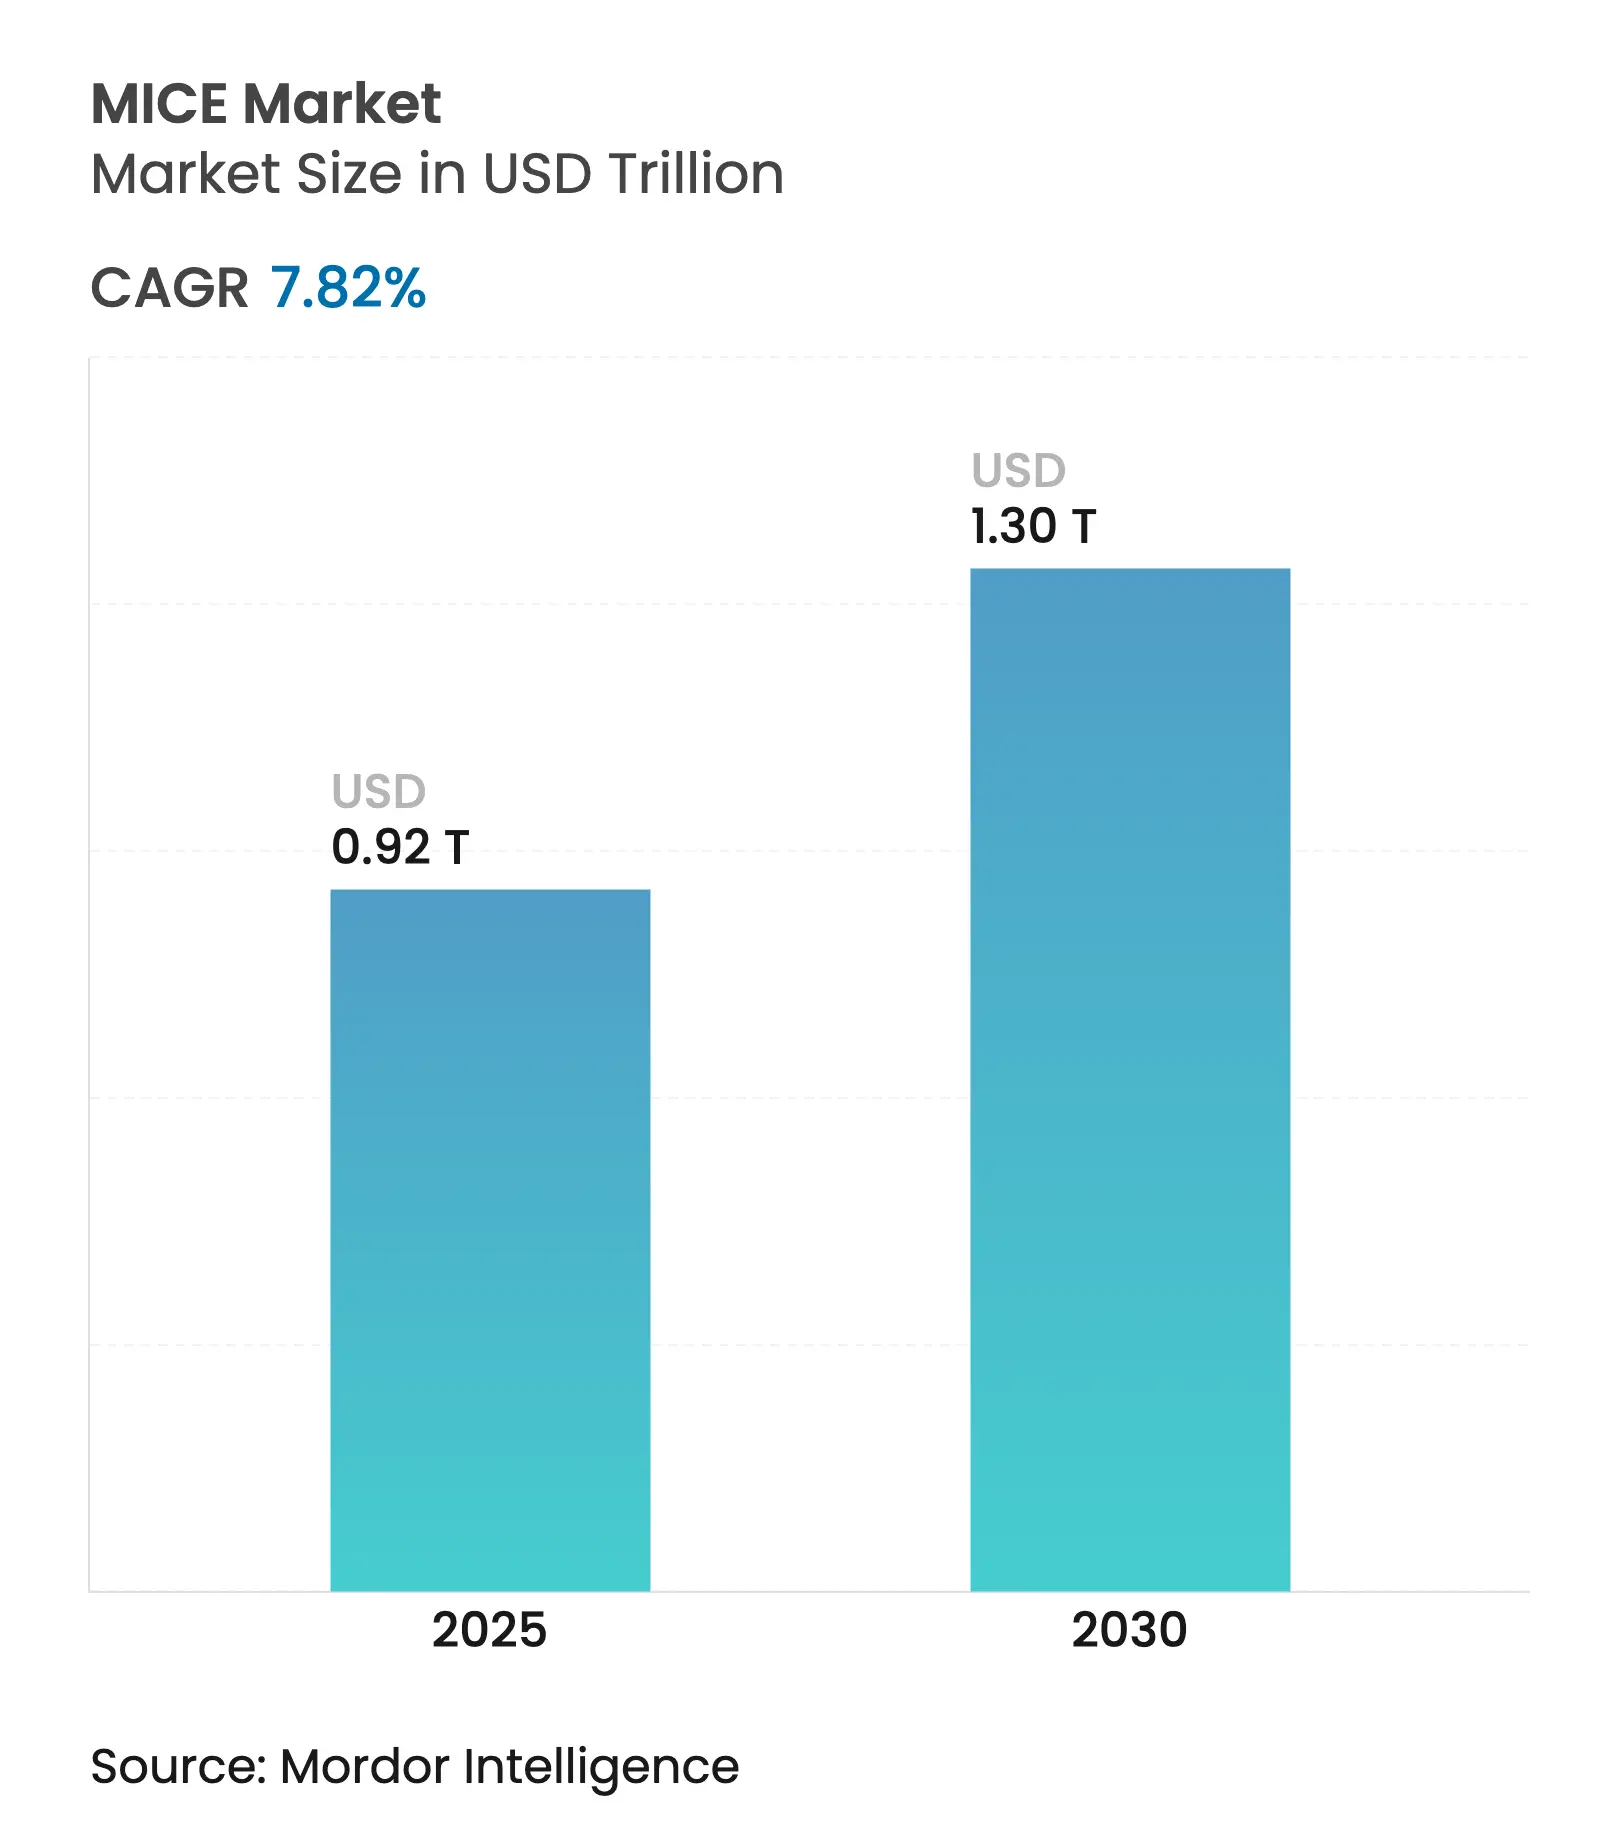
| Market Size (2025) | USD 0.92 Trillion |
| Market Size (2030) | USD 1.30 Trillion |
| Growth Rate (2025 - 2030) | 7.82 % CAGR |
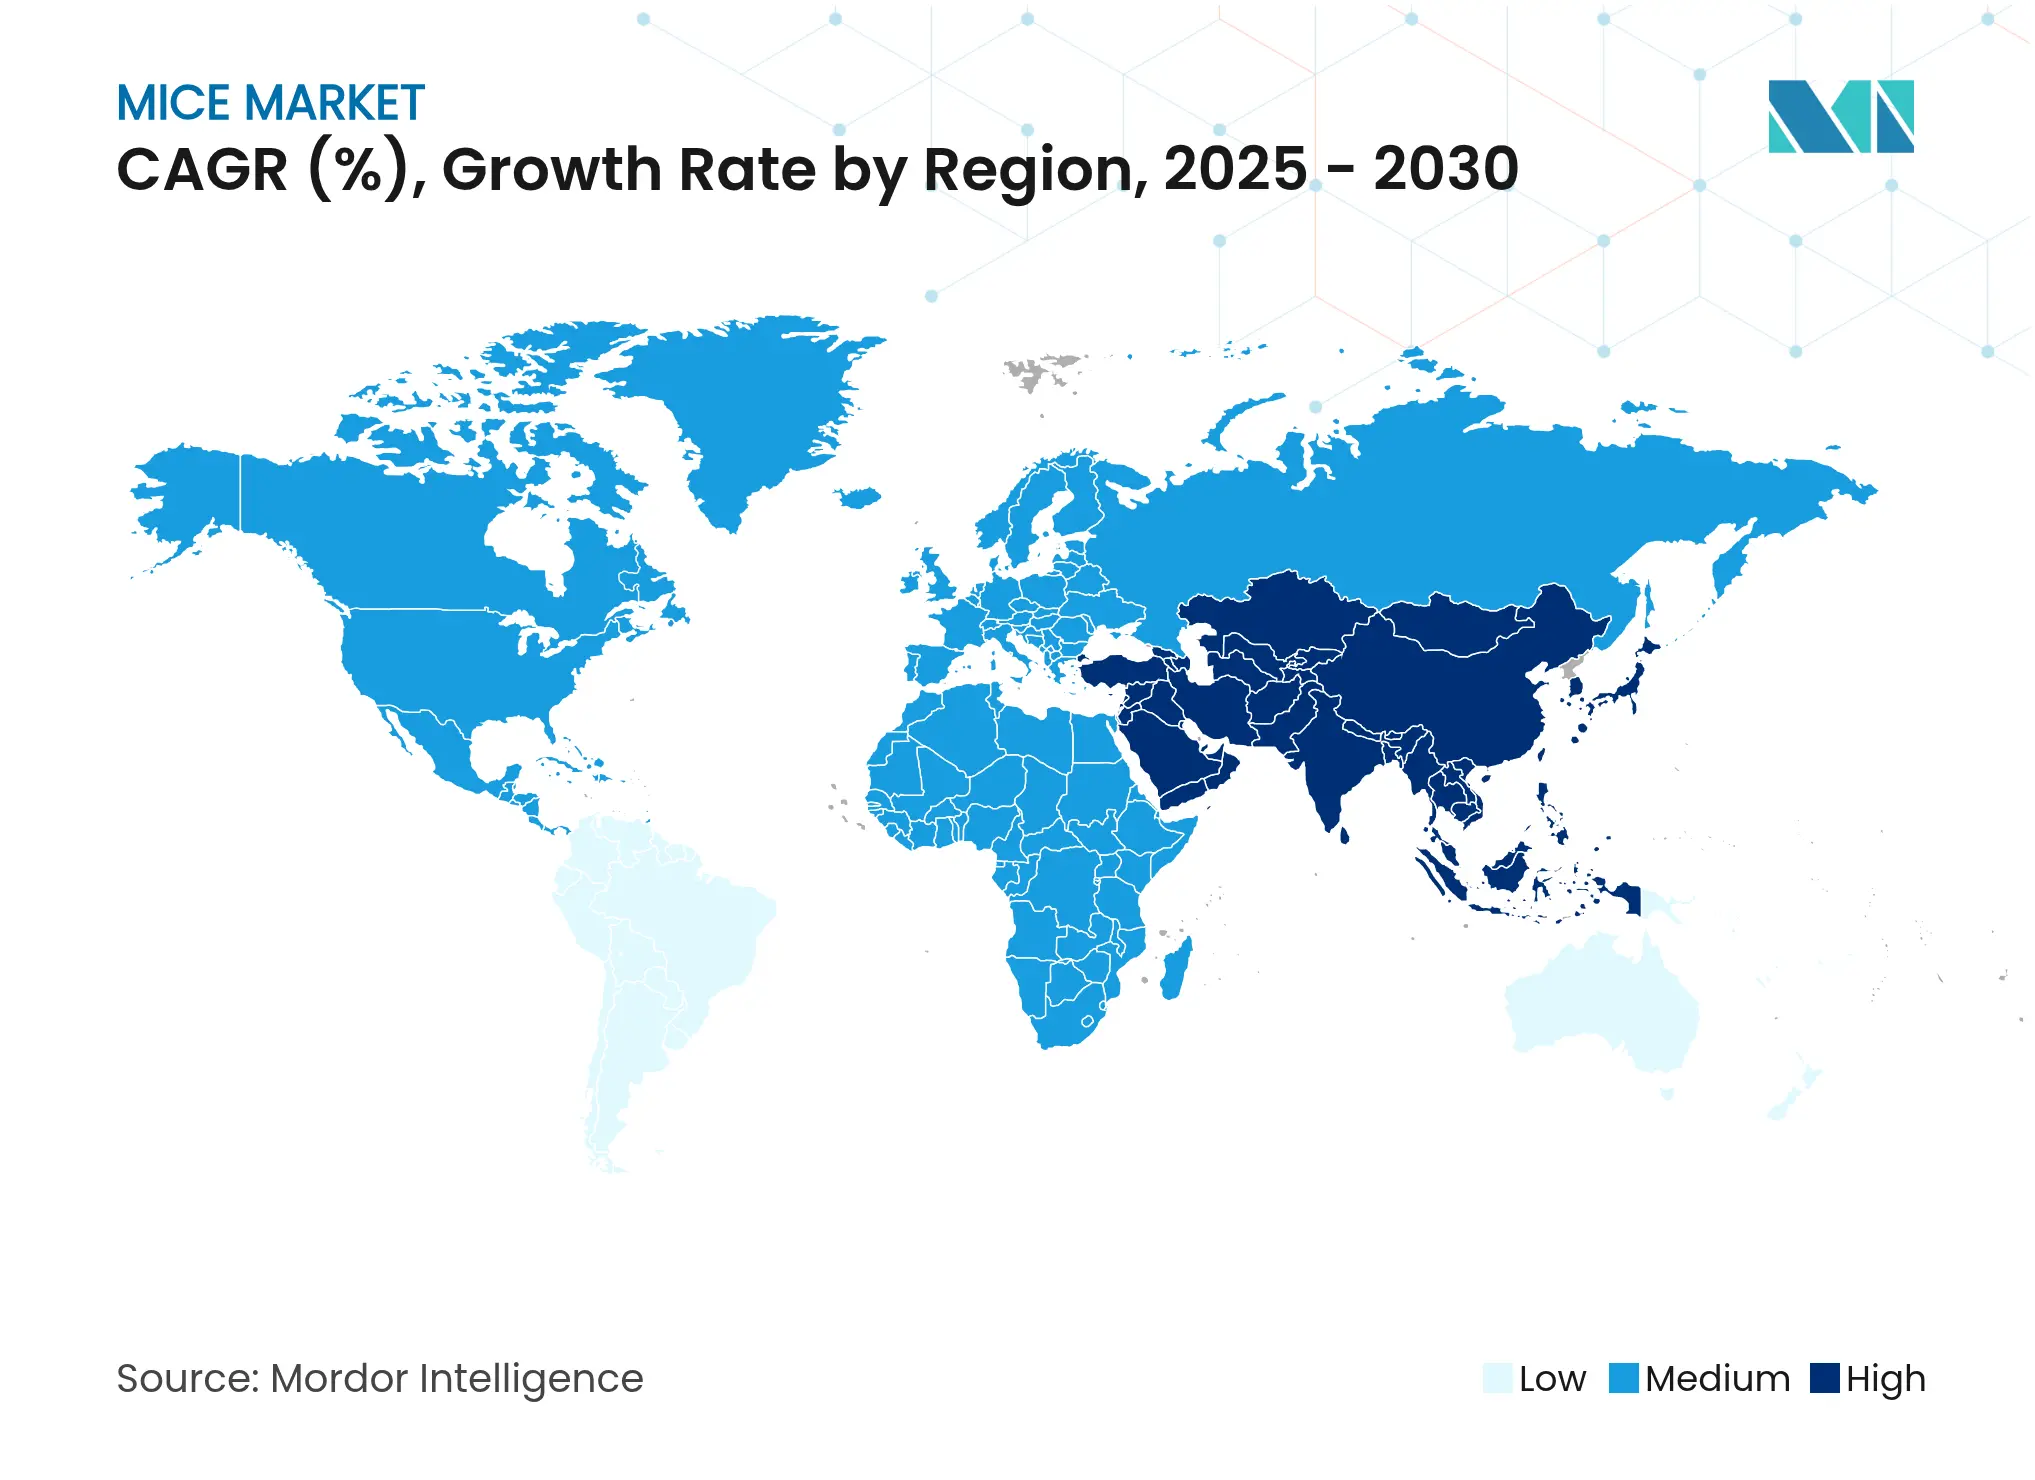
| Fastest Growing Market | Asia Pacific |
| Largest Market | Europe |
| Market Concentration | Low |
Major Players *Disclaimer: Major Players sorted in no particular order. Image © Mordor Intelligence. Reuse requires attribution under CC BY 4.0. |
Demand is propelled by the rebound in corporate travel, a pivot to hybrid formats that widen audience reach, and government investments that expand venue capacity. AI-enabled attendee matching is improving event ROI, while sustainability mandates are steering planners toward low-carbon destinations and green-certified facilities. Competitive intensity is rising as technology-focused entrants challenge established agencies, yet long-standing relationships and scale continue to give global players pricing leverage. Regional opportunity pockets are forming in secondary cities that combine modern infrastructure with cost advantages, offering planners fresh options to navigate inflationary pressures.
Key Report Takeaways
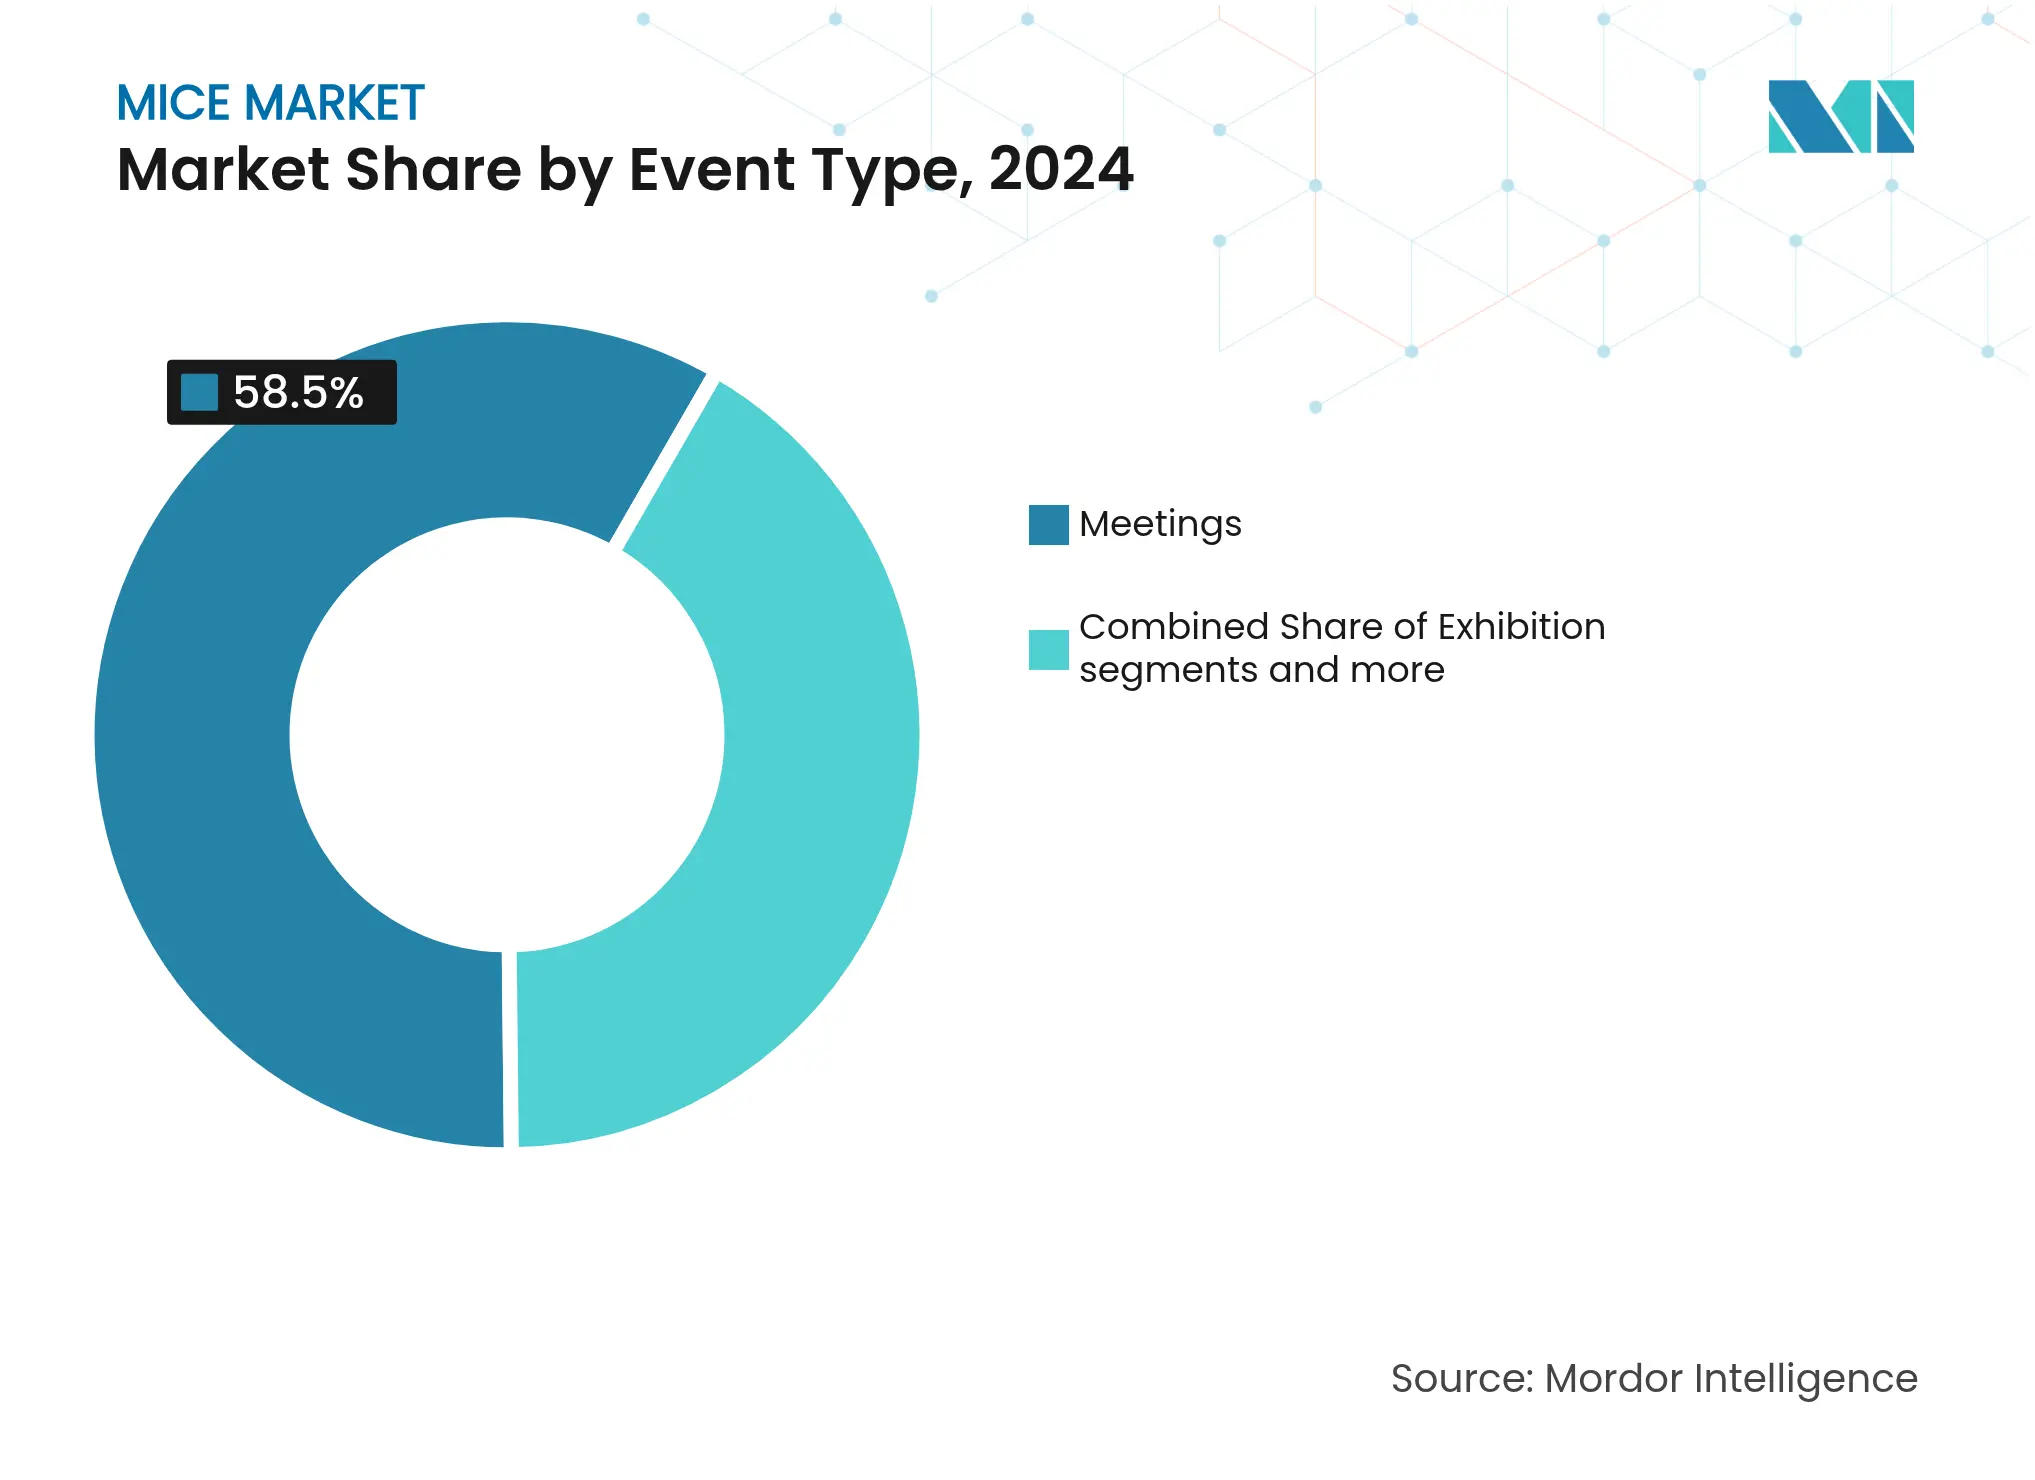
By event type, meetings led with 58.52% of MICE market share in 2024, while exhibitions are poised for the fastest 9.07% CAGR through 2030.
By service type, event planning & management captured 29.16% share of the MICE market size in 2024, whereas event technology services are expanding at a 10.22% CAGR to 2030.
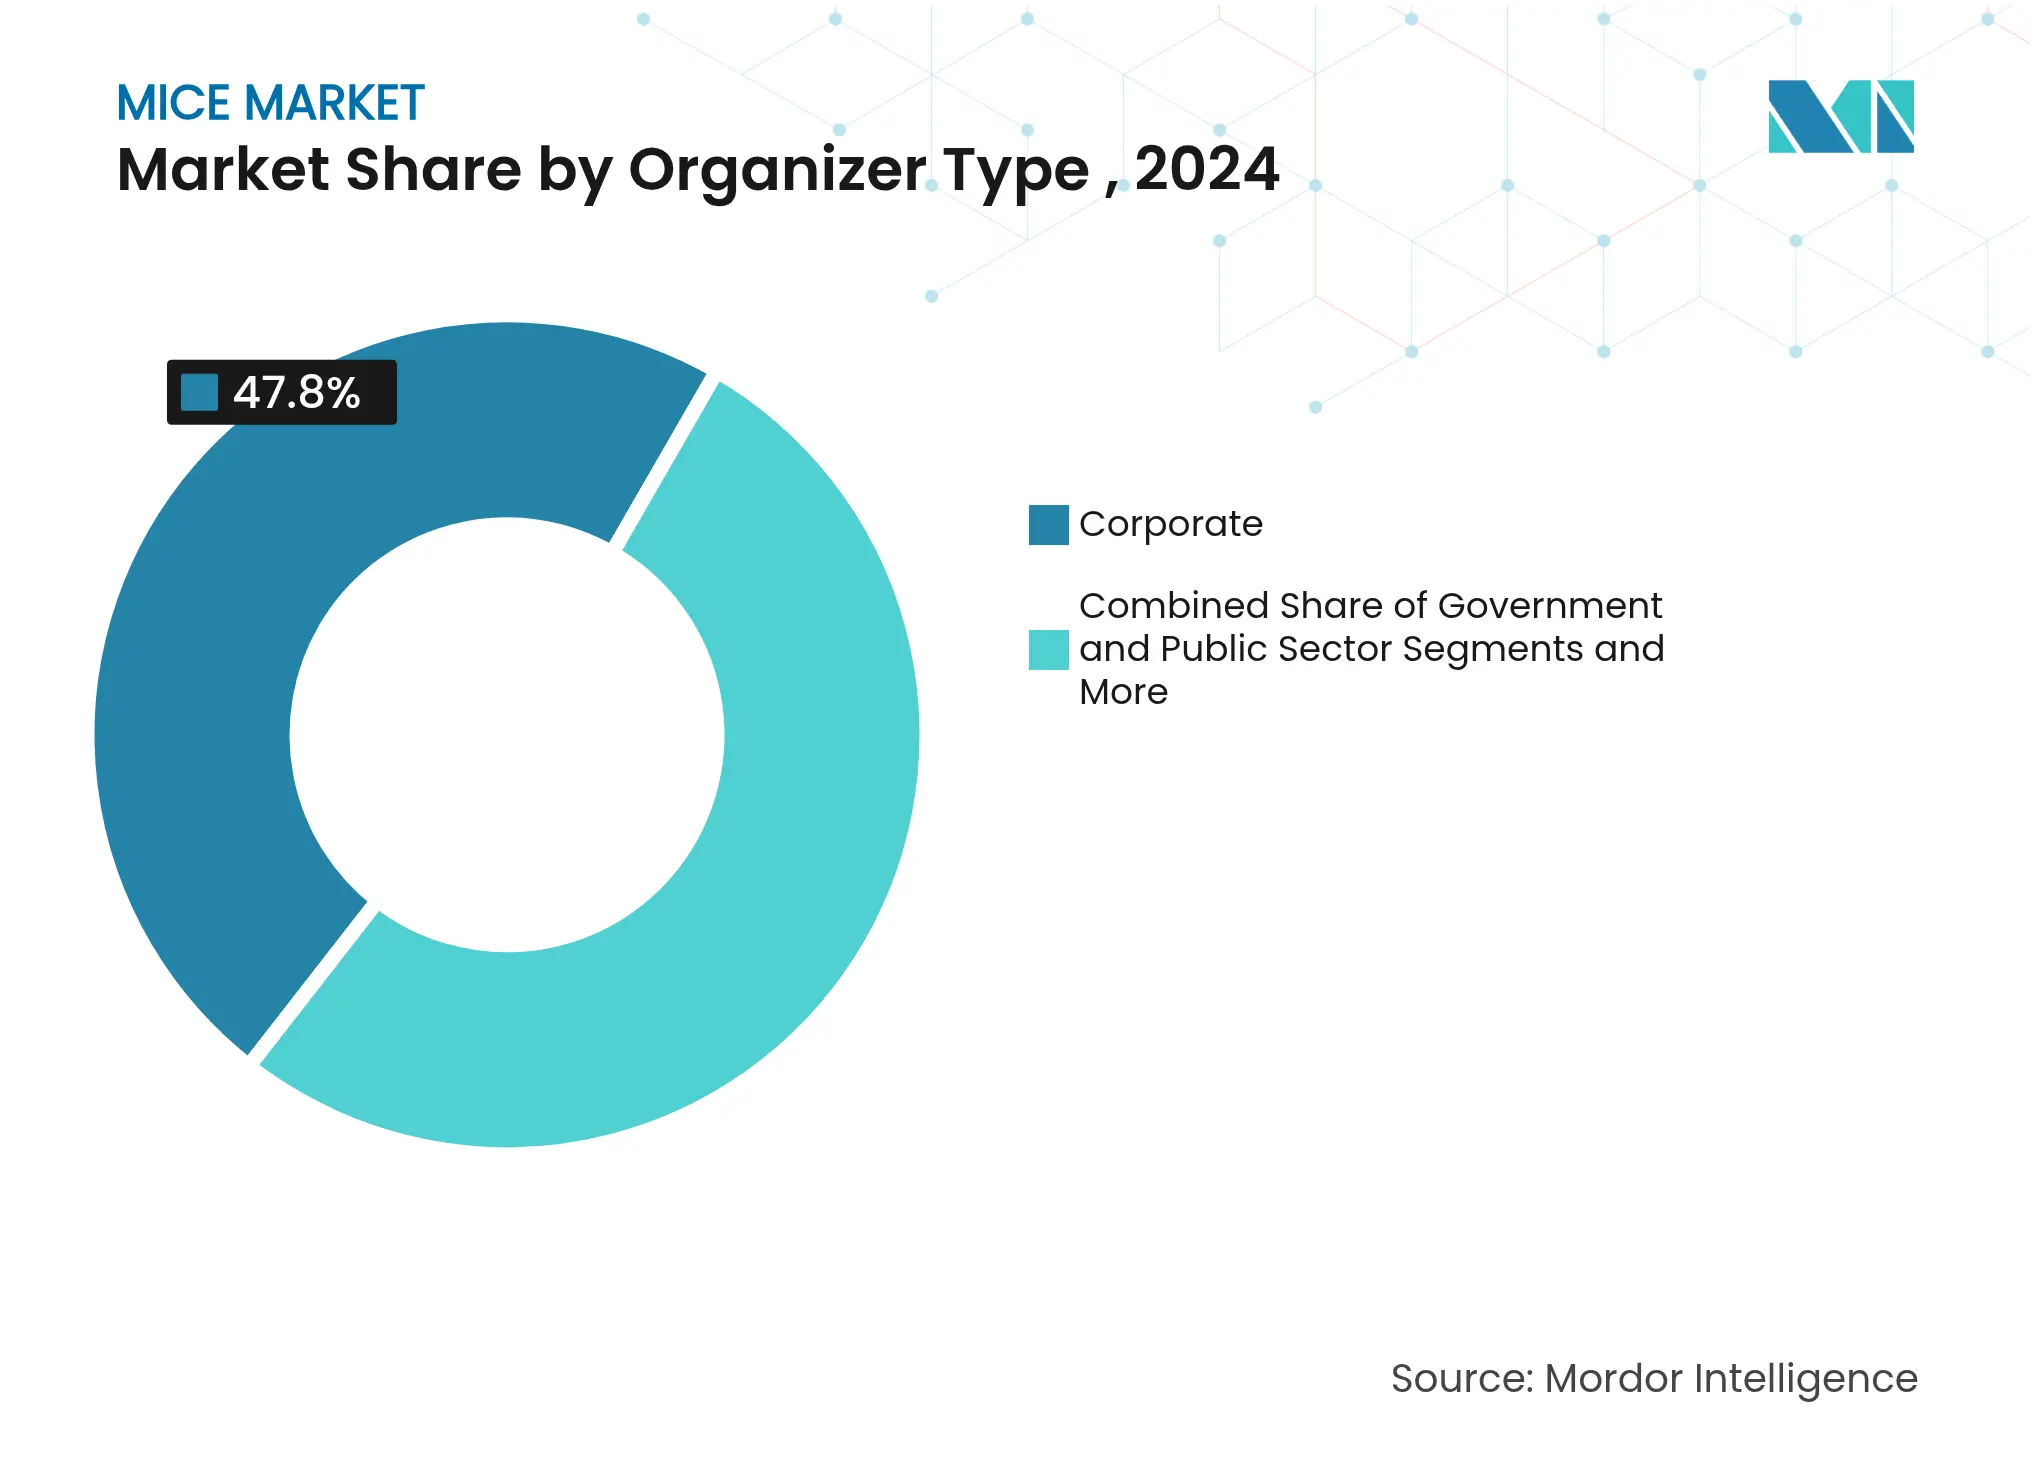
By organizer type, corporate events accounted for 47.78% of the MICE market in 2024; government & public sector events record the highest 8.63% growth outlook.
By end-user industry, IT & Telecom held 24.24% of the MICE market size in 2024, while media & entertainment is advancing at a 9.52% CAGR through 2030.
Europe dominated with 52.36% revenue share in 2024; Asia-Pacific is the fastest-growing region at a 9.98% CAGR through 2030.
CWT Meetings & Events, BCD Meetings & Events, Maritz Global Events, Reed Exhibitions, and GL Events together commanded a significant slice of global revenue in 2024.
Note: Market size and forecast figures in this report are generated using Mordor Intelligence's proprietary estimation framework, updated with the latest available data and insights as of 2026.
Drivers Impact Analysis
| Driver | (~) % Impact on CAGR Forecast | Geographic Relevance | Impact Timeline | |||
|---|---|---|---|---|---|---|
Increasing
globalization of businesses boosts corporate events
Increasing
globalization of businesses boosts corporate events
| +2.1% | Global, with concentration in North America & Europe | Medium term (2-4 years) |
(~)
% Impact on CAGR Forecast
:
+2.1%
|
Geographic
Relevance
:
Global,
with concentration in North America & Europe
|
Impact
Timeline
:
Medium
term (2-4 years)
|
Growth
in international tourism fuels MICE expansion
Growth
in international tourism fuels MICE expansion
| +1.8% | APAC core, spill-over to MEA and Latin America | Long term (≥ 4 years) | |||
Hybrid
and virtual formats extend global attendee reach
Hybrid
and virtual formats extend global attendee reach
| +1.5% | Global, early adoption in North America & Europe | Short term (≤ 2 years) | |||
Government
investment in venues and promotion zones
Government
investment in venues and promotion zones
| +1.2% | North America, APAC, selective European markets | Medium term (2-4 years) | |||
AI-driven
matchmaking and personalization elevate ROI
AI-driven
matchmaking and personalization elevate ROI
| +0.9% | North America & EU, expanding to APAC | Medium term (2-4 years) | |||
Bilateral
"MICE-visa" corridors accelerate delegate flows
Bilateral
"MICE-visa" corridors accelerate delegate flows
| +0.7% | APAC-Europe, North America-Latin America corridors | Long term (≥ 4 years) | |||
| Source: Mordor Intelligence | ||||||
Increasing Globalization of Businesses Boosts Corporate Events
Multinational firms are restoring in-person strategy summits as cross-border projects multiply. Hyatt recorded 147,000 MICE enquiries across its European properties for 2024, a 9.6% year-on-year rise, underlining the return of experiential business travel[1]Hyatt Corporation, “2024 EMEA Meetings Update,” hyatt.com. Companies in finance, pharmaceuticals, and aerospace are booking exclusive hotel buyouts to create secure settings for confidential negotiations. Bilateral “MICE-visa” corridors between key trade partners are trimming delegate lead times, which supports steady calendarization of regional leadership meetings. Demand is strongest for formats that blend knowledge exchange with cultural immersion, reinforcing the value proposition of destination-based events.
Growth in International Tourism Fuels MICE Expansion
The tourism rebound is lifting delegate numbers as executives attach leisure days to business trips. Asia-Pacific inbound arrivals are projected to top 813.7 million by 2027, surpassing pre-pandemic volumes. Singapore saw business visitor counts climb 20% in 2025, with trade fairs capitalizing on shared logistics for corporate and leisure segments. New-build venues in Mongolia and Sri Lanka are courting overflow demand from saturated hubs, offering competitive rates and streamlined visa processing. This spill-over effect enlarges the addressable MICE market without eroding established destinations’ pricing power.
Hybrid and Virtual Formats Extend Global Attendee Reach
Hybrid events evolved from necessity into strategy. Cvent’s 2025 planner survey found that 54% of organizers now deploy AI tools for venue sourcing. Portable studios and immersive 3D design are enabling “phygital” experiences where off-site delegates engage in real time. The model reduces travel emissions while preserving in-person networking for high-value stakeholders. Early adopters report cost savings of 11-14% per event, which is especially attractive as inflation lifts hotel and catering rates.
Machine-learning algorithms parse registration data to optimize agenda design and sponsor targeting. Cvent’s purchase of spatial design specialist Prismm in 2025 reinforced the shift toward data-rich planning workflows. Exhibitors track qualified-lead conversions instead of footfall, reshaping booth budgeting. Post-event analytics feed into customer-relationship systems, letting planners quantify pipeline impacts months after the conference closes.
Restraints Impact Analysis
| Restraint | (~) % Impact on CAGR Forecast | Geographic Relevance | Impact Timeline | |||
|---|---|---|---|---|---|---|
Travel-cost
inflation and budget constraints
Travel-cost
inflation and budget constraints
| -1.3% | Global, acute in Europe and North America | Short term (≤ 2 years) |
(~)
% Impact on CAGR Forecast
:
-1.3%
|
Geographic
Relevance
:
Global,
acute in Europe and North America
|
Impact
Timeline
:
Short
term (≤ 2 years)
|
Stricter
corporate carbon budgets limit long-haul events
Stricter
corporate carbon budgets limit long-haul events
| -0.8% | Europe & North America, expanding globally | Medium term (2-4 years) | |||
Shortage
of certified sustainable-event talent
Shortage
of certified sustainable-event talent
| -0.5% | Global, most acute in developed markets | Medium term (2-4 years) | |||
Cyber-security
and data-privacy risks in hybrid platforms
Cyber-security
and data-privacy risks in hybrid platforms
| -0.4% | Global, heightened in regulated industries | Short term (≤ 2 years) | |||
| Source: Mordor Intelligence | ||||||
Travel-Cost Inflation and Budget Constraints
Average attendee cost is projected to reach USD 169 in 2025 after a 4.3% uptick, fueled by hotel rate increases of 2.6% and catering hikes nearing 6%. Planners are shifting events to secondary cities and shoulder seasons, unlocking discounts that can shave 12-18% from total spend. The squeeze triggered consolidation among boutique agencies that lack the volume deals enjoyed by mega-consolidators, narrowing supplier choice for buyers.
Stricter Corporate Carbon Budgets Limit Long-Haul Events
Companies now allocate emissions quotas to business travel. Lufthansa’s sustainable aviation fuel surcharge of up to EUR 72 per flight from January 2025 directly raises delegate costs. Rail-connected venues in Frankfurt, Amsterdam, and Lyon are gaining share as planners curb intercontinental flights. Hybrid programmes allow global keynote speakers to appear virtually, letting organizers reserve carbon credits for client-facing journeys.
By Event Type: Meetings Dominate While Exhibitions Accelerate
Meetings commanded 58.52% of the MICE market share in 2024, supported by board retreats, annual planning sessions, and investor briefings. Confidential dialogue and agile decision-making keep this format indispensable even as digital collaboration tools improve. Exhibitions offer the strongest growth trajectory with a 9.07% CAGR to 2030, propelled by pent-up demand for product demonstrations in manufacturing, electronics, and defense. The scale of China’s Shenzhen World Exhibition & Convention Center, now exceeding 500,000 square meters, signals the appetite for mega-venues where thousands of suppliers and buyers converge.
The MICE market size attached to exhibitions alone is expected to more than double in emerging economies by 2030, reflecting local industrialization and new trade corridors. Organizers are bundling on-site matchmaking apps with post-show virtual lobbies to stretch exhibitor ROI beyond the floor date. Incentive travel and conferences remain steady niches, buoyed by companies that reward top performers through experiential trips and by associations that uphold annual knowledge-sharing mandates.
Note: Segment shares of all individual segments available upon report purchase
By Service Type: Technology Services Outpace Traditional Planning
Event Planning & Management held 29.16% of the MICE market size in 2024 as corporations continued to outsource complex logistics. Yet Event Technology is forecast to expand at 10.22% CAGR, making it the fastest-moving services cluster. Platforms that integrate registration, virtual streaming, and post-event analytics into one dashboard cut manual workload by more than one-third, a benefit that resonates with stretched in-house teams.
Venue sourcing remains resilient because local restrictions and contract clauses vary widely across jurisdictions. Meanwhile, immersive design tools reduce pre-event travel for site inspections, trimming both carbon emissions and budget outlays. Catering providers adapt by offering low-waste menus sourced within 150 miles of the venue, aligning with net-zero pledges. Transportation partners are adding carbon-offset options at the booking stage, converting sustainability from a cost center to a value proposition.
By Organizer Type: Government Sector Accelerates Investment
Corporate organizers retained 47.78% control of the MICE market in 2024, sustained by consistent product launches and partner summits. However, government and public-sector events will post an 8.63% CAGR through 2030 as administrations host investor forums, climate conferences, and diplomacy-driven exhibitions. The U.K. awarded a GBP 100 million travel-management contract to a single provider in 2025, illustrating the scale and predictability of public demand[2]UK Government Cabinet Office, “Travel Management Framework Award,” gov.uk.
Associations preserve a solid booking pipeline, especially in healthcare, where regulatory updates necessitate in-person dialogue. Professional conference organizers leverage multi-region footprints to support clients that rotate events between continents for member inclusivity. The MICE industry also sees universities staging academic congresses that double as city-marketing vehicles, raising destination profiles for future commercial wins.
Note: Segment shares of all individual segments available upon report purchase
By End-User Industry: Media & Entertainment Drives Innovation
IT & Telecom retained 24.24% of the MICE market size in 2024 thanks to hardware launches and developer gatherings that require hands-on demos. Media & Entertainment is projected to outpace all other verticals at a 9.52% CAGR, spurred by global content licensing deals and immersive XR showcases. The 2024 MIPCOM gathering in Cannes drew 10,500 delegates from 110 countries, underlining the sector’s appetite for face-to-face networking.
Life-science players continue to book regulatory and clinical trial meetings in certified venues with proximity to research hospitals. Automotive and energy companies co-locate supply-chain symposiums with ride-and-drive experiences that convert test mileage into memorable brand touchpoints. Financial services events favor smaller, high-security forums where regulatory briefings and fintech demos occur under tight confidentiality protocols.
Europe retained 52.36% revenue share in 2024, anchored by high-density transport links and mature venue portfolios. London’s USD 254 million ExCeL expansion raised capacity to 700,000 square feet, supporting bid wins for tech and medical congresses. Rail connectivity makes intra-regional events more carbon-efficient, appealing to corporates tracking emissions. Yet inflationary pressures are nudging planners toward Eastern Europe and Scandinavia, where modern centers provide competitive day-delegate rates.
Asia-Pacific is the fastest-growing geography, advancing at a 9.98% CAGR through 2030. China’s reopening has revived supplier meetings, while Singapore leverages public-private grants to subsidize first-time international events. The Philippines broke ground on the Benjamin Romualdez International Convention Center, adding 5,000 seats to serve trade shows in Eastern Visayas. Secondary cities across Vietnam and Indonesia bundle cultural immersion with cost savings, broadening regional appeal.
North America sustains robust demand through mega-investments such as Dallas’s USD 3.7 billion convention-centre overhaul, which will deliver 2.5 million square feet by 2029. However, inflation and sustainability targets steer some organizers to tier-two markets like Cleveland and Calgary. Latin America, the Middle East, and Africa show early-stage potential shaped by airport overhauls and visa-on-arrival schemes, positioning them as future battlegrounds for share capture in the worldwide MICE market.
Market Concentration
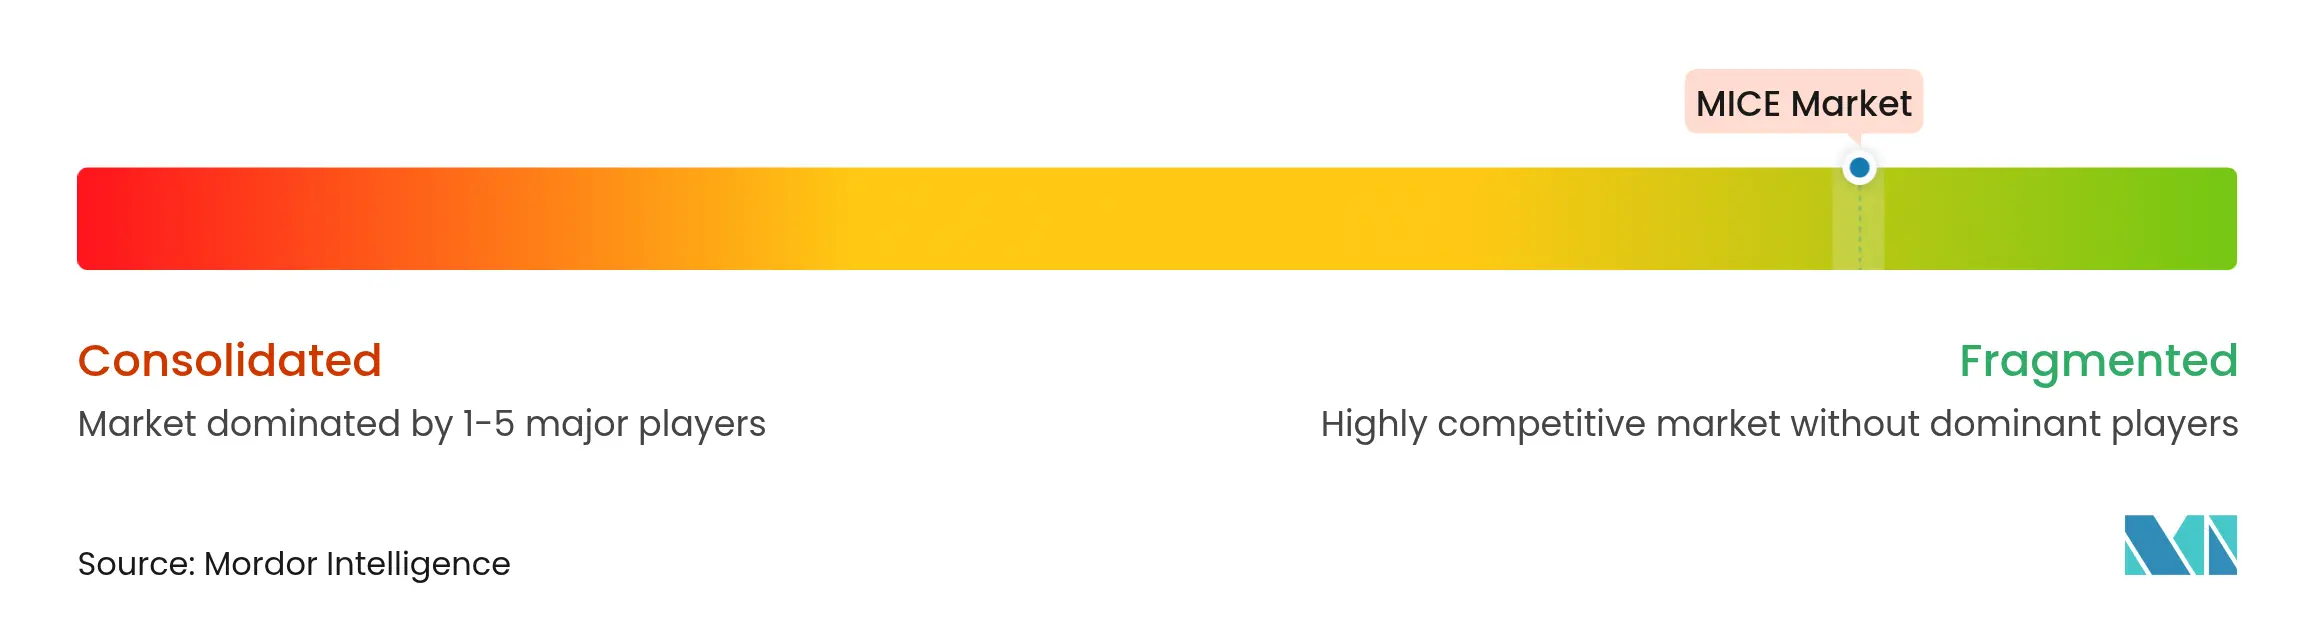
The global MICE market remains moderately fragmented. CWT Meetings & Events, BCD Meetings & Events, Maritz Global Events, Reed Exhibitions, and GL Events hold a notable combined slice but face rising tech-native rivals. Clarion Capital Partners bought Marketplace Events in January 2025, adding 110 consumer shows and 2.2 million visitors to its portfolio[3]TSNN Editorial, “Clarion Capital Acquires Marketplace Events,” tsnn.com. RELX, parent of Reed Exhibitions, logged USD 4.64 billion revenue in H1 2024, proof that scale and data depth still underpin resilience.
Strategic playbooks cluster around three models. First, global integrators knit technology with sourcing to present end-to-end solutions, exemplified by American Express GBT’s bid for CWT, which would boost purchasing power and analytics capability. Second, regional specialists exploit local language skills and regulatory fluency to secure public-sector tenders. Third, vertical experts specialize in sectors like medical congresses, where compliance nuances create high entry barriers.
Technology is the primary differentiator. AI-enabled attendee matchmaking, carbon-footprint calculators, and spatial design software raise switching costs for clients once embedded. Sustainability credentials are becoming table stakes; GL Events reduced total emissions by 12% in 2024 through LED retrofits and waste-diversion programmes. Consolidation is expected to continue as firms seek scale economies and data assets to offset margin pressure from rising supplier costs.

*Disclaimer: Major Players sorted in no particular order
1. Introduction
2. Research Methodology
3. Executive Summary
4. Market Landscape
5. Market Size and Growth Forecasts
6. Competitive Landscape
7. Market Opportunities & Future Outlook
MICE travel, a segment of the broader travel and tourism market, focuses on business-oriented activities such as meetings, incentives, conferences, and exhibitions. By bringing together leading professionals from diverse industries in customized hospitality settings, Mice is witnessing a surge, bolstered by an increasing number of global companies entering the Mice services arena. Mice Market is Segmented into Event Type and Geography. By Event Type, the market is segmented into Meetings, Incentives, Conferences, and Exhibitions, and by Geography, the market is segmented into North America, Europe, Asia-Pacific, South America, and Middle East & Africa. The Report Offers the Market Size in Value Terms in USD for all the Above-Mentioned Segments.
Unlocking Saudi Arabia’s Regional Tourism Growth Potential
5 Min Read
MICE Sales Optimization for a Top Hotel Brand
3 Min Read
Wealth Management Intelligence for the Middle East
4 Min Read
When decisions matter, industry leaders turn to our analysts. Let’s talk.