Market Overview
| Study Period | 2020 - 2031 |
|---|---|
| Forecast Data Period | 2026 - 2031 |
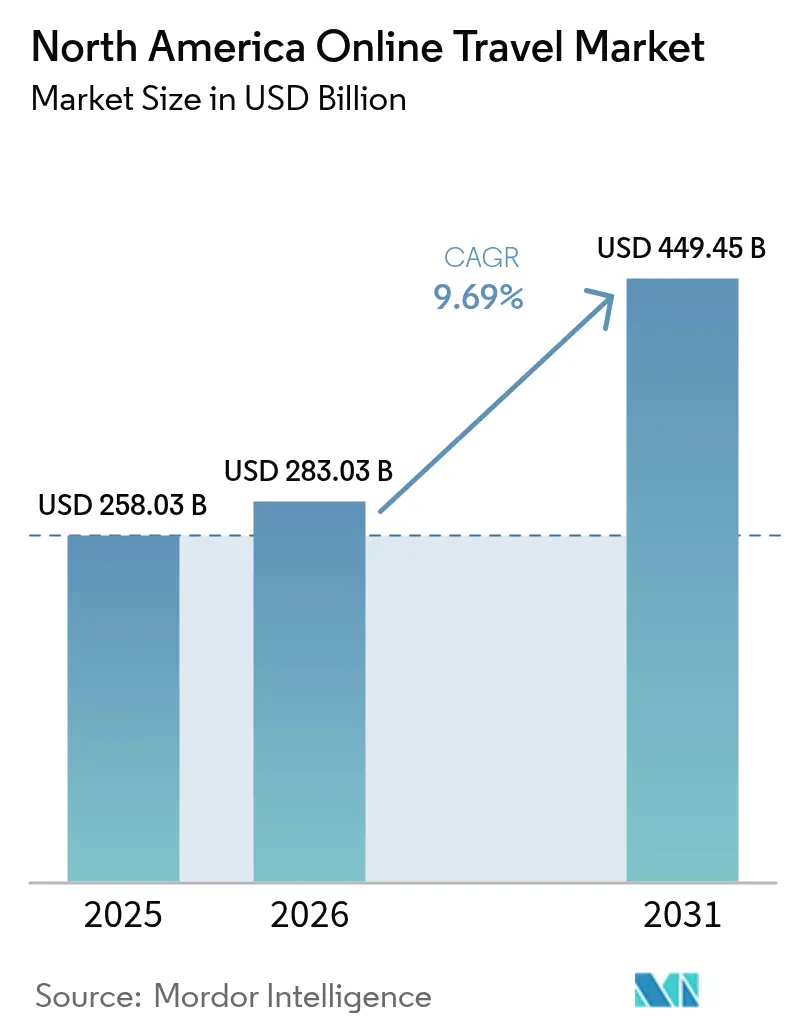
| Base Year Market Size (2025) | USD 258.03 Billion |
| Market Size (2026) | USD 283.03 Billion |
| Market Size (2031) | USD 449.45 Billion |
| Growth Rate (2026 - 2031) | 9.69% CAGR |
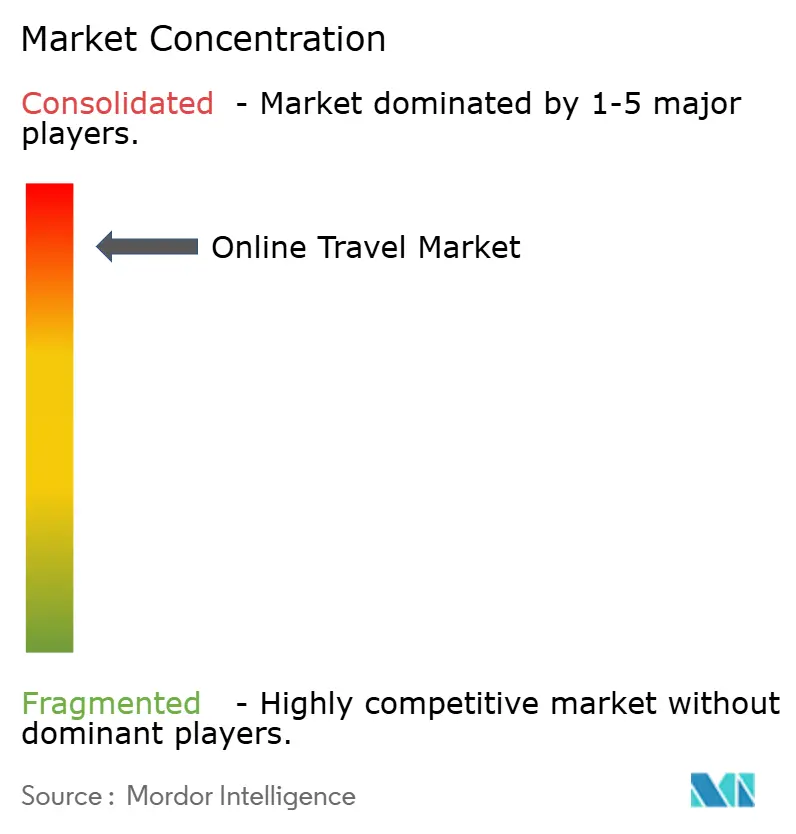
| Market Concentration | High |
Major Players *Disclaimer: Major Players sorted in no particular order Image © Mordor Intelligence. Reuse requires attribution under CC BY 4.0. | |
North America Online Travel Market Analysis by Mordor Intelligence
The North America Online Travel Market size was valued at USD 258.03 billion in 2025 and estimated to grow from USD 283.03 billion in 2026 to reach USD 449.45 billion by 2031, at a CAGR of 9.69% during the forecast period (2026-2031).
Momentum comes from always-connected consumers, rapid mobile adoption, and new payment choices that shorten the path from inspiration to purchase. Mobile bookings already account for 57% of all online reservations, underscoring how smartphones have become the control center for trip planning. Airline New Distribution Capability (NDC), the spread of short-term rentals, and flexible “buy now, pay later” (BNPL) options are widening product choice and nudging transaction values upward. At the same time, state-level rules on home-sharing, stubbornly high merchant fees, and persistent cybersecurity risks work as brakes on what is otherwise a high-velocity expansion of the North America online travel market.
Key Report Takeaways
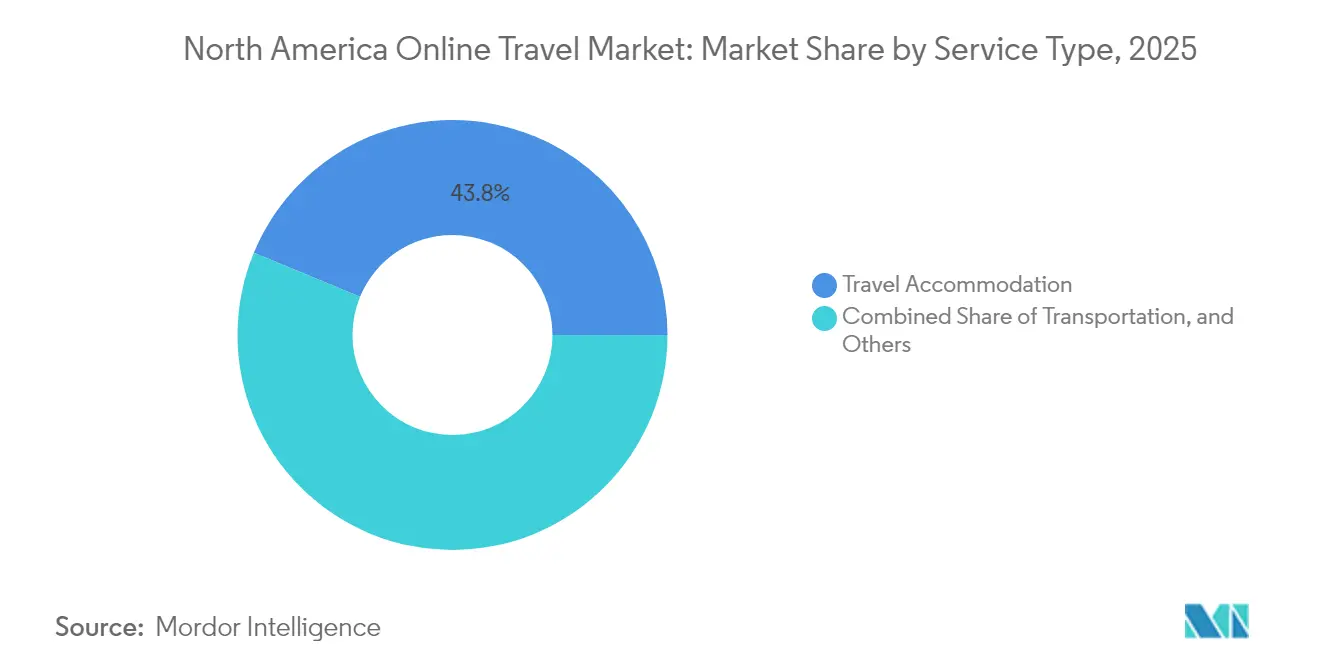
- By service type, travel accommodation led with 43.75% of the North America online travel market share in 2025, while vacation packages are forecast to grow at a 10.39% CAGR through 2031.
- By device, smartphones captured 56.18% of bookings in 2025; desktop remains important, yet mobile is projected to post an 11.55% CAGR to 2031 in the North America online travel market.
- By booking mode, online travel agencies held 60.72% share of the North America online travel market size in 2025, whereas direct supplier apps are set to expand at a 8.97% CAGR to 2031.
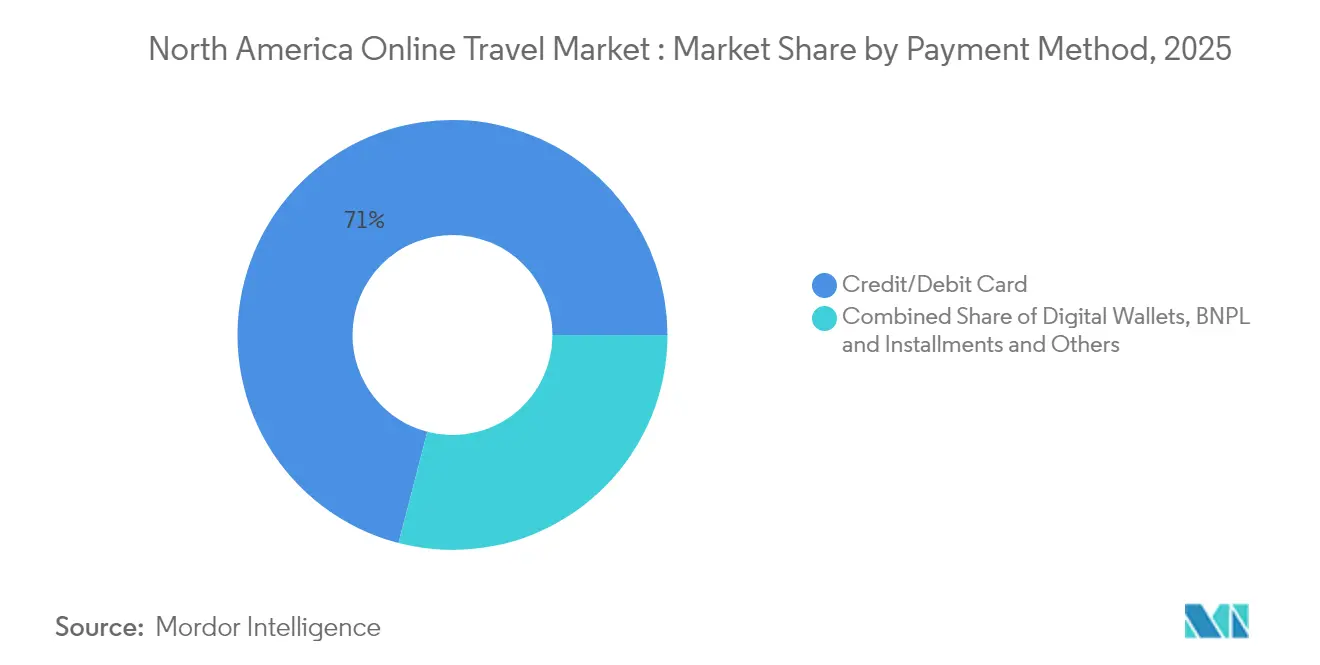
- By payment method, credit/debit cards retained 70.96% revenue share in 2025, but BNPL is the fastest-growing option with an 17.48% CAGR expected through 2031.
- By purpose of travel, leisure accounted for 67.34% of total spend in 2025 and is advancing at an 10.12 % CAGR.
- By age group, millennials commanded 44.72% of bookings in 2025; generation Z is the quickest riser with an 11.08% CAGR.
- By geography, the United States dominated with 80.95% share in 2025, while Mexico is forecast to post the region’s fastest 8.62% CAGR.
- The five largest players—Expedia Group, Booking Holdings, Airbnb, TripAdvisor, and Hopper—collectively held major market share in 2024, signaling a highly concentrated competitive field.
Note: Market size and forecast figures in this report are generated using Mordor Intelligence’s proprietary estimation framework, updated with the latest available data and insights as of 2026.
North America Online Travel Market Trends and Insights
Drivers Impact Analysis*
| Driver | (~) % Impact on CAGR Forecast | Geographic Relevance | Impact Timeline |
|---|---|---|---|
| Smartphone-Led Shift to In-App Bookings Across U.S. | + 2.0% | United States, with spillover effects in Canada and Mexico | Medium term (2-4 years) |
| Airline NDC Adoption Enabling Personalized Offers | + 1.5% | North America, with strongest impact in the U.S. | Medium term (2-4 years) |
| Rising Popularity of Short-Term Rentals in Canada | + 1.2% | Canada, with influence on U.S. border regions | Short term (≤ 2 years) |
| Buy-Now-Pay-Later (BNPL) Integration Boosting Conversion in Mexico | + 1.8% | Mexico, with growing adoption in the U.S. | Short term (≤ 2 years) |
| AI-Powered Trip Planning Tools Elevating User Engagement | + 1.4% | North America, led by U.S. urban centers | Medium term (2-4 years) |
| Government Easing of Border Restrictions & Canada eTA Uptake | + 0.8% | Canada-U.S. border regions, Mexico-U.S. travel corridors | Short term (≤ 2 years) |
| Source: Mordor Intelligence | |||
Smartphone-Led Shift to In-App Bookings Across the United States
Mobile channels already capture 57% of transactions, and usage is climbing 12.2% each year. Younger cohorts drive the surge: Millennials hold a 45.11% share, and Generation Z bookings rise nearly 12% annually. Mobile interfaces support impulse reservations, location-based upselling, and richer ancillary sales that desktops rarely match. Strong 4G/5G coverage and 85% national mobile internet penetration provide the infrastructure base [1]Source: U.S. Department of Commerce, “NTIA Internet Use Survey,” commerce.gov. As a result, the North America online travel market benefits from greater engagement, longer session times, and higher attach rates for excursions and insurance.
Airline NDC Adoption Enabling Personalized Offers
By deploying NDC, carriers push real-time, tailored bundles that lift ancillary revenue per passenger by 15% [2]Source: U.S. Department of Transportation, “Airline Ancillary Revenue Statistics 2024,” transportation.gov. Dynamic pricing widens fare classes while offering seat selection, lounge access, and carbon offsets inside one screen. OTAs and metasearch engines increasingly carry this enriched content, making NDC a network effect across the North America online travel market. Airlines able to combine loyalty data with NDC pipelines report sharper yield management and lower distribution costs, reinforcing competitive advantages that ripple through allied segments such as insurance and vacation packaging.
BNPL Integration Boosting Conversion in Mexico
BNPL & Installments usage is growing at an 18.25% CAGR, the fastest of any travel payment tool. For mid-to-high-value vacation packages—already the quickest service-type segment—split payments ease sticker shock and pull forward bookings. Banco de México notes a 43% annual jump in alternative-payment transaction volume. Mexican suppliers adopting BNPL see higher cart conversion and longer lead times, which helps optimize inventory and airfare yield. The effect extends across the North America online travel market as U.S. platforms pilot similar offers to stay competitive in price-sensitive segments..
AI-Powered Trip Planning Tools Elevating User Engagement
Generative AI now curates itineraries, predicts real-time crowding, and auto-rebooks disrupted segments. Large agencies disclose technology spending up 32% in 2024. Conversational search lowers friction, while machine-learning pricing engines fine-tune offers by time-of-day and proximity. Suppliers using AI personalize promotions at scale, pushing higher conversion and loyalty metrics that feed back into the North America online travel market growth loop.
Restraints Impact Analysis*
| Restraint | (~) % Impact on CAGR Forecast | Geographic Relevance | Impact Timeline |
|---|---|---|---|
| State-Level Restrictions on Short-Term Rentals in U.S. Cities | -1.0% | Major U.S. urban centers (New York, San Francisco, Boston) | Medium term (2-4 years) |
| High Merchant & Interchange Fees Raising Cost Pressures | -0.8% | North America, with highest impact in the U.S. | Long term (≥ 4 years) |
| Cybersecurity & Data-Privacy Breaches Eroding Consumer Trust | -1.2% | North America, particularly affecting large OTAs | Medium term (2-4 years) |
| Airline Capacity Constraints Driving Price Volatility | -0.9% | Major U.S. and Canadian air travel hubs | Short term (≤ 2 years) |
| Source: Mordor Intelligence | |||
State-Level Restrictions on Short-Term Rentals in U.S. Cities
More than 70 metropolitan areas revised home-sharing laws between 2022 and 2024. Licensing caps and zoning bans thin inventory in top demand hubs, crimping the 44.10% accommodation segment. Hosts pivot to suburban zones, altering search patterns and length-of-stay norms inside the North America online travel market. Platforms divert marketing spend into compliant listings, slowing expansion and raising acquisition costs in regulated locales.
High Merchant and Interchange Fees Raising Cost Pressures
Payment processing charges remain stubbornly high, particularly on cross-border card transactions. OTAs absorbing these fees face a margin squeeze and often pass costs on through service charges, dampening price elasticity. The burden weighs heavier on low-cost carriers and value-based lodging suppliers, eroding competitiveness versus cash-heavy rivals. Over time, elevated fee structures may accelerate supplier push toward direct channels, reshaping revenue flows across the North America online travel market.
*Our forecasts treat driver/restraint impacts as directional, not additive. The impact forecasts reflect baseline growth, mix effects, and variable interactions.
Segment Analysis
By Service Type: Bundled Experiences Propel Vacation Package Upswing
The travel accommodation segment commanded 43.75% of revenue in 2025, cementing its role as the anchor of the North America online travel market. Deep property inventory, from branded hotels to alternative rentals, keeps comparisons easy and prices transparent. At the same time, Vacation Packages are projected to advance 10.39% annually through 2031, outpacing every other service type. Personalized packaging engines blend flights, lodging, and on-ground activities, raising perceived value and pushing average order size higher. The “North America online travel market size” benefits as bundling drives cross-sell opportunities that lift overall spend per passenger.
Vacation packages also allow suppliers greater yield control by shifting inventory in shoulder seasons, smoothing revenue volatility that historically affected standalone hotel or air bookings. OTAs leverage machine-learning insights to tailor itineraries around traveler personas, shortening search time and lifting satisfaction scores. Transportation remains steady as multimodal search gains traction, with the U.S. Bureau of Transportation Statistics citing a 28% rise in online multimodal reservations in 2024. Ancillary categories—tours, insurance, experiences—embrace contextual selling; push notifications timed to weather or local events encourage incremental spend, adding depth to the North America online travel market.


By Device Type: Mobile Booking Supremacy Continues to Expand
Mobile accounted for 56.18% of all bookings in 2025, growing at a 11.55% CAGR into the next decade. That dominance shapes app interface priorities, from one-tap payment to biometric login. Gen Z contributes the fastest motor, boosting traffic and advocating social-media driven discovery that converts directly inside apps. The “North America online travel market size” sees incremental growth as richer in-app functionalities drive ancillary attachment rates and loyalty enrollments.
Desktops persist for multi-stop or high-value itineraries where larger screens aid comparison. Tablets play a research role, often seeding intent that later closes on smartphones. Suppliers experiment with QR code triggers at airports and attractions to capture real-time upsell moments. Continuous design optimization for smaller screens keeps bounce rates in check, preserving funnel efficiency across the North America online travel market.
By Booking Mode: Direct Channels Seek Margin Relief
Online travel agencies retained a 60.72% share of the North America online travel market in 2025, yet direct supplier channels are gaining ground with an anticipated 8.97% CAGR. Major hotel chains sharpen loyalty program benefits—free Wi-Fi, room-type upgrades, app-only rates—to entice repeat usage. Airlines similarly encourage app downloads with push-upgrade offers and automated re-accommodation features during irregular operations.
OTAs counter by embedding virtual agents, same-page insurance quotes, and multi-supplier vacation bundles that direct channels cannot easily replicate. The result is an innovation race that improves consumer choice and compresses booking friction. As supplier apps proliferate, marketing cost per acquisition could drop, allowing reallocation toward product development, a net positive for the North America online travel market.

By Purpose of Travel: Leisure Demand Steers Product Innovation
Leisure trips represented 67.34% of the booking value in 2025. Experiences now outpace material goods in household priority, a trend most visible among Millennials and Gen Z. Suppliers respond by curating local, authentic excursions ranging from farm-to-table dining to street art walks. Customizable cancellation windows and fully refundable codes satisfy risk-averse consumers, widening conversion.
Business travel grows with an 8.54% annual expansion expected through 2031, important even as remote work shifts company policies. Hybrid schedules spawn “bleisure” extensions, lengthening stays and adding weekend nights that pump incremental revenue. Meetings meanwhile migrate toward secondary markets with lower costs and looser restrictions, redistributing spend across a wider geography. This flexibility keeps demand resilient and enriches supply diversity inside the North America online travel market.
By Payment Method: Financial Flexibility Wins Wallet Share
Credit and debit cards processed 70.96% of transactions in 2025, but BNPL models are racing ahead, projected at 17.48% CAGR. Flexible installments turn big-ticket vacations into manageable monthly outlays, enlarging the addressable audience. Digital wallets benefit from tokenization and biometric authentication, soothing cybersecurity anxieties that remain a key restraint. For cross-border itineraries, multi-currency wallets sidestep punitive FX fees and simplify reconciliation.
The surge in BNPL & Installments also yields earlier booking windows, granting airlines and hotels clearer demand visibility and better inventory controls. Alternative rails—bank transfers, vouchers, crypto—address specific traveler niches and local regulations, ensuring the North America online travel market can serve a spectrum of budgets and risk profiles.
By Age Group: Emerging Gen Z Sets New Experience Benchmarks
Millennials generated 44.72% of bookings in 2025, yet Gen Z will supply the steepest curve with nearly 11.08% annual growth. Gen Z’s ethos prizes sustainability, peer reviews, and social validation, prompting platforms to enhance eco-labels and creator-led storytelling. Generation X stays prominent for family vacations and multi-room stays, while Baby Boomers uphold premium cabin and luxury cruise demand.
Cross-generational influence is tangible: features first rolled out for digital natives—such as frictionless in-app re-booking—rapidly become baseline expected by older travelers. This democratizes innovation and pushes universal design, thereby broadening the North America online travel industry adoption across demographics.
Geography Analysis
The United States dominated the North America online travel market with 80.95% revenue share in 2025. High per-capita spend, wide broadband coverage, and an inventory spectrum spanning national parks to urban attractions make the country a self-sustaining demand engine. TSA checkpoint throughput reached 2.94 million on 24 June 2024, underscoring robust domestic air traffic even against inflation headwinds . Strength in home-market leisure travel, where 68% of trips stay within U.S. borders, cushions the sector from external shocks and fuels platform scale advantages.
Mexico, holding a smaller base, is the fastest climber, tracking a 8.62% CAGR through 2031. Infrastructure upgrades, such as new terminals at Cancún and Guadalajara, streamline airlift, while BNPL adoption lowers affordability barriers for domestic and inbound tourists. The Ministry of Tourism recorded a 12% uptick in international arrivals during 2024. Mobile booking penetration mirrors regional averages, validating cross-border scalability for app-centric models that have already matured in the United States.
Canada's online travel market continues to evolve with unique regulatory developments and changing travel patterns. The country's online travel sector is particularly influenced by the rising popularity of short-term rentals, which is reshaping the accommodation landscape and contributing to the overall dominance of the Travel Accommodation segment.
Competitive Landscape
Competition in the North America online travel market is concentrated, with the top five players jointly holding major market share. Expedia Group continues to lean on bundled package capabilities and large loyalty enrollment, Booking Holdings refines price-parity algorithms, and Airbnb scales Experiences to deepen traveler engagement beyond lodging. TripAdvisor harnesses review volume to funnel traffic into meta-search and instant booking, while Hopper deploys predictive pricing to carve out a fast-growing mobile niche.
Strategic investments trend toward vertical integration: Expedia integrates finance with point-of-sale credit, Booking acquires ground-transport tech, and Airbnb experiments with ticketed events. AI remains the common denominator, underscored by a 32% jump in technology outlays reported in collective SEC filings. This arms race targets real-time personalization, fraud mitigation, and operational efficiency.
White-space opportunities persist in luxury, eco-tourism, and niche adventure segments where dominant platforms have limited curation. Smaller specialists differentiate via deep local supplier relationships and purpose-driven branding. Still, high customer-acquisition costs and platform fee structures often push independents toward partnership or acquisition, further reinforcing the scale advantages enjoyed by incumbents within the North America online travel market.
North America Online Travel Industry Leaders
Expedia Group, Inc.
Booking Holdings Inc.
Airbnb, Inc.
TripAdvisor LLC
Hopper Inc
- *Disclaimer: Major Players sorted in no particular order

Recent Industry Developments
- May 2025: Affirm and UATP announced a partnership to enable pay-later options across airline merchants, broadening BNPL reach in travel bookings.
- April 2025: The United States Tour Operators Association launched the Beyond Borders Tourism Coalition to bolster cross-border demand amid policy uncertainty.
- February 2025: TripAdvisor partnered with Perplexity AI to enhance conversational search and recommendation features.
- January 2025: Quintana Roo unveiled “Luxury Experience by Mexican Caribbean,” supported by new infrastructure such as Tulum Airport and the Tren Maya.


Research Methodology Framework and Report Scope
Market Definitions and Key Coverage
Our study defines the North American online travel market as all gross booking value generated when leisure or business travelers in the United States, Canada, and Mexico purchase transport tickets, accommodation, or bundled packages through internet-connected devices on supplier sites, apps, and online travel agencies.
We excluded storefront agency sales, corporate travel management fees, and ancillary insurance sold outside the booking flow.
Segmentation Overview
- By Service Type
- Transportation
- Air Travel
- Bus & Coach Travel
- Rail Travel
- Car Rental
- Cruise
- Travel Accommodation
- Hotels & Resorts
- Alternative Lodging / Rentals
- Vacation Packages
- Others (Activities, Travel Insurance, Ancillary)
- Transportation
- By Device Type
- Desktop / Laptop
- Mobile (Smartphone)
- Tablet
- By Booking Mode
- Online Travel Agencies (OTAs)
- Direct Supplier Websites / Apps
- By Purpose of Travel
- Leisure
- Business
- By Payment Method
- Credit / Debit Card
- Digital Wallets
- BNPL & Installments
- Other (Bank Transfer, Cash, Crypto)
- By Age Group
- Generation Z (18-24)
- Millennials (25-40)
- Generation X (41-56)
- Baby Boomers (57-75)
- By Country
- United States
- Canada
- Mexico
Detailed Research Methodology and Data Validation
Primary Research
Analysts spoke with OTA revenue strategists, airline distribution heads, hotel channel managers, and payments specialists across the three countries, gathering views on mobile conversion, loyalty integration, and BNPL adoption that filled data gaps and grounded assumptions.
Desk Research
Mordor analysts began by mapping travel flows and spend from the US National Travel and Tourism Office, Statistics Canada, and Mexico's Secretaría de Turismo, which clarified cross-border passenger volumes and average trip outlays. Statistics from UNWTO, OECD digital economy indicators, and patent filings on dynamic packaging engines enriched trend signals.
The team then mined company filings, credit card network disclosures, hospitality association dashboards, and news archives accessed through D&B Hoovers and Dow Jones Factiva to benchmark channel mix, average selling prices, and promotional intensity. These sources are illustrative, not exhaustive.
Market-Sizing and Forecasting
The topline value was first estimated through a top-down model that multiplied official traveler counts by average spend and applied verified online booking penetration rates, followed by sampled OTA gross booking disclosures and hotel direct channel data to validate totals. Key drivers, smartphone penetration, real disposable income, average ticket price, credit card travel spend, and short-term rental share, feed a multivariate regression with ARIMA overlays to project 2025 to 2030 growth. Where bottom-up samples under-represent niche segments, guided adjustment factors are applied.
Data Validation and Update Cycle
Every dataset passes variance and outlier checks before analyst peer review. Outputs are compared against external gauges such as card network travel spend and airport throughput. Reports refresh annually, and material shocks trigger interim model reruns so clients receive the latest view.
Why Mordor's North America Online Travel Baseline Earns Trust
Published estimates often diverge because firms choose different service baskets, booking channels, base years, and currency conversions.
Key gap drivers include narrower country coverage, omission of supplier direct sales, or static average price assumptions used by other publishers, whereas Mordor updates inputs each year and cross-checks them with transaction evidence.
Benchmark comparison
| Market Size | Anonymized source | Primary gap driver |
|---|---|---|
| USD 258.03 B (2025) | Mordor Intelligence | - |
| USD 182.95 B (2024) | Global Consultancy A | Excludes Mexico and applies conservative online penetration |
| USD 151.26 B (2024) | Regional Consultancy B | Relies on historic OTA revenue ratios, omits supplier apps |
| USD 229 B (2023) | Trade Journal C | Uses pre-pandemic trend extension without fresh primary checks |
These contrasts show that Mordor's annually refreshed, dual-sourced model delivers a transparent, balanced baseline decision makers can rely on.


Key Questions Answered in the Report
What is the projected size of the North America online travel market by 2031?
The market is forecast to reach USD 449.45 billion by 2031, growing at a 9.69% CAGR.
Which service type is expanding the fastest in the North America online travel market?
Vacation Packages are projected to post a 10.39% CAGR through 2031 as travelers seek bundled, value-driven experiences.
How significant are mobile bookings today?
Smartphones accounted for 56.18% of all online travel reservations in 2025 and are still expanding at a 11.55% CAGR
Why is BNPL important for travel sellers in North America?
BNPL transactions are growing at 17.48% annually, improving conversion rates and making higher-value trips more affordable, especially in Mexico.
Page last updated on:


