Market Overview
| Study Period | 2020 - 2031 |
|---|---|
| Market Size (2026) | USD 95.97 Billion |
| Market Size (2031) | USD 131.55 Billion |
| Growth Rate (2026 - 2031) | 6.51% CAGR |
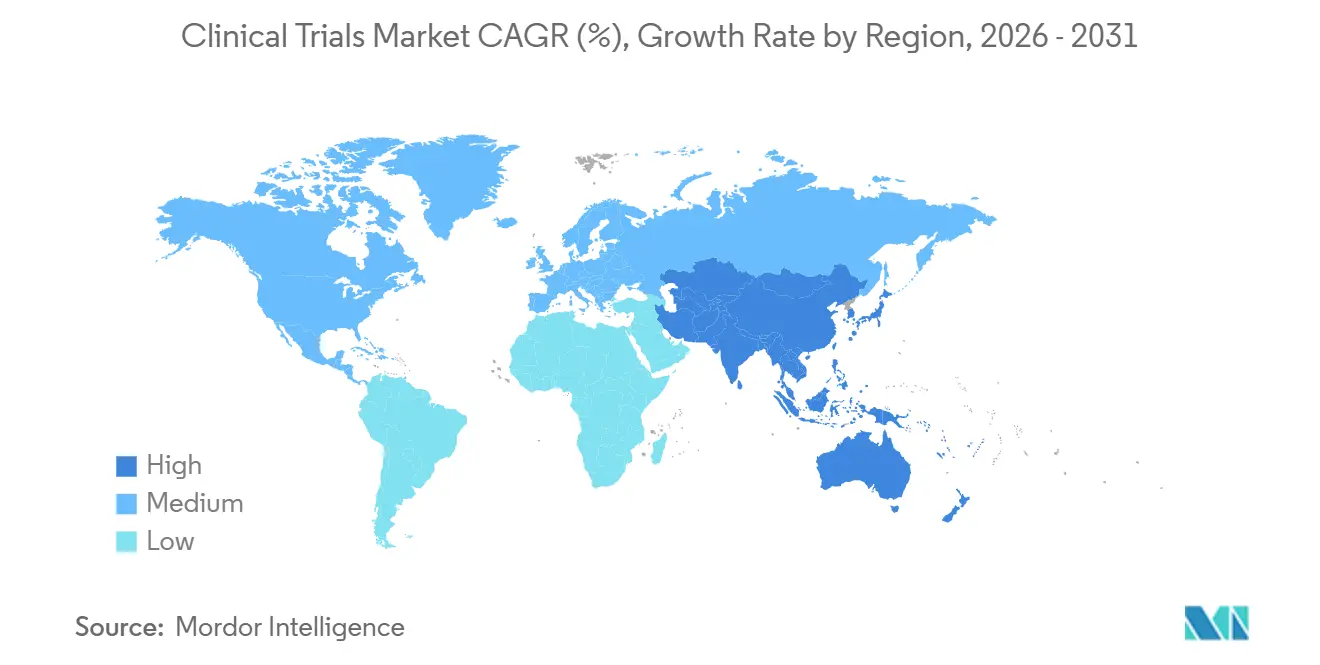
| Fastest Growing Market | Asia Pacific |
| Largest Market | North America |
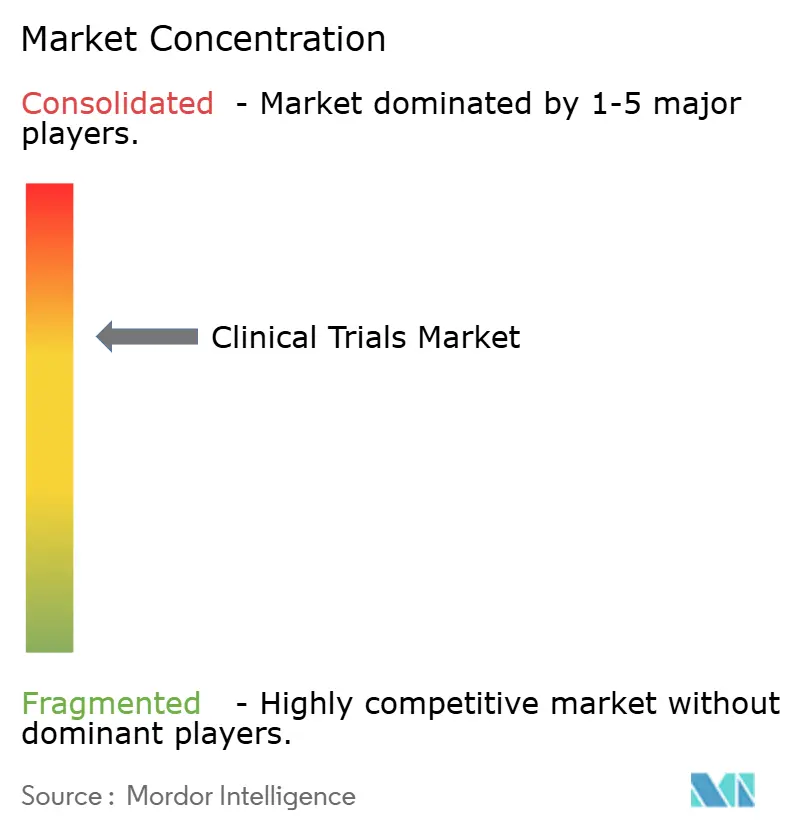
| Market Concentration | Medium |
Major Players *Disclaimer: Major Players sorted in no particular order Image © Mordor Intelligence. Reuse requires attribution under CC BY 4.0. | |
Clinical Trials Market Analysis by Mordor Intelligence
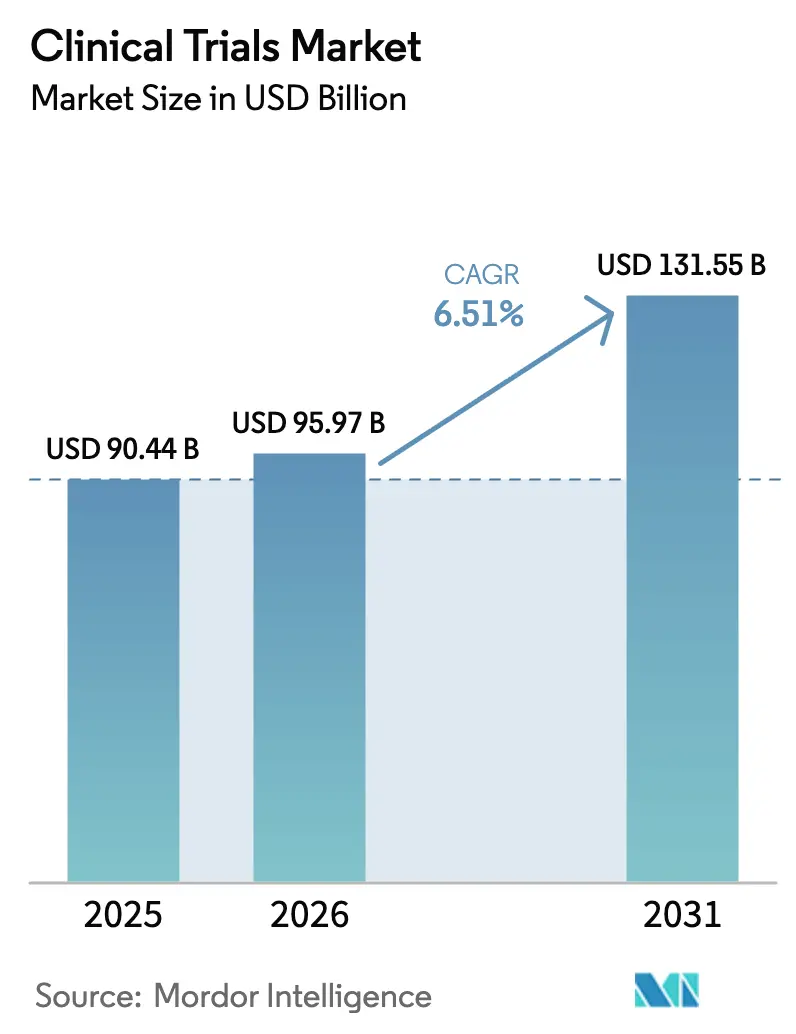
The Clinical Trials Market size was valued at USD 90.44 billion in 2025 and is estimated to grow from USD 95.97 billion in 2026 to reach USD 131.55 billion by 2031, at a CAGR of 6.51% during the forecast period (2026-2031).
Hybrid execution models that blend on-site visits with virtual workflows are becoming increasingly common in the post-pandemic era, prompting sponsors to adopt decentralized components that meet regulatory requirements while also appealing to participants. Phase II studies are attracting larger budgets as precision-medicine candidates demand biomarker-driven proof-of-concept validation before scaling to Phase III. Adaptive designs are shortening timelines for rare-disease programs, while artificial intelligence screening tools are trimming enrollment bottlenecks in oncology and neurology. Competitive dynamics center on technology integration, with leading contract research organizations (CROs) vying to embed predictive analytics that reduce monitoring costs and enhance site selection. Sponsors are also diversifying geographically, shifting enrollment to Asia-Pacific sites that now clear approvals in 30 days, a practice that relieves pressure on saturated U.S. centers.
Key Report Takeaways
- By phase, Phase III studies led with 55.00% of the clinical trials market share in 2025; Phase II is projected to grow at a 6.80% CAGR through 2031.
- By study design, interventional trials captured 72.30% share of the clinical trials market size in 2025, while adaptive formats are advancing at an 8.20% CAGR to 2031.
- By service type, clinical trial monitoring accounted for 28.50% of spend in 2025, and decentralized services are forecast to expand at a 14.60% CAGR over 2026-2031.
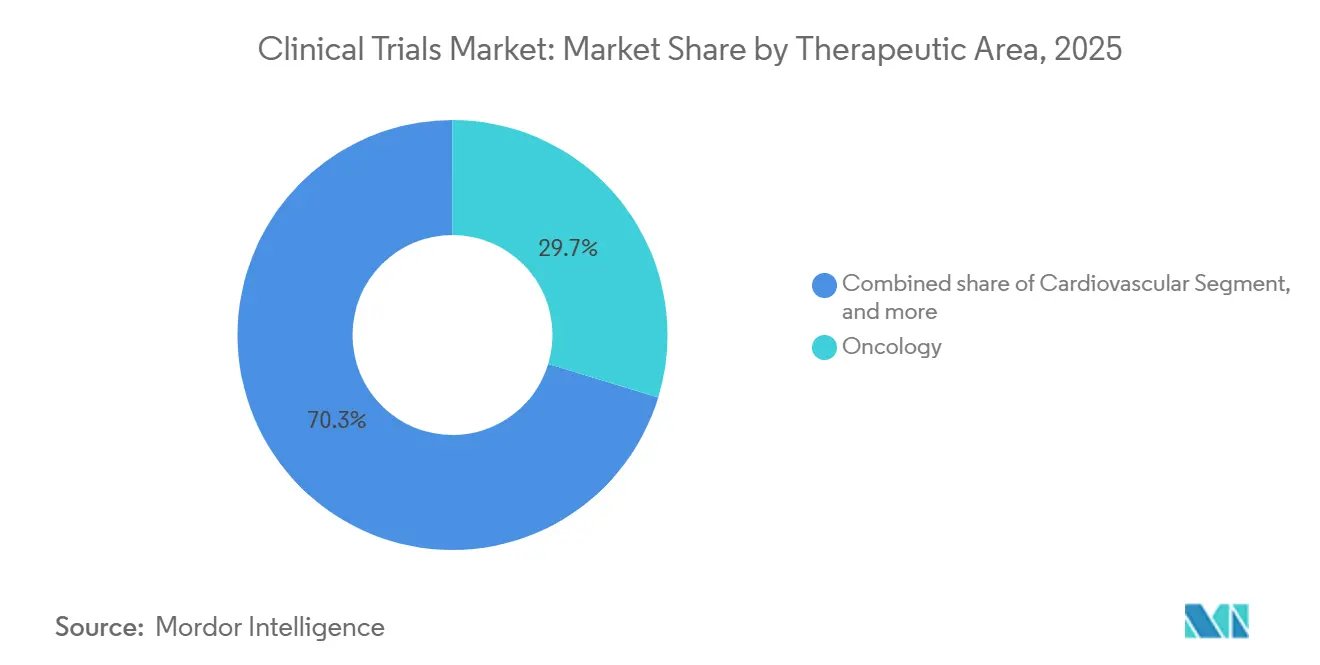
- By therapeutic area, oncology dominated with a 29.70% revenue share in 2025; neurology is poised for the fastest growth, with a 9.10% CAGR to 2031.
- By sponsor, pharmaceutical and biopharmaceutical companies retained 68.00% of the clinical trials industry share in 2025; government and non-profit funding is rising at a 7.50% CAGR.
- By geography, North America accounted for 49.20% of the revenue in 2025; however, Asia is expected to deliver a 7.90% CAGR through 2031.
Note: Market size and forecast figures in this report are generated using Mordor Intelligence’s proprietary estimation framework, updated with the latest available data and insights as of January 2026.
Global Clinical Trials Market Trends and Insights
Drivers Impact Analysis*
| Driver | (~) % Impact on CAGR Forecast | Geographic Relevance | Impact Timeline |
|---|---|---|---|
| Growing Volume of Complex Biologics & Precision Medicines Requiring Extensive Trials | +1.8% | North America, EU | Long term (≥ 4 years) |
| Expanded Outsourcing to Full-Service CROs for Cost & Speed Advantages | +1.5% | North America, Asia-Pacific | Medium term (2-4 years) |
| Regulatory Reforms Accelerating Approval Pathways (FDA Fast Track, EMA PRIME) | +1.2% | North America, EU | Medium term (2-4 years) |
| Pandemic-Induced Digital Transformation Driving eClinical Adoption | +1.4% | North America, UK, Australia | Short term (≤ 2 years) |
| Rise of Patient-Owned Health Data Wallets Facilitating Remote Monitoring | +1.1% | United States, EU | Short term (≤ 2 years) |
| Blockchain-Based Consent Management Enhancing Auditability & Compliance | +0.8% | EU, North America | Medium term (2-4 years) |
| Source: Mordor Intelligence | |||
Growing Volume of Complex Biologics and Precision Medicines Requiring Extensive Trials
Biologics and precision medicines represented 38% of all investigational assets in 2025, up from 29% five years earlier, driving increased demand for longer and data-intensive studies[1]. Cell-and-gene therapy programs needed 1,847 active INDs in the United States during 2025, yet viral-vector capacity constraints meant just 64% of planned protocols actually initiated on schedule. CROs have started acquiring manufacturing assets to mitigate these delays; Thermo Fisher invested USD 420 million to double vector capacity by 2027. Monoclonal-antibody Phase III studies averaged 52 months in 2025, compared to 38 months for small molecules, thereby elevating demand for platforms that manage four to six terabytes of genomic and imaging data per trial.
Expanded Outsourcing to Full-Service CROs for Cost and Speed Advantages
Pharmaceutical sponsors outsourced 73% of their clinical budgets to CROs in 2025 and secured Phase III enrollment 5.3 months faster than in-house programs. IQVIA posted USD 29.4 billion in backlog, equal to 2.1 years of revenue visibility, while Medpace hit a 94% on-time database-lock rate by embedding oncology nurses at sites. Asian CROs still offer a three-to-one cost edge, although 14 Indian sites received FDA warning letters in 2025 for GCP lapses, signaling that quality oversight remains critical.
Regulatory Reforms Accelerating Approval Pathways
FDA granted 87 Fast Track designations in 2025 and EMA accepted 41 PRIME submissions, cutting review cycles by several months and allowing sponsors to file rolling applications that monetize products four to seven months sooner. Japan followed suit with conditional approvals for regenerative therapies, shaving almost one year off local launches. Harmonized monitoring requirements under ICH E6(R3) now permit a single plan across multiple regions, trimming compliance outlays by 18%.
Pandemic-Induced Digital Transformation Driving eClinical Adoption
Decentralized studies accounted for 29% of all new protocols in 2025, a leap from 11% in 2019. Medidata processed 4.2 million ePRO entries in 2025, flagging adverse events 3.4 days faster than paper diaries. Wearable sensors featured in 22% of cardiovascular and neurology trials, reducing on-site visits by 40%. Pfizer enrolled 1,840 participants across 38 U.S. states without a single brick-and-mortar site and achieved 91% retention. FDA draft guidance released in March 2025 formally recognized home-based assessments as primary endpoints if validated, although GDPR continues to mandate data residency within the EU.
Restraints Impact Analysis*
| Restraint | (~) % Impact on CAGR Forecast | Geographic Relevance | Impact Timeline |
|---|---|---|---|
| High Attrition Rates in Oncology and CNS Trials Increasing Cost Risk | -0.9% | North America, EU | Long term (≥ 4 years) |
| Stringent Data-Privacy Legislations Limiting Cross-Border Data Flows | -0.6% | EU, UK, Asia-Pacific | Medium term (2-4 years) |
| Scarcity of GMP-Compliant Viral Vector Manufacturing Capacity for Gene Therapy Trials | -0.7% | North America, EU, Asia | Long term (≥ 4 years) |
| Rising Carbon-Footprint Accountability Pressures on Multisite Trials | -0.4% | Global | Medium term (2-4 years) |
| Source: Mordor Intelligence | |||
High Attrition Rates in Oncology and CNS Trials Increasing Cost Risk
Oncology protocols posted a 52% Phase III failure rate in 2025, driven by tumor heterogeneity and stringent payer demands for overall survival data. Alzheimer’s programs fared worse, with a 68% failure rate, causing each unsuccessful study to absorb USD 180-240 million in sunk costs. Adaptive designs help mitigate risk; Roche’s 2025 basket trial trimmed enrollment by 34% and saved USD 62 million by dropping weak cohorts mid-stream. Germany’s IQWiG rejected 41% of oncology submissions in 2025, prompting sponsors to focus on more rigorous endpoints[2].
Stringent Data-Privacy Legislations Limiting Cross-Border Data Flows
GDPR added 8-10 weeks to multinational start-up timelines in 2025 as sponsors set up EU data lakes. China’s Personal Information Protection Law lengthened interim analyses by up to 18 weeks, while India’s Data Protection Act forced CROs to build domestic data centers costing an extra USD 47 million in 2025. Pfizer’s blockchain consent pilot cut compliance costs 18% yet adoption sits below 5% due to integration burdens.
*Our forecasts treat driver/restraint impacts as directional, not additive. The impact forecasts reflect baseline growth, mix effects, and variable interactions.
Segment Analysis
By Phase: Adaptive Phase II Designs Accelerate Go/No-Go Decisions
Phase II studies are projected to grow at a 6.80% CAGR through 2031 and captured rising interest as adaptive methodologies optimize dose-finding and efficacy confirmation inside a single protocol. Novartis used Bayesian randomization in 2025 to shift enrollment toward high-performing arms, trimming total exposure by 28%. Despite Phase III’s 55% clinical trials market share in 2025, its duration and attrition rates spur sponsors to invest earlier in seamless Phase II/III pathways that may condense timelines by 9-12 months. Phase I programs benefit from micro-dosing and rapid mass-spectrometry assays that deliver PK data within 48 hours, while Phase IV studies piggyback on pivotal trials to amortize site costs.
By Study Design: Interventional Models Dominate but Observational Evidence Gains Traction
Interventional trials accounted for 72.30% of 2025 revenue, yet pragmatic and observational approaches are also essential for generating real-world evidence. EMA guidance allows label expansions supported by observational datasets of at least 1,200 subjects adjusted by propensity scores[3]. Expanded-access programs accounted for 4% of total activity and helped build physician familiarity ahead of launches. The NIH funded 11 pragmatic megatrials in 2025 that utilized electronic health-record randomization to reduce costs by two-thirds.


By Service Type: Monitoring Leads as Decentralized Services Surge
Monitoring represented 28.50% of 2025 revenue, reflecting regulatory preference for data verification, but centralized analytics now trigger risk-based visits and lower costs five-fold. Medidata AI flagged 14% more anomalies than manual review, reducing monitoring labor 31% in 2025. Decentralized trial services, advancing at 14.60% CAGR, bundle telehealth, wearables, and direct-to-patient logistics, enabling the clinical trials market size for virtual elements to climb rapidly. IQVIA’s feasibility algorithm cut site-selection cycles to three weeks, boosting enrollment accuracy by 19 points.
By Therapeutic Area: Oncology Still Dominates, Neurology Accelerates
Oncology kept a 29.70% hold on revenue, supported by 1,340 active mid- to late-stage programs. High failure rates push adoption of basket and umbrella schemes aimed at biomarker-defined cohorts. Neurology trials, aided by amyloid-PET and plasma-tau assays, grow at 9.10% CAGR, improving patient selection and trimming sample sizes 35%. Cardiovascular studies gained momentum with nine FDA approvals in 2025, while metabolic, infectious-disease, and immunology programs remain steady contributors.
By Sponsor Type: Pharma Leads, Public Funding Spurs Precision Oncology
Pharma and biopharma sponsors retained 68% share in 2025, directing late-stage budgets that often top USD 500 million per Phase III protocol. Government and non-profit bodies logged a 7.50% CAGR as NIH’s Cancer Moonshot steered USD 2.8 billion to 14 multicenter trials. Academic institutes covered 18% of activity, championing head-to-head comparisons the private sector avoids. Device makers and foundations further diversified the clinical trials market, especially in cardiovascular and infectious-disease fields.
Geography Analysis
North America controlled 49.20% of global revenue in 2025, stoked by FDA incentives, a high site density, and enrollment rates of 1.2 patients per site each month, 40% above Europe. Canada added 6% of regional studies, benefiting from protocol alignment with the United States, while Mexico gained prominence as ICON’s 2025 operations hub targeted 30% cost savings.
Asia-Pacific outpaced all regions at 7.90% CAGR through 2031, powered by China’s 62 IND clearances in 2025 and India’s 30-40% per-patient cost advantages. Conditional approvals for regenerative medicines in Japan and a 43.5% R&D tax refund in Australia further widened the region’s appeal. South Korea leveraged its national insurance database to supply real-world comparators for single-arm oncology designs.
Europe captured 28% market share in 2025 after the Clinical Trials Regulation slashed average approval time to 10 months and enabled simultaneous multi-country site activation. The UK’s rolling-review model enticed 14 rare-disease protocols in 2025. GCC nations funded landmark diabetes and oncology studies to diversify health economies, while Brazil and Argentina together made up 4% of global volume despite currency and import bottlenecks.

Regulatory Landscape
Global clinical trial execution is being reshaped by regulators codifying modern Good Clinical Practice expectations around risk-based quality management and technology-enabled operations. In June 2026, the ICH Assembly adopted ICH E6(R3) Annex 2 at Step 4, extending the fit-for-purpose GCP framework to decentralized and pragmatic trials and the use of real-world data, while EMA maintains ICH E6(R3) as the scientific guideline reference point for EU stakeholders.
In the United States, FDA actions in 2026 emphasized faster early development and operational modernization, including a June 2026 Federal Register public docket for the proposed Expedited IND pilot program to shorten time to first-in-human through rolling submission and more parallelized review steps. The UK implemented a clinical trials reform package in April 2026 via MHRA/HRA, including an accelerated modification route (Route B), and made ICH E6(R3) principles a legal requirement for UK trials. Health Canada also began applying ICH E6(R3), with a defined transition period for sponsors and research organizations to align systems and oversight processes.
Competitive Landscape
The top five CROs captured about 42% of 2025 revenue, leaving ample room for mid-tier and niche providers. IQVIA’s Orchestrated Clinical Trials suite won eight long-term contracts worth USD 3.2 billion, demonstrating sponsor appetite for unified platforms. Thermo Fisher’s 2024 acquisition of CorEvitas integrated registry data with trial workflows, signaling that real-world data capabilities are becoming essential. Novotech and Caidya outperformed in early-phase oncology by leveraging Asia-Pacific cost advantages and AI-based pharmacokinetic modeling that surfaced safety signals six days earlier than legacy monitoring.
AI-driven patient recruitment, blockchain-secured data integrity, and direct-to-patient delivery comprise emerging white-space opportunities as decentralized protocols head toward 40% of total trials by 2028. Technology-forward CROs secure awards 1.4 times faster than peers, while FDA warning letters—14 in 2025—continue to penalize low-compliance regions and reinforce the value of robust quality systems.
Clinical Trials Industry Leaders
IQVIA Holdings Inc.
Laboratory Corporation of America (Labcorp)
ICON plc
Parexel International Corp.
Syneos Health
- *Disclaimer: Major Players sorted in no particular order

Market Opportunities and Future Outlook
Regulatory modernization in 2025-2026 is creating specific whitespace for CROs and trial-technology vendors that can operationalize ICH E6(R3) and regulator-led pilots into auditable, scalable workflows. FDA workstreams on AI-enabled technologies and expedited pathways (including the June 2026 Expedited IND pilot program docket) are increasing demand for end-to-end digital traceability, protocol-to-data automation, and risk-based monitoring that can withstand inspection while compressing early-phase cycle times. In Europe, the European Commission publishing version 7.2 of the EU Clinical Trials Regulation Q&A in March 2026 is adding incremental clarity for sponsors coordinating multi-country starts, which supports investment in EU-ready start-up toolchains and governance models for multi-stakeholder data access.
Decentralized and hybrid trial components are shifting from adoption choices to baseline compliance expectations under modern GCP, expanding opportunities in direct-to-patient logistics, remote assessment validation, eConsent, and secure data operations that also reflect cross-border privacy constraints under GDPR and other national rules. Technology integration aligns with visible sponsor purchasing behavior, including CRO platform strategies and growing use of eClinical and analytics to reduce monitoring burden, shorten site selection, and accelerate safety signal detection. Providers that can pair decentralized operations with region-specific data residency controls and inspection-ready documentation have an advantage for multinational programs, particularly as sponsors diversify enrollment beyond saturated North American centers and increase Asia-Pacific participation where approval timelines can be faster in several jurisdictions.
Recent Industry Developments
- June 2026: ICON plc partnered with Microsoft to deploy Microsoft 365 Copilot and expand use of Azure and Fabric to scale ICONs agentic AI platform, Orbis. The move increases ICONs ability to embed generative AI into trial operations, data workflows, and delivery at enterprise scale, supporting sponsors seeking more integrated and automated execution models.
- May 2026: ICON plc expanded its US early phase research capabilities by opening a new Clinical Research Unit in San Antonio, Texas, and adding satellite clinics in Houston, Texas, and Lawrence, Kansas. The added early-phase capacity supports faster study start-up and participant access for first-in-human and complex protocols, which are increasingly constrained by site availability and operational throughput.
- May 2026: IQVIA expanded its strategic collaboration with Kexing Biopharm to accelerate global biosimilar development using AI-enabled clinical trial capabilities. The collaboration points to growing demand for AI-supported trial design and execution in programs that require efficient multinational development and evidence generation across multiple markets.


Research Methodology Framework and Report Scope
Market Definition and Coverage
This market covers revenue earned from planning, running, and closing human clinical trials, including protocol setup, site and patient enrollment, monitoring, data handling, and final reporting across the full trial life cycle.
Scope exclusions: spending on preclinical and animal research is excluded from this market sizing.
Segmentation Overview
- By Phase
- Phase I
- Phase II
- Phase III
- Phase IV
- By Study Design
- Interventional / Treatment Studies
- Observational Studies
- Expanded Access Studies
- By Service Type
- Protocol Design & Feasibility
- Site Identification & Start-Up
- Regulatory Submission & Approval
- Clinical Trial Monitoring
- Data Management & Biostatistics
- Medical Writing
- Other Service Types
- By Therapeutic Area
- Oncology
- Cardiovascular
- Neurology
- Infectious Diseases
- Metabolic Disorders (Diabetes, Obesity)
- Immunology / Autoimmune
- Other Therapeutic Areas
- By Sponsor Type
- Pharmaceutical & Biopharmaceutical Companies
- Medical Device Companies
- Academic & Research Institutes
- Government & Non-Profit Organizations
- Geography
- North America
- United States
- Canada
- Mexico
- Europe
- Germany
- United Kingdom
- France
- Italy
- Spain
- Rest Of Europe
- Asia-Pacific
- China
- Japan
- India
- South Korea
- Australia
- Rest Of Asia-Pacific
- Middle-East And Africa
- GCC
- South Africa
- Rest Of Middle East And Africa
- South America
- Brazil
- Argentina
- Rest Of South America
- North America
Data Sources, Market Sizing, and Validation
Desk Research
Desk work started with public trial and regulatory signals to estimate how much trial activity is occurring and how it changes by region and trial type. References included ClinicalTrials.gov and other national trial registries, the World Health Organization trial registry platform, and publications from regulators such as the FDA and the European Medicines Agency to keep the trial activity definitions aligned.
To translate activity into spend, we also used sponsor disclosures and broader health and R&D statistics, including OECD indicators and World Bank healthcare and macro series, plus selected peer reviewed journal articles on trial cost drivers and enrollment timelines. Company annual reports, investor presentations, and press releases were used to cross-check shifts in service mix, for example decentralized elements and outsourcing. Where detailed pricing or service mix was not fully visible in public sources, we used paid subscriptions for company financials and for patent and innovation signals to support assumptions. These sources are illustrative, and other public datasets were also reviewed for data collection, validation, and clarification.
Primary Interviews and Surveys
Primary calls and surveys were used to confirm how services are priced and bundled across trial phases, and how demand is shifting by therapeutic focus, site availability, and recruitment difficulty. We spoke with sponsors, service providers, and study site stakeholders across major regions, then revisited key assumptions when desk inputs and field feedback did not match.
Distribution of primary research fieldwork respondents
| Company type | Respondent position | Region |
|---|---|---|
| Top tier: 33% | CXOs: 17% | APAC: 47% |
| Mid tier: 49% | Functional/Unit leaders: 39% | EMEA: 33% |
| Smaller Players: 18% | Managers: 44% | Americas: 20% |
Market-Sizing & Forecasting
Sizing used a top-down approach, where trial volume signals and sponsor R&D allocation patterns were converted into an addressable spend pool, then split into services delivered across the trial workflow. To keep totals realistic, we cross-checked the outputs with selective bottom-up checks, such as rolling up a sample of service revenue disclosures and comparing implied spend per trial against field feedback.
Key model inputs included counts of initiated and ongoing trials by phase, average study duration and enrollment timelines, the share of trials using outsourced services, and the mix shift toward decentralized or hybrid execution. Regional cost intensity was adjusted based on site and investigator availability, where those signals were visible. When pricing or service mix data was not directly observable, gap handling used ranges confirmed in interviews, then applied conservative midpoints, followed by sensitivity checks.
For forecasting, we used scenario analysis so the baseline reflects how pipeline volume, outsourcing intensity, and operational complexity can move together over time. The forward view was adjusted only when multiple primary sources pointed to the same direction of change in assumptions, such as faster adoption of hybrid models or persistent recruitment delays in specific therapeutic areas.
Data Validation & Update Cycle
Validation relied on triangulation across independent signals, and we stress tested the model for unusual jumps in implied spend per trial, regional shares, and phase mix. Before sign-off, analyst teams reviewed the outputs, and any large variance triggered a recheck of inputs. If needed, we followed up with an interviewee to confirm the driver.
The report is refreshed annually, and interim updates are made when material events can shift trial activity or pricing assumptions. Immediately before delivery, we run a final pass to ensure the sizing and key inputs still match the latest public releases and recent primary feedback.
Mordor Intelligence's Clinical Trials Market Sizing Compared With Other Published Estimates
Different market values for clinical trials are often due to how publishers count revenue streams, and the base years and conversion timings they use. Divergence is larger when trial technology-related support, in-house sponsor costs, or adjacent preclinical work is either included or excluded.
Some external estimates blend broader R&D execution costs and in-house trial operations, which raises the total even when trial counts are comparable. For Mordor Intelligence, the value is limited to paid services tied to human Phase I to IV clinical trials (including planning, execution, and close-out work), and it excludes preclinical and animal research spending. This narrows the counted spend to a more service-based pool that can be audited against trial activity and service delivery assumptions.
Benchmark comparison
| Source | Market Size | Gaps in Research Methodology |
|---|---|---|
| Mordor Intelligence | USD 90.44 B (2025) | |
| Global Publisher A | USD 73.40 B (2025) | Uses a narrower spend capture that can undercount full-service execution and close-out work, and it can also apply more conservative assumptions on outsourcing penetration and service pricing by phase. |
| Industry Publisher B | USD 88.97 B (2025) | Often differs in how it treats decentralized and hybrid support spend, and the implied cost per trial can shift based on base-year inflation handling and currency timing used for regional aggregation. |
The table indicates that much of the spread comes from what is treated as trial services revenue versus broader operational or cost layers, and from how pricing and outsourcing intensity are set in the base year. Keeping scope tied to measurable trial activity and service delivery makes the resulting number easier to audit and repeat when assumptions are updated.


Key Questions Answered in the Report
How large is the clinical trials market today?
The clinical trials market size reached USD 95.97 billion in 2026 and is forecast to climb to USD 131.55 billion by 2031.
Which phase is growing the fastest?
Phase II protocols are expanding at a 6.80% CAGR through 2031 owing to adaptive designs that streamline dose selection and efficacy confirmation.
Why are decentralized trials gaining traction?
Decentralized models lift patient-retention rates to 85% and lower monitoring costs by replacing many on-site visits with telehealth and wearables.
Which region is projected to post the highest growth?
Asia-Pacific leads with a 7.90% CAGR, supported by regulatory reforms in China and cost advantages in India.
Who are the leading service providers?
IQVIA, Labcorp, ICON, Parexel, and Thermo Fisher's PPD division together account for about 42% of global CRO revenue.
What is the biggest operational hurdle for multinational trials?
Divergent data-privacy laws such as GDPR and China's PIPL add 8-18 weeks to timelines by requiring localized data storage and extra approvals.
Page last updated on:


