
Metrology Software Market Size and Share
Market Overview
| Study Period | 2020 - 2031 |
|---|---|
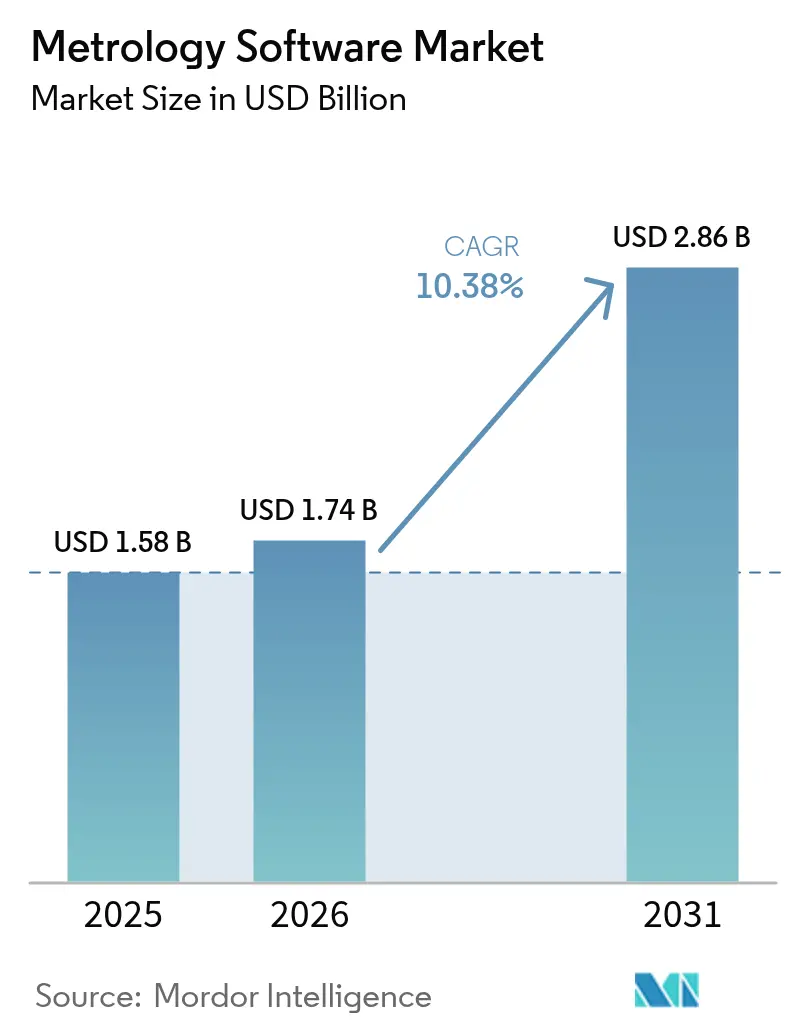
| Market Size (2026) | USD 1.74 Billion |
| Market Size (2031) | USD 2.86 Billion |
| Growth Rate (2026 - 2031) | 10.38 % |
| Fastest Growing Market | Asia Pacific |
| Largest Market | North America |
| Market Concentration | Medium |
Major Players *Disclaimer: Major Players sorted in no particular order Image © Mordor Intelligence. Reuse requires attribution under CC BY 4.0. | |
Metrology Software Market Analysis by Mordor Intelligence
The metrology software market size in 2026 is estimated at USD 1.74 billion, growing from 2025 value of USD 1.58 billion with 2031 projections showing USD 2.86 billion, growing at 10.38% CAGR over 2026-2031. Strong demand for dimensional accuracy across the automotive, aerospace, and medical device sectors, combined with digital transformation budgets, underpins the expansion. Sustained migration toward autonomous production lines requires software that can link measurement feedback directly to machine controls, safeguarding zero-defect initiatives. Strategic acquisitions by leading vendors expand integrated hardware-software ecosystems, intensifying competitive pressure. Cloud deployment gains traction as cybersecurity frameworks mature, while laser tracker technology reshapes large-volume inspection workflows.
Key Report Takeaways
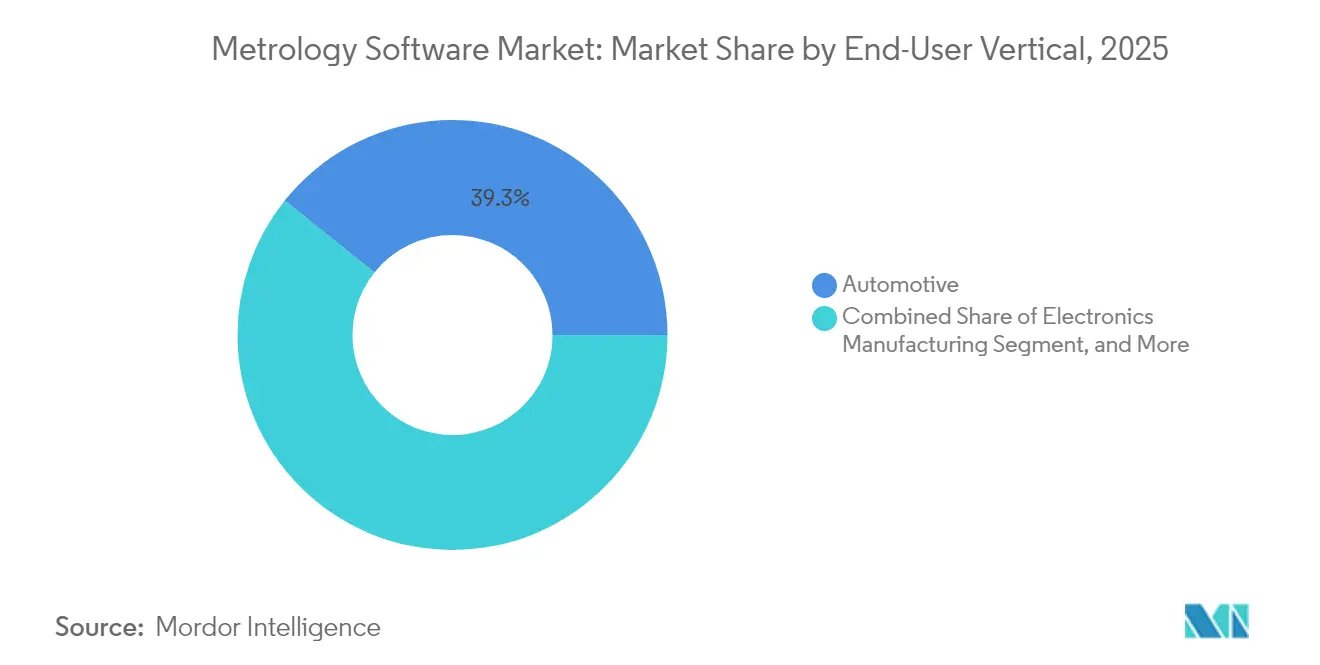
- By end-user vertical, consumer road vehicles led with a 39.25% revenue share in 2025, while medical devices are forecast to expand at a 10.55% CAGR through 2031.
- By deployment model, on-premise held 68.60% of the metrology software market share in 2025, while cloud-based options recorded the highest projected CAGR at 11.35% through 2031.
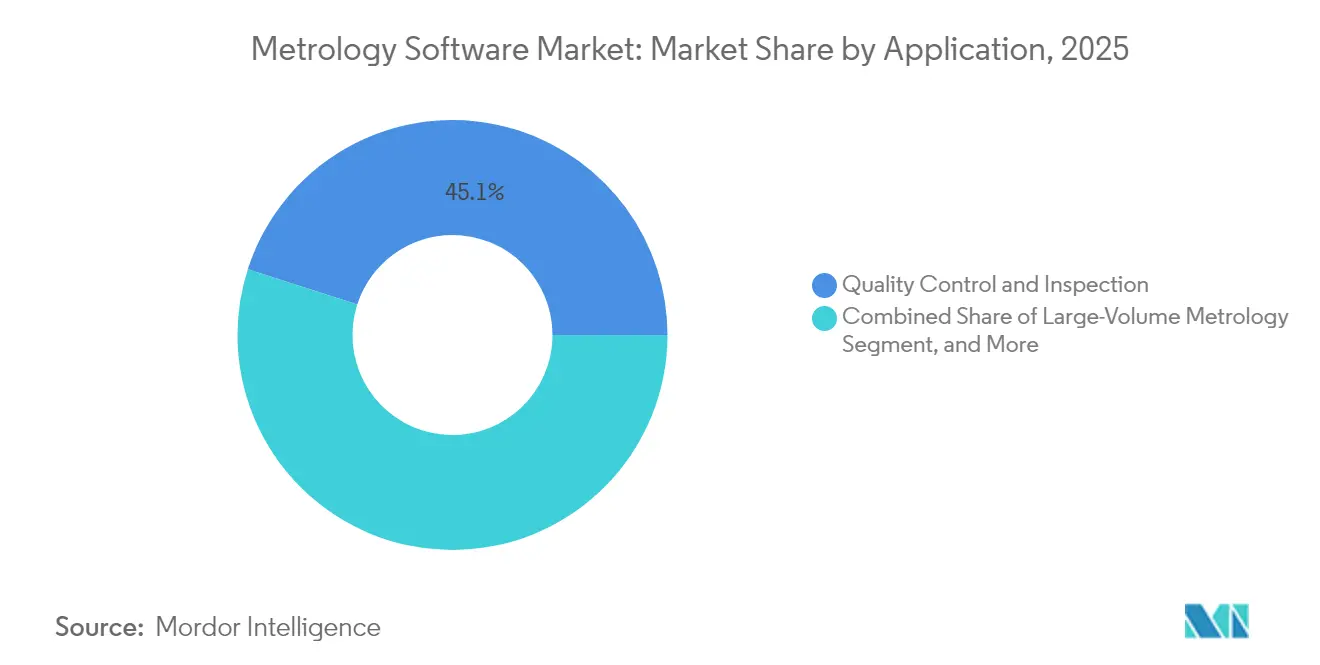
- By application, quality control and inspection accounted for a 45.05% share of the metrology software market size in 2025, while virtual simulation and digital twin are projected to advance at a 10.88% CAGR through 2031.
- By measurement device type, coordinate measuring machines commanded a 52.75% share of the metrology software market size in 2025, while laser trackers progressed at a 10.52% CAGR between 2026 and 2031.
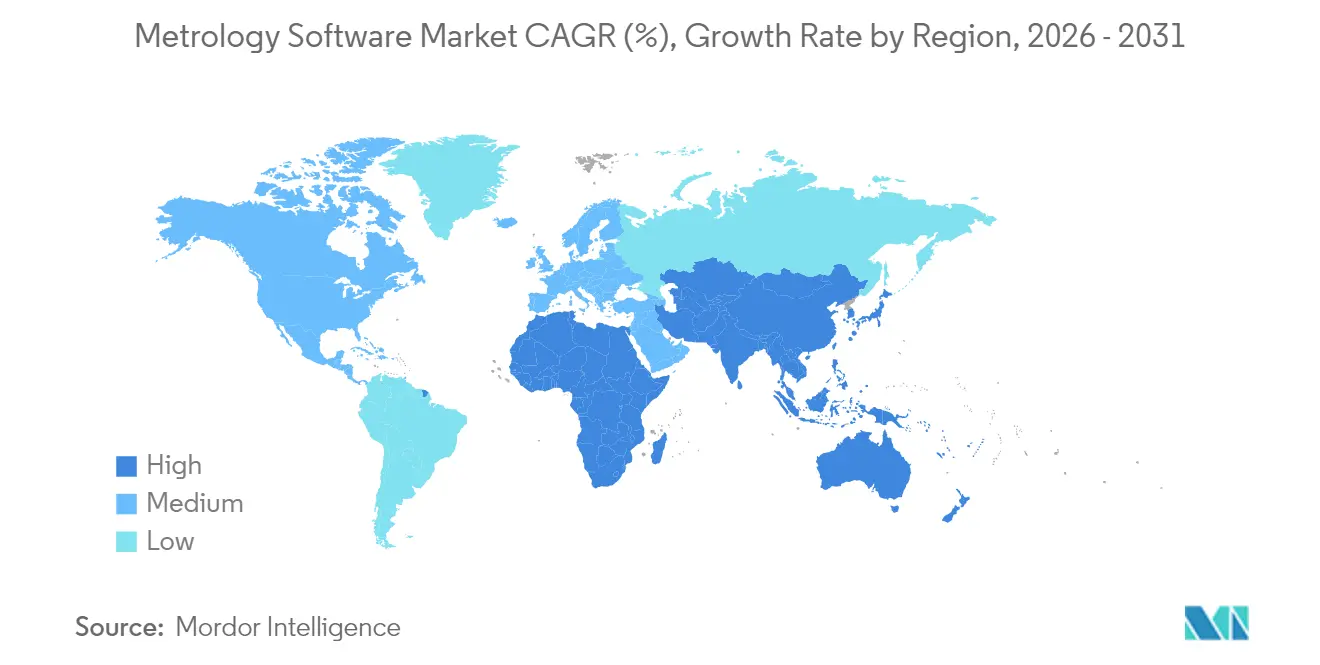
- By geography, North America maintained a 33.10% share in 2025, while the Asia Pacific is growing at the fastest rate, with a 10.62% CAGR through 2031.
Note: Market size and forecast figures in this report are generated using Mordor Intelligence’s proprietary estimation framework, updated with the latest available data and insights as of 2026.
Market Trends and Insights
Drivers Impact Analysis of Metrology Software Market*
| Driver | (~) % Impact on CAGR Forecast | Geographic Relevance | Impact Timeline |
|---|---|---|---|
| Rising Automation in Discrete and Process Manufacturing | +2.8% | Global, with Asia-Pacific core concentration | Medium term (2-4 years) |
| Demand for High Quality and Zero-Defect Products | +2.1% | North America and Europe, spill-over to Asia-Pacific | Long term (≥ 4 years) |
| Shift Toward Cloud-Based Metrology Platforms | +1.9% | Global, early adoption in North America and EU | Short term (≤ 2 years) |
| Integration With Industry 4.0 Digital Twins | +1.7% | Europe and North America core, expansion to Asia-Pacific | Medium term (2-4 years) |
| Adoption in Additive Manufacturing Quality Assurance | +1.2% | North America and Europe, emerging in Asia-Pacific | Long term (≥ 4 years) |
| LiDAR and Radar Calibration Needs in Autonomous Vehicles | +0.9% | Global automotive hubs, concentrated in Germany, Japan, US | Medium term (2-4 years) |
| Source: Mordor Intelligence | |||
Rising Automation in Discrete and Process Manufacturing
Manufacturers invest in automated inspection cells that merge programmable logic controllers with metrology software, creating closed-loop quality control that cuts scrap by up to 25% in automotive body panels. Coordinate measuring machines, optical scanners, and industrial robots communicate through standardized protocols, enabling round-the-clock operations. Electronics assemblers transition to lights-out production, relying on automated deviation alerts to correct tool offsets before defects propagate. Semiconductor producers embed dimensional data into advanced process control, driving continuous parametric tuning. Software vendors respond with modular application programming interfaces that simplify hardware integration and shorten installation timelines.
Demand for High Quality and Zero-Defect Products
Medical device and aerospace suppliers embed statistical process control within metrology platforms to detect micrometer-level drift before components enter final assembly, averting costly recalls.[1]U.S. Food and Drug Administration, “Electronic Records and Signatures 21 CFR Part 11,” fda.gov Electric vehicle battery plants trace every electrode dimension back to the cell barcode, ensuring compliance with functional safety rules while minimizing rework budgets. The adoption of Six Sigma disciplines elevates measurement data analytics from an optional add-on to a core manufacturing requirement. Tier-one automotive suppliers report warranty cost reductions when software-driven inspections replace manual gauges. Strict supplier scorecards encourage downstream adoption, spreading metrology software into stamping, casting, and molding sub-tiers.
Shift Toward Cloud-Based Metrology Platforms
Cloud architecture reduces capital outlay and enables software updates to be pushed through secure pipelines, delivering new algorithms without service downtime.[2]Microsoft Corporation, “Azure IoT Industrial Solutions,” azure.microsoft.com Multisite manufacturers gain a single repository for dimensional data, allowing cross-plant benchmarking that reveals systemic tool wear or training gaps. Hybrid configurations keep latency-sensitive processing at the edge while sending aggregated results to the cloud for machine learning analysis. Smaller firms leverage subscription models that bundle infrastructure, lowering entry barriers for advanced inspection analytics. Vendor ecosystems incorporate role-based access controls and multifactor authentication, addressing data sovereignty requirements in regulated sectors.
Integration With Industry 4.0 Digital Twins
Digital twin projects rely on metrology software to validate virtual models against physical components throughout product life cycles.[3]Dassault Systèmes, “3DEXPERIENCE Platform Solutions,” 3ds.com Aerospace engine builders scan blades during machining, feed the cloud twin, and simulate airflow to optimize maintenance intervals. Consumer electronics firms compare printed circuit board dimensions against CAD to accelerate design iterations. The merging of simulation and measurement data creates feedback loops that refine virtual prototypes, cutting verification cycles from weeks to days. Artificial intelligence embedded in metrology platforms predicts tolerance shifts based on historical variation, enabling prescriptive adjustments.
Restraints Impact Analysis of Metrology Software Market*
| Restraint | (~) % Impact on CAGR Forecast | Geographic Relevance | Impact Timeline |
|---|---|---|---|
| High Initial Cost and Integration Complexity | -1.8% | Global, particularly affecting SMEs in developing markets | Short term (≤ 2 years) |
| Shortage of Skilled Metrology Software Professionals | -1.2% | Global, acute in Asia-Pacific emerging markets | Long term (≥ 4 years) |
| Limited Interoperability With Legacy Measurement Hardware | -0.9% | North America and Europe with aging infrastructure | Medium term (2-4 years) |
| Cybersecurity Concerns in Cloud Deployments | -0.7% | Global, regulatory compliance focus in EU and US | Short term (≤ 2 years) |
| Source: Mordor Intelligence | |||
High Initial Cost and Integration Complexity
Bundling licenses, calibration fixtures, and project engineering quickly escalates budgets for small manufacturers, deterring adoption despite productivity gains. Integration projects often exceed original timelines when legacy gauges require custom drivers. Consultants bill additional hours to harmonize data formats, elevating the total cost of ownership. Companies also incur indirect costs associated with training operators during the ramp-up period. Return on investment assessments remain challenging when manual inspection already meets customer tolerance targets, leading to hesitant procurement cycles.
Shortage of Skilled Metrology Software Professionals
Universities often emphasize mechanical or software curricula in isolation, leaving many graduates proficient in neither uncertainty analysis nor Python scripting. Experienced quality engineers lack code competencies needed for automation, while software developers seldom understand gauge repeatability. Consequently, manufacturers rely on external partners for configuration and maintenance, which creates bottlenecks and increases service fees. Without a robust talent pipeline, deployment speed lags behind the innovation pace, constraining the expansion of the metrology software market.
*Our forecasts treat driver/restraint impacts as directional, not additive. The impact forecasts reflect baseline growth, mix effects, and variable interactions.
Metrology Software Market Segment Analysis
By End-User Vertical:
Medical Devices Accelerate Precision DemandsThe medical category is expected to account for a 10.55% CAGR through 2031, while the automotive domain is projected to retain a 39.25% market share of metrology software in 2025. Acute regulatory oversight requires validated audit trails, which only specialized platforms can deliver. Implant miniaturization drives upgrades to coordinate measuring machines for sub-micrometer accuracy. Aerospace continues to rely on large-volume laser tracker setups that map fuselage joins in situ. Energy projects utilize metrology software for wind blade aerodynamics, leveraging edge analytics to analyze vibration data.
Growth in road vehicles stabilizes, yet battery cell lines demand new analytics that predict volume expansion and electrode misalignment. Electronics assemblers integrate optical digitizers within automated optical inspection to verify surface-mount component coplanarity at scale. Consumer goods producers are starting to migrate from sample-based checks to 100% in-line inspection as brand protection strategies become increasingly stringent. Over the forecast horizon, medical innovation in personalized implants is expected to sustain premium licensing, reinforcing the shift toward software that supports continuous validation.



By Deployment Model:
Cloud Uptake QuickensCloud deployments reached an 11.35% CAGR, eroding on-premise dominance that represented 68.60% of the metrology software market size in 2025. Multinationals employ hybrid strategies that retain sensitive datasets on-site while moving non-classified analyses to managed environments. Subscription pricing converts capital expenditures into operating expenses, appealing to small enterprises that lack server budgets. Vendor-operated infrastructure offloads patch management, shortening vulnerability windows. Nevertheless, defense and nuclear segments still favor air-gapped installations, ensuring niche demand for on-premise sales.
Edge nodes now perform time-critical calculations adjacent to production lines, forwarding only the results to the cloud for trend analysis. This architecture satisfies latency thresholds without compromising central visibility. Machine learning models trained in the cloud return optimized sampling patterns to edge devices, boosting throughput without hardware upgrades. As cybersecurity certifications mature, audit departments become more comfortable with distributed architectures, bolstering expansion across regulated verticals.
By Application:
Virtual Simulation Gains GroundQuality control and inspection retained a 45.05% share of the metrology software market size in 2025, due to the mandatory dimensional verification of every high-value part. Yet virtual simulation and digital twin logged an 10.88% CAGR, becoming the focal point for continuous engineering loops. Designers import live measurement feedback directly into CAD, eliminating the need for prototype iterations. Reverse engineering tools that convert point clouds into parametric models eliminate the need for manual surfacing on legacy parts. Tool and die shops track wear patterns using automated trend charts, which extend maintenance intervals.
Large-volume metrology leverages laser trackers in shipbuilding and energy turbine alignment, allowing on-site validation without disassembly. Additive manufacturing utilizes layer-wise scanning integrated into build processors, bridging the gap between slice simulation and confirmation of as-built geometry. Across all applications, ISO 10360 conformance modules assure traceable reporting, easing customer audits.
By Measurement Device Type:
Laser Trackers RiseCoordinate measuring machines held 52.75% market share in 2025, anchoring traditional dimensional programs. The laser tracker category registered a 10.52% CAGR in demand for portable, large-volume solutions. Optical digitizers and scanners gained share in surface-rich applications such as body panels, driving tighter integration with reflectivity compensation algorithms. Structured light systems enhance throughput for consumer electronics, capturing millions of points per second with high accuracy.
Portable articulated arms remain indispensable for maintenance crews inspecting installed machinery. Artificial intelligence within device firmware optimizes probe paths in real time, reducing cycle duration by up to 30%. Improved calibration routines account for temperature gradients, thereby extending field operation windows. Vendors bundle device control software and analytics modules, thereby strengthening lock-in and reinforcing the trend of a holistic ecosystem in the metrology software market.
Geography Analysis
North America Metrology Software Market
North America held a 33.10% market share of the metrology software market in 2025, owing to its mature aerospace, automotive, and medical manufacturing clusters that demand validated measurement workflows. Federal initiatives encouraging reshoring promote capital investment in smart quality systems, while ongoing artificial intelligence research accelerates the adoption of predictive analytics. Cloud providers headquartered in the region offer compliance-ready environments, easing the migration process for multi-site manufacturers. Export-oriented suppliers leverage metrology data to support global customer audits, sustaining software update cycles.
APAC Metrology Software Market
Asia Pacific grew fastest at 10.62% CAGR, propelled by China’s shift toward high-value production and India’s escalating precision engineering exports. Semiconductor fabs across Taiwan and mainland China deploy automated optical metrology in sub-10 nm processes, mandating real-time analytics. Japan’s advanced robotics sector embeds measurement feedback within assembly cells to enhance uptime. South Korean shipbuilders utilize large-volume laser trackers to align hull blocks, thereby improving fit accuracy and reducing dry-dock delays. Regional governments subsidize Industry 4.0 pilots, catalyzing the adoption of Industry 4.0 among small manufacturers in Vietnam, Thailand, and Malaysia.
Europe Metrology Software Market
Europe sustains steady growth, anchored by automotive electrification and stringent environmental standards that require lifecycle measurement traceability. German machine tool builders integrate metrology software inside control loops, exporting turnkey precision lines worldwide. The United Kingdom’s aerospace composites sector demands non-contact inspection for complex curves, spurring scanner innovation. Data protection regulations influence cloud architecture, prompting vendors to shift toward European data centers with stringent access controls. Circular economy targets create secondary demand for remanufacturing inspection modules that certify reusable components.

Regulatory Landscape
Metrology software suppliers serving regulated measurement workflows increasingly align with legal metrology guidance that treats software integrity as a market-access requirement, not just a quality feature. In the United States, NIST guidance on software-controlled instruments and the annualized NIST Handbook 44 (2026 edition) anchor state and local enforcement expectations for accurate, auditable transactions, while NTEP Publication 14 is widely referenced for addressing software vulnerabilities and fraud prevention in commercial devices.
In Europe, software-related controls for instruments placed under the Measuring Instruments Directive (MID) are operationalized through WELMEC Guide 7.2 (2025 edition), which details risk-based requirements for software separation, parameter protection, and event logging. Internationally, OIML D 31 provides baseline requirements for software-controlled measuring instruments, reinforcing security and traceability expectations that cascade into vendor validation and documentation practices. Separately, trade actions can influence metrology-adjacent supply chains: a US Federal Register action effective January 15, 2026 imposed a 25% duty on specified semiconductor manufacturing equipment with limited exemptions, raising compliance and sourcing complexity for organizations tying metrology analytics to semiconductor production environments.
Value Chain Analysis
The metrology software value chain spans sensor and measurement hardware (CMMs, scanners, laser trackers, microscopes), embedded firmware and device control layers, core metrology applications (inspection programming, point-cloud processing, uncertainty reporting), and enterprise integration into CAD/PLM/MES and cloud data platforms. Component and algorithm inputs come from optics and sensor suppliers, numerical computation libraries, and 3D data translation toolkits, while system integrators and OEM application teams configure workflows on shop floors and validate them against customer and regulatory audit needs. Distribution is commonly routed through OEM hardware channels, specialist resellers, and direct enterprise accounts, with service revenue tied to deployment, calibration alignment, training, and ongoing workflow optimization.
Interoperability and data plumbing are explicit midstream dependencies, reflected in partner programs and 3D exchange infrastructure. InnovMetric expanded its PolyWorks Digital Thread partnership program (with partners such as High QA, AutoForm, and Duwe-3d) and hardware-software integration partnerships such as PMT Technologies collaboration with InnovMetric, aiming to reduce file-based handoffs and accelerate closed-loop quality. On the enabling-software side, Tech Soft 3D joined the Alliance for OpenUSD (AOUSD) and added USD export support in HOOPS Exchange to improve 3D interoperability into digital twin and NVIDIA Omniverse workflows, strengthening upstream-to-downstream flow of CAD and measurement data. Bottlenecks persist where high-precision metrology capacity is constrained in semiconductor process control ecosystems, which keeps attention on distributed metrology, no-code usability, and service-based capacity sharing concepts discussed across industry and academic work.
Competitive Landscape
Industry consolidation remains moderate as hardware titans absorb niche software firms to expand vertically. Hexagon acquired Geomagic to fuse scanning algorithms with existing coordinate measuring machine platforms, creating end-to-end ecosystems. ZEISS invested in additive manufacturing modules to cover powder bed fusion inspection, signaling targeted portfolio widening. Renishaw strengthened its automotive and aerospace presence by buying PowerINSPECT, leveraging cross-sell synergies among probe systems.
Technology differentiation now centers on artificial intelligence and cloud scalability. Vendors race to patent machine learning routines that predict drift, flagging wear before tolerance breaches occur. Interoperability layers become critical; customers demand vendor-agnostic interfaces to protect legacy investments. Pure-play software startups compete by specializing in autonomous vehicle sensor calibration, offering lightweight apps that integrate with plant data lakes.
Small and medium enterprises represent the next battleground. Subscription tiers, simplified dashboards, and pre-configured analytics aim to democratize metrology software. Service models are shifting toward outcome-based contracts, where vendors guarantee inspection cycle time or defect reduction, creating recurring revenue streams beyond license sales.
Metrology Software Industry Leaders
Nikon Metrology NV
3D Systems Corporation
Creaform Inc. (AMETEK Inc.)
FARO Technologies Inc.
Carl Zeiss AG
- *Disclaimer: Major Players sorted in no particular order

Metrology Software Market Companies Covered in this Report
- Nikon Metrology NV
- 3D Systems Corporation
- Creaform Inc. (AMETEK Inc.)
- FARO Technologies Inc.
- Carl Zeiss AG
- Hexagon AB
- LK Metrology Ltd.
- Renishaw plc
- Perceptron Inc. (Atlas Copco AB)
- InnovMetric Software Inc.
- Fluke Corporation
- Metrologic Group SA (Sandvik AB)
- Autodesk Inc.
- Dassault Systèmes SE
- Verisurf Software Inc.
- Mapvision Ltd.
- GOM GmbH (Carl Zeiss AG)
- Capture 3D LLC
- Stratasys Ltd. (Control Software)
- Software Point Oy

Market Opportunities and Future Outlook
A standards-led automation whitespace is emerging for model-based workflows, where metrology software can convert product definition into consistent, machine-readable inspection intent across the lifecycle. In June 2026, the Digital Metrology Standards Consortium (DMSC) announced that its Model-Based Characteristics (MBC) v1.0 (DMSC MBC v1.0 - 2026) was approved by ANSI as an American National Standard, strengthening the business case for software that natively consumes MBC alongside established digital thread standards such as QIF, STEP AP242, OPC UA, and MTConnect. Vendors with robust translators, validation utilities, and enterprise connectors are positioned to win programs moving from drawing-based inspection plans to model-based inspection characteristics and automated reporting.
Another opportunity centers on production-integrated metrology, where software shifts from post-process verification to in-line decision support at the edge and in the cloud. Manufacturers adopting closed-loop quality in automotive, aerospace, medical devices, and semiconductors are looking for metrology platforms that integrate with PLCs and MES/PLM, connect into digital twin environments, and operationalize analytics for drift detection and root-cause correlation beyond producing dimensional reports. There is also room for packaged solutions that reduce integration complexity for SMEs, including preconfigured connectors, role-based governance for cloud/hybrid deployments, and vendor-supported interoperability programs that shorten time-to-value while preserving traceability and auditability.
Recent Industry Developments in Metrology Software Market
- May 2026: Nikon Metrology launched the ECLIPSE LV100AMS automated microscope with integrated AI-powered image analysis for industrial quality control. The release expands Nikon's automated inspection stack into microscopy-driven metrology use cases where software-assisted classification and repeatable workflows support higher-throughput quality control.
- November 2025: Creaform expanded its service infrastructure in the United States and Mexico, adding service centers and performance check kits alongside calibration support for HandySCAN 3D EVO, BLACK, and MAX series. This investment strengthens regional uptime and calibration readiness, which helps software-driven inspection workflows scale across distributed manufacturing sites.
- October 2024: AMETEK acquired Virtek Vision International to enhance automated 3D scanning and inspection capabilities within the Creaform business. The combination adds complementary automation and verification technologies that can be integrated into metrology software workflows for higher-volume inspection and factory automation deployments.


Metrology Software Market Report Scope and Research Methodology
Market Definition and Coverage
This market covers paid software used to plan, run, and analyze industrial measurement and inspection work, where the results are turned into dimensional reports, tolerances, and quality records. It includes common deployment models used by manufacturing and engineering teams across regions.
Scope exclusions: We exclude metrology hardware sales, pure calibration services, and general CAD/PLM tools that do not primarily deliver measurement, inspection, or quality reporting outputs.
Segments Covered in This Report
- By End-User Vertical
- Automotive
- Aerospace
- Electronics Manufacturing
- Energy and Power
- Medical Devices
- Other End-User Verticals
- By Deployment Model
- On-Premise
- Cloud-Based
- By Application
- Quality Control and Inspection
- Reverse Engineering
- Tool and Die Manufacturing
- Virtual Simulation and Digital Twin
- Large-Volume Metrology
- By Measurement Device Type
- Coordinate Measuring Machines (CMM)
- Optical Digitizers and Scanners
- Portable Arms
- Laser Trackers
- Structured Light Scanners
- Other Measurement Device Types
- By Geography
- North America
- United States
- Canada
- Mexico
- Europe
- Germany
- United Kingdom
- France
- Russia
- Rest of Europe
- Asia-Pacific
- China
- Japan
- India
- South Korea
- Australia
- Rest of Asia-Pacific
- Middle East and Africa
- Middle East
- Saudi Arabia
- United Arab Emirates
- Rest of Middle East
- Africa
- South Africa
- Egypt
- Rest of Africa
- Middle East
- South America
- Brazil
- Argentina
- Rest of South America
- North America
Data Sources, Market Sizing, and Validation
Desk Research
Desk work starts by mapping what is being measured and where software sits in the workflow, so the model reflects real usage instead of just vendor messaging. We relied on public and official sources such as manufacturing and industrial production series from the US Census Bureau, Eurostat, and national statistics offices, plus NIST publications that help ground metrology standards and terminology.
To make the assumptions practical, we also used sources such as ISO-related public guidance, peer reviewed manufacturing and quality engineering journals, and trade and shipment indicators from UN Comtrade where available for connected equipment categories. Company filings, product datasheets, and investor presentations were used to understand licensing patterns, software bundling, and typical buyer groups. For cross checks, we referenced paid subscriptions that support company financials and market intelligence, news and financial sources, and patent databases to validate product focus and timing of new releases. These examples are not exhaustive, and many other public sources were also used for data collection, validation, and clarification.
Primary Interviews and Surveys
Primary work focused on interviews and surveys with software publishers, system integrators, metrology leads in manufacturing sites, and quality managers who operate inspection programs day to day. The discussions covered pricing approaches (subscription versus perpetual), typical seat counts, adoption in automotive and aerospace lines, and how cloud usage is actually approved and deployed across regions, then we tuned the assumptions where desk inputs were unclear.
Distribution of primary research fieldwork respondents
| Company type | Respondent position | Region |
|---|---|---|
| Top tier: 25% | CXOs: 13% | APAC: 46% |
| Mid tier: 59% | Functional/Unit leaders: 33% | EMEA: 32% |
| Smaller Players: 16% | Managers: 54% | Americas: 22% |
Market-Sizing & Forecasting
Sizing starts with a top-down build where manufacturing output and quality control intensity are used to reconstruct the addressable demand pool for measurement software across key industrial bases, then spending is allocated by typical deployment patterns. Once that structure is in place, we run selective bottom-up checks, such as sampled license pricing times estimated active seats, channel feedback on common bundles, and supplier revenue direction checks, which helps adjust totals when one input looks overstated.
The model uses a set of market fingerprints that can be repeatedly tracked, including the installed base and purchase cycles of measurement devices that the software connects to (CMMs, optical systems, and 3D scanners), the share of automated inspection in production lines, average licenses per site by end use, and the shift between on-premises and cloud deployments. We also track indicators such as factory automation investment trends, the pace of new product launches and feature upgrades, and currency translation timing for multi-region revenue.
For forecasting, scenario analysis is used so growth can be tested under different manufacturing cycle and automation adoption paths, then the final trajectory is aligned to expert consensus gathered during interviews. Where bottom-up signals are missing for smaller regions or niche applications, we fill gaps using proxy adoption rates from similar industries and apply conservative ASP progression until corroboration is obtained.
Data Validation & Update Cycle
Validation is done by comparing the model outputs against independent signals, such as industrial production movement, automation investment sentiment, and software revenue direction from public disclosures, then mismatches are investigated before finalizing. When unusual jumps show up, we recheck the driver assumptions, review currency treatment, and, if needed, recontact select interviewees to confirm what changed in buying behavior.
Each report goes through multi-step analyst reviews where inputs, calculations, and logic are checked for internal consistency and for alignment with the defined scope. The study is refreshed on an annual cycle, and interim updates are triggered when material events occur, such as major regulatory shifts affecting quality compliance or notable changes in manufacturing demand. Before delivery, a final pass is performed so clients receive the most current view available at that time.
Mordor Intelligence's Metrology Software Market Size Compared With Other Published Estimates
Published market sizes for metrology software often vary, even when the topic name looks the same, because the included items and measurement rules are not always consistent. Differences usually come from what is counted as software versus services, how bundled licenses are treated, and whether the estimate is anchored to manufacturing demand signals or to supplier-side claims.
The table also shows that the spread is largely explained by scope and timing choices, since some sources anchor on an earlier base year and then apply a uniform growth path, while others bundle adjacent offerings like services, implementation, or broader quality management software. Currency conversion dates and the way cloud subscriptions are annualized can also move the total up or down, especially when regions are summed with different exchange rate assumptions.
Benchmark comparison
| Source | Market Size | Gaps in Research Methodology |
|---|---|---|
| Mordor Intelligence | USD 1.74 B (2026) | |
| Global Consultancy A | USD 1.57 B (2024) | Uses a 2024 base and a faster growth path through 2030, and it appears to mix software with broader offering buckets, which can shift totals depending on how device-linked applications are classified. |
| Trade Journal B | USD 0.81 B (2024) | Starts from a narrower software-only revenue view that tends to undercount bundled enterprise licenses and multi-site seat expansions, and it applies a slower subscription ramp that reduces the forward curve. |
The table points to timing and bundling as the biggest gap drivers, and in Mordor Intelligence's model, only metrology-specific software value is counted when it is directly tied to measurement and inspection workflows, with services and general quality platforms kept out. With that scope kept consistent and checked against device adoption and manufacturing activity indicators, the resulting number stays traceable to a clear demand pool and repeatable steps that can be reviewed and updated each year.


Key Questions Answered in the Report
What is the current value of the metrology software market?
The metrology software market size equals USD 1.74 billion in 2026.
How fast will the market expand over the next five years?
Revenue is forecast to rise at a 10.38% CAGR, reaching USD 2.86 billion by 2031.
Which end-user segment grows quickest?
Medical devices advance fastest with a 10.55% CAGR through 2031 due to stringent FDA validation.
Why are laser trackers gaining popularity?
Laser trackers grow at a 10.52% CAGR because large-volume industries need portable, high-precision inspection
How does cloud deployment benefit manufacturers?
Cloud platforms cut upfront costs, centralize analytics, and enable machine learning insights without heavy on-site infrastructure.
Which region shows the highest growth momentum?
Asia Pacific records the highest regional CAGR of 10.62% driven by China’s manufacturing upgrades and India’s precision engineering surge.
Page last updated on:


 Your data is secure and never sold or shared.


