3D Mapping And 3D Modelling Market Size and Share
Market Overview
| Study Period | 2020 - 2031 |
|---|---|
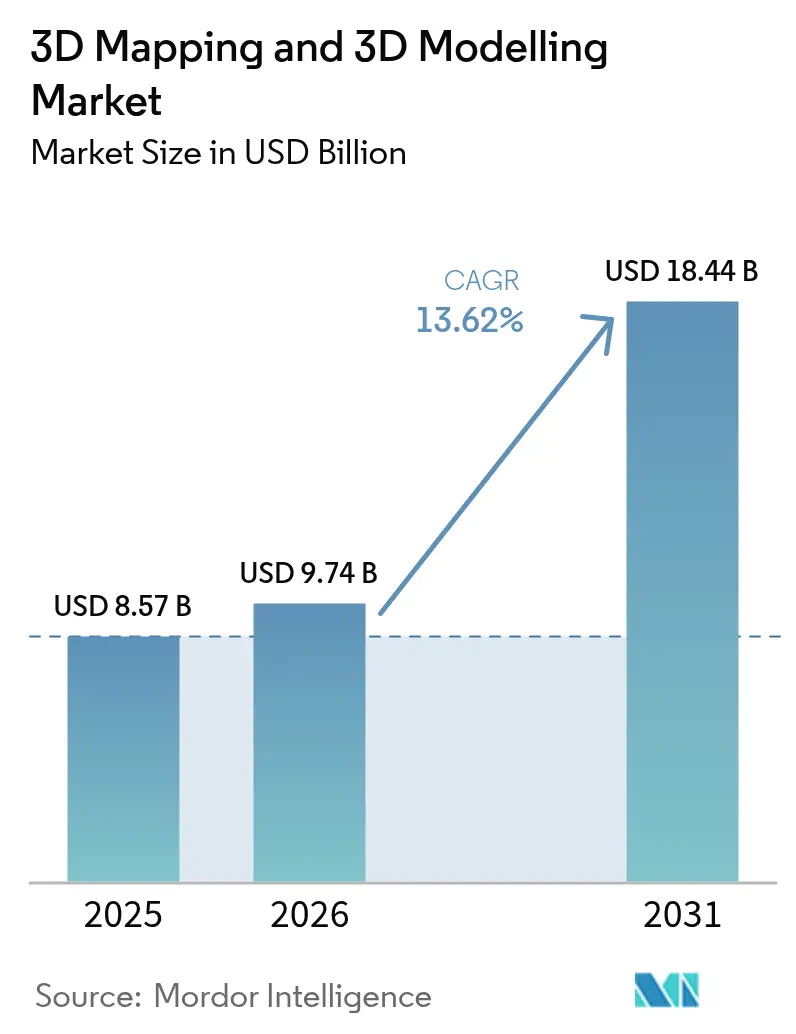
| Market Size (2026) | USD 9.74 Billion |
| Market Size (2031) | USD 18.44 Billion |
| Growth Rate (2026 - 2031) | 13.62% CAGR |
| Fastest Growing Market | Asia Pacific |
| Largest Market | North America |
| Market Concentration | Medium |
Major Players *Disclaimer: Major Players sorted in no particular order Image © Mordor Intelligence. Reuse requires attribution under CC BY 4.0. | |
3D Mapping And 3D Modelling Market Analysis by Mordor Intelligence
The 3D mapping and 3D modelling market size is expected to grow from USD 8.57 billion in 2025 to USD 9.74 billion in 2026 and is forecast to reach USD 18.44 billion by 2031 at a 13.62% CAGR over 2026-2031. Steady expansion reflects the convergence of smartphone-embedded LiDAR, generative artificial intelligence design suites, and regulatory mandates that require digital twins for large public infrastructure projects. Cloud-native rendering continues to lower the total cost of ownership for small and medium enterprises, while real-time 3D content pipelines in entertainment and retail are driving demand for high-polygon models. Automotive and autonomous-vehicle programs are widening the addressable base for centimeter-level 3D geospatial updates, and healthcare is rapidly validating patient-specific anatomical modelling for complex surgical planning.
Key Report Takeaways
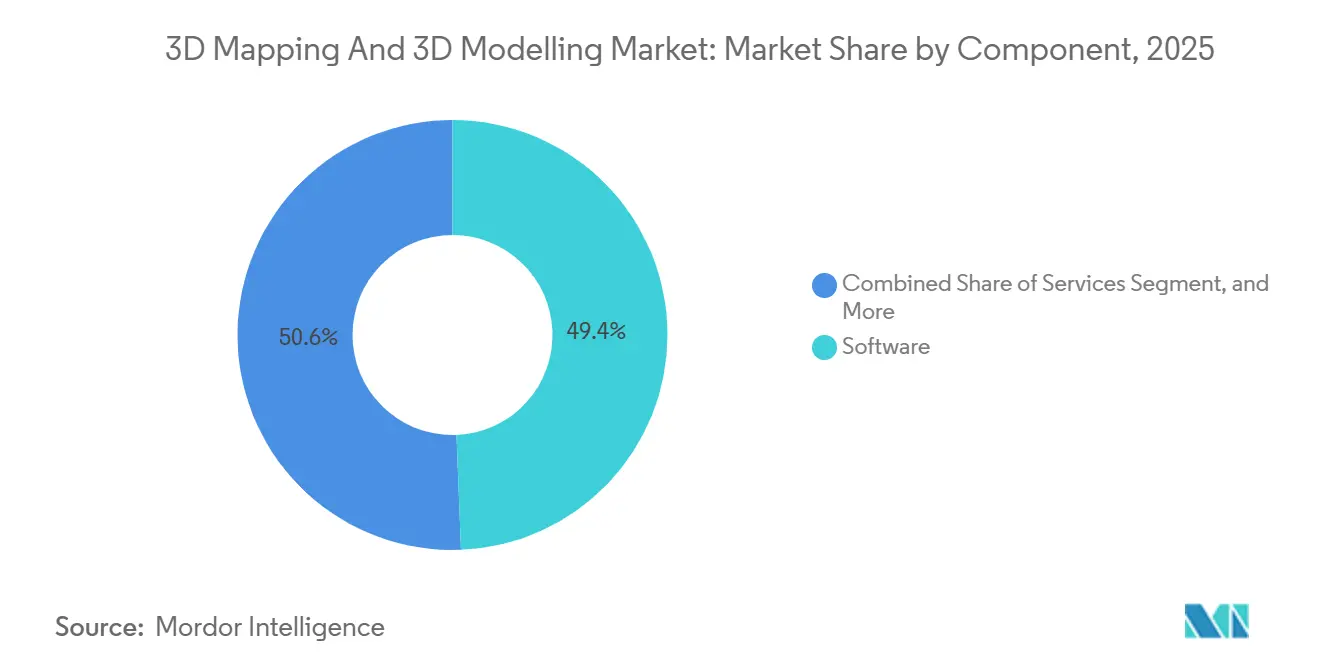
- By component, software led with 49.37% market share in 3D mapping and 3D modelling market in 2025, whereas services are projected to expand at a 14.28% CAGR through 2031.
- By type, 3D modelling accounted for 63.84% of revenue in 2025, while 3D mapping is set to post a 14.03% CAGR on the back of smart-city and autonomous-vehicle programs.
- By application, 3D rendering and visualisation accounted for 38.91% of the 3D mapping and 3D modelling market size in 2025; projection mapping is forecast to grow at 14.47% through 2031.
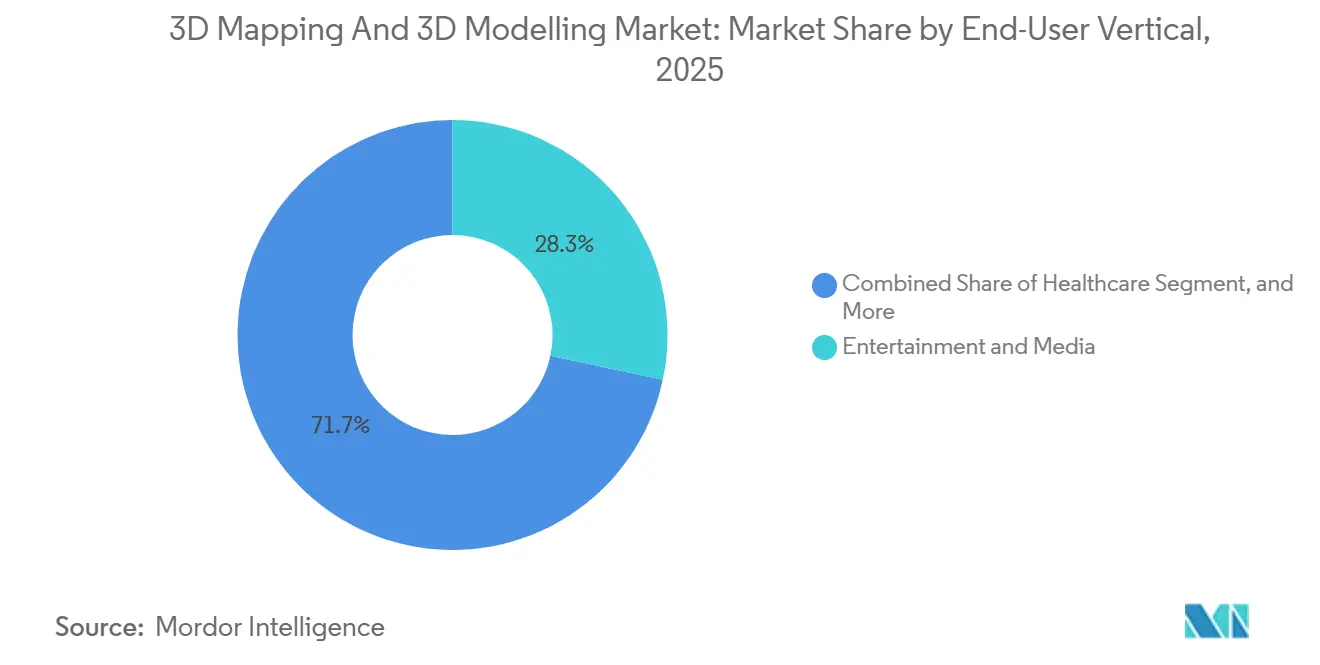
- By end-user vertical, entertainment and media dominated with 28.33% of revenue in 2025, but healthcare is expected to lead growth with a 14.61% CAGR to 2031.
- By deployment, cloud implementations accounted for 63.49% of 2025 revenue and are advancing at a 14.08% CAGR as enterprises pivot from capital to operational expenditure models.
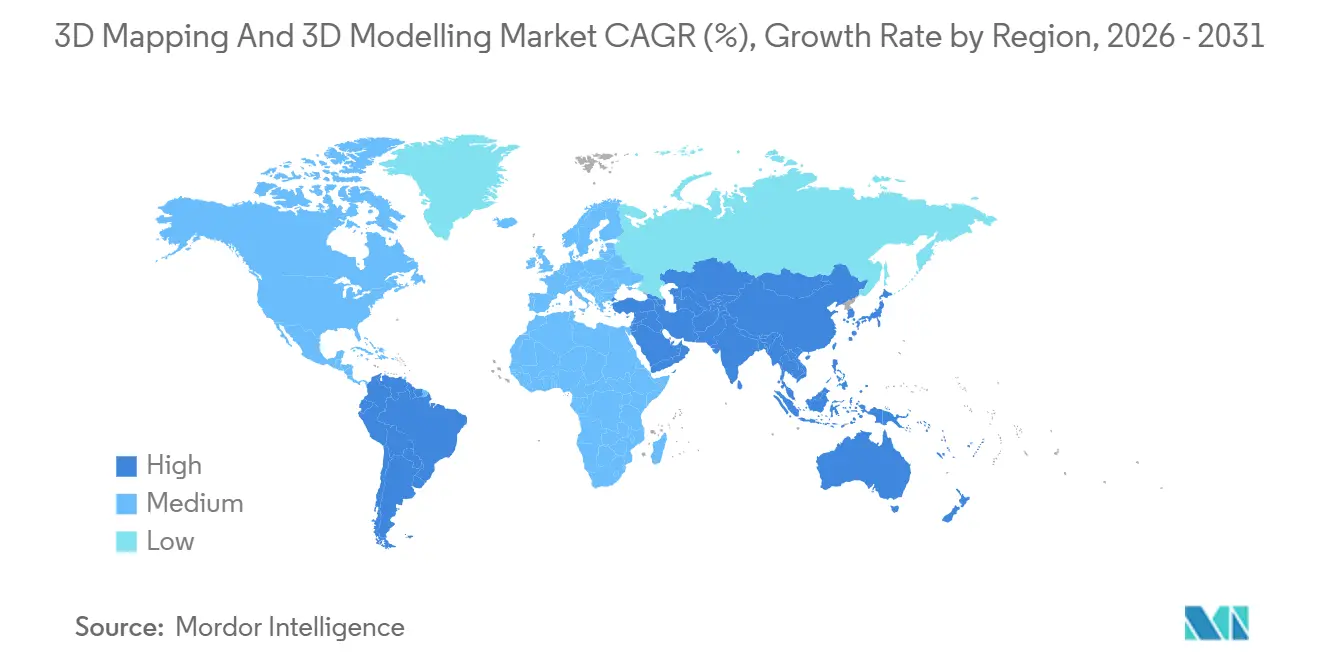
- By geography, North America accounted for 36.78% of 2025 turnover, while Asia-Pacific is poised to register the fastest 14.67% CAGR, driven by large-scale smart-city investments.
Note: Market size and forecast figures in this report are generated using Mordor Intelligence’s proprietary estimation framework, updated with the latest available data and insights as of 2026.
Global 3D Mapping And 3D Modelling Market Trends and Insights
Drivers Impact Analysis*
| Driver | (~) % Impact on CAGR Forecast | Geographic Relevance | Impact Timeline |
|---|---|---|---|
| Smartphone LiDAR commoditises real-time 3D capture | +2.8% | Global, early uptake in North America and Asia-Pacific | Medium term (2-4 years) |
| Integration of 3D geospatial layers into generative-AI design suites | +2.5% | North America and Europe, spillover to Asia-Pacific | Long term (≥ 4 years) |
| Mandates for digital twins in public-infrastructure projects | +2.3% | Europe and Asia-Pacific, selective North America | Medium term (2-4 years) |
| XR-ready 3D content boom in media and retail | +2.0% | Global, concentrated in North America and Europe | Short term (≤ 2 years) |
| Cloud-native 3D rendering slashes TCO for SMEs | +1.9% | Global | Short term (≤ 2 years) |
| Growth of autonomous-vehicle HD maps | +1.7% | North America, Europe and China | Long term (≥ 4 years) |
| Source: Mordor Intelligence | |||
Smartphone LiDAR Commoditises Real-Time 3D Capture
Apple brought LiDAR to iPhone and iPad Pro devices, and Android flagships followed in 2025, enabling field teams to achieve millimeter-level accuracy without dedicated laser scanners.[1]Apple Inc., “iPhone Technical Specifications,” apple.com Portable depth sensors priced below USD 5,000 are now displacing entry-level photogrammetry drones in warehouses and tunnels, where occlusion hampers structure-from-motion workflows. The National Institute of Standards and Technology published accuracy benchmarks in 2024 that accelerated the acceptance of consumer-grade scans in building information modelling submittals. Software firms responded by embedding real-time mesh reconstruction into mobile apps so users can export OBJ or FBX files directly to cloud collaboration hubs, shrinking capture-to-share cycles from days to minutes. Lower hardware costs and simplified workflows expand the addressable user base from surveyors to general contractors and facility managers, lifting near-term demand for cloud rendering subscriptions.
Integration of 3D Geospatial Layers into Generative-AI Design Suites
NVIDIA’s Cosmos platform merges physics-based scene generation with latitude-longitude coordinates, enabling planners to synthesize entire city blocks that honor cadastral boundaries and elevation models.[2]Nvidia Corporation, “Cosmos Platform Integrates Geospatial Layers,” nvidia.com Autodesk’s Forma pairs generative design tools with Esri ArcGIS layers, letting architects run massing studies that respect zoning envelopes and solar regulations in hours rather than weeks. Adoption of the Open Geospatial Consortium 3D Tiles standard by Google Earth and Cesium in 2024 standardizes streaming of massive terrain meshes into browser-based AI tools, removing latency barriers to multi-user sessions. Early transportation pilots now evaluate highway alignments within AI-generated 3D corridors that automatically update when environmental buffers shift, replacing static CAD files with dynamic parametric models. As a result, spending is shifting from manual modelling labor to curated dataset preparation and constraint definition services, reinforcing the value of high-quality geospatial inputs.
Mandates for Digital Twins in Public Infrastructure Projects
The United Kingdom requires ISO 19650-compliant digital twins for public works projects exceeding GBP 50 million, making compliance a budget line item for every large contract.[3]UK Department for Transport, “National Digital Twin Programme Requirements,” gov.uk New South Wales imposed similar rules across transport and utilities built in 2025, obliging asset owners to synchronize physical assets with 3D models throughout the life cycle. In the United States, the Federal Highway Administration earmarked USD 200 million for agencies adopting 3D machine control and as-built verification, ensuring steady demand for mapping software. Bentley Systems reported 34% year-over-year growth in iTwin revenue in 2025, as public-sector mandates became the largest single source of pipeline. Formal requirements convert experimental pilots into recurring fees for surveying, modelling, and hosting, broadening the revenue base for vendors that support open schemas such as IFC and CityGML.
XR-Ready 3D Content Boom in Media and Retail
Meta Quest 3 improved passthrough clarity, and Apple Vision Pro introduced spatial computing, prompting brands to commission high-polygon assets that render at 90 frames per second in mixed reality. Projection-mapping installations jumped 22% in 2025 as falling LED projector costs enabled mid-tier advertisers to transform building façades and theater stages into immersive canvases. Furniture retailers using augmented-reality configurators saw return rates drop 18% because buyers previewed customized products at full scale before checkout. Entertainment studios moved away from green screens toward LED stages that display real-time Unreal Engine environments, embedding 3D pipelines more deeply into episodic production schedules. Collectively, these experiences drive sustained demand for modelling, texture authoring, and low-latency cloud rendering, reinforcing growth in the 3D mapping and 3D modelling market.
Restraints Impact Analysis*
| Restraint | (~) % Impact on CAGR Forecast | Geographic Relevance | Impact Timeline |
|---|---|---|---|
| High GPU and sensor supply-chain volatility | -1.4% | Global | Short term (≤ 2 years) |
| Large-file data-sovereignty compliance costs | -1.2% | Europe, spillover to Asia-Pacific | Medium term (2-4 years) |
| Skills shortage in photogrammetry post-processing | -0.9% | Global, acute in North America and Europe | Medium term (2-4 years) |
| Fragmented 3D data standards slow interoperability | -0.8% | Global | Long term (≥ 4 years) |
| Source: Mordor Intelligence | |||
High GPU and Sensor Supply-Chain Volatility
NVIDIA H100 and H200 GPUs remained under allocation constraints through 2025 as hyperscale cloud buyers consumed most 4-nanometer wafer capacity, creating bidding wars that smaller visualization firms could not match. Automotive-grade solid-state LiDAR lead times exceeded 26 weeks, delaying autonomous-vehicle mapping programs and forcing some suppliers to pivot to camera-only perception stacks. Amazon Web Services increased EC2 P5 instance pricing by 18% in early 2025, compressing margins for service bureaus running fixed-price render contracts. Geopolitical export controls on advanced chips to China amplified uncertainty, encouraging vertical integration moves such as Hexagon’s acquisition of sensor-fabrication assets. Until supply stabilizes, cost spikes and hardware shortages will temper near-term expansion plans across the ecosystem.
Large-File Data-Sovereignty Compliance Costs
European Union GDPR localization rules force municipalities to store 3D city models inside EU cloud regions, inflating storage and egress fees by up to 40% compared with globally distributed object storage. China’s Data Security Law requires government approval for exporting critical geospatial data, compelling multinational engineering firms to maintain isolated Chinese data lakes that duplicate infrastructure and staffing. India’s Digital Personal Data Protection Act similarly limits the hosting of geospatial datasets collected by public agencies, curbing the ability of overseas cloud providers to bid on local tenders. Photogrammetry projects often exceed 500 gigabytes, so mandatory domestic processing adds legal reviews, longer timelines, and higher costs, discouraging small providers from competing in heavily regulated verticals. The aggregate compliance burden, therefore, erodes forecast growth until harmonized cross-border frameworks emerge.
*Our forecasts treat driver/restraint impacts as directional, not additive. The impact forecasts reflect baseline growth, mix effects, and variable interactions.
Segment Analysis
By Component: Services Propel Growth Amid Complexity Outsourcing
Software captured 49.37% of the 3D mapping and 3D modelling market share in 2025 because perpetual-update subscriptions from Autodesk, Bentley, and Trimble bundled cloud storage and maintenance into fixed annual fees. Hardware revenues, while substantial, are flattening as smartphone-embedded LiDAR supplants entry-level scanners, squeezing margins in the commoditized tier. Services, however, are forecast to log a 14.28% CAGR through 2031 as enterprises turn to external specialists for photogrammetry post-processing, mesh reconstruction, and digital twin integration. Managed GPU rendering across Amazon Web Services, Microsoft Azure, and Google Cloud removes the capital expenditure for on-premises clusters, appealing to small and medium firms that prize operating-expense flexibility.
Training, consulting, and data-migration contracts now anchor long-term vendor relationships because clients struggle with fragmented Open Geospatial Consortium schemas and proprietary formats. The rising service mix deepens stickiness by embedding domain expertise directly into customer workflows rather than selling stand-alone tools. Vendors that pair implementation with continuous optimization earn predictable recurring revenue, a pattern that stabilizes the overall 3D mapping and 3D modelling market size against hardware supply-chain swings. As asset owners push for real-time model upkeep, service providers that can combine LiDAR capture, cloud orchestration, and analytics occupy the most defensible competitive positions.


By Type: 3D Mapping Races Ahead on Real-Time Geospatial Demand
3D modelling accounted for 63.84% of revenue in 2025, reflecting entrenched use in entertainment pipelines, product design, and architectural visualization. Yet 3D mapping is projected to grow at a 14.03% CAGR, as autonomous-vehicle fleets and smart-city operators require centimeter-level updates refreshed weekly or even daily. Automotive original-equipment manufacturers contract HERE Technologies, TomTom, and Mobileye for always-on, high-definition road layers, while municipalities in Singapore, Dubai, and Seoul integrate 3D building grids with traffic sensors for live optimization.
The boundary between mapping and modelling is narrowing as LiDAR point clouds are directly converted into parametric building information models that support facilities management and renovation planning. Generative-AI engines now synthesize urban geometry from cadastral data, further blurring functional lines. This technical convergence encourages platform vendors to package both capabilities so clients need not juggle separate toolchains. As real-time city twins and driverless-car corridors proliferate, dynamic mapping will erode the historical dominance of modelling in the 3D mapping and modelling market.
By Application: Projection Mapping Becomes the Fastest-Moving Niche
3D rendering and visualization accounted for 38.91% of 2025 turnover, as architects, engineers, and contractors rely on clash detection and photorealistic walkthroughs before fabrication. Projection mapping, however, is forecast to expand at 14.47% through 2031 as advertisers turn façades and retail interiors into immersive canvases that cycle content on demand. Hardware costs for high-lumen projectors keep falling, letting mid-tier brands deploy spectacle once reserved for flagship events. Automotive showrooms now project life-size vehicle configurations onto blank prototypes, replacing warehouse-intensive inventory models.
Texture mapping is gaining ground in games and extended reality, as real-time ray tracing on consumer GPUs enables physically based shading that previously required offline baking. Indoor navigation apps blend maps and 3D models so travelers follow augmented-reality arrows inside malls and transit hubs, strengthening demand for accurate building meshes. Each of these workflows draws on the same base assets, enabling studios and engineering firms to monetize a single geometry set across multiple channels. Consequently, application diversity cushions the broader 3D mapping and 3D modelling market share against cyclical spending in any single end use.
By End-User Vertical: Healthcare Accelerates Past Entertainment Growth
Entertainment and media still delivered 28.33% of 2025 revenue, but its growth curve is moderating as studios improve asset reuse and toolchains mature. Healthcare is poised for a 14.61% CAGR because patient-specific 3D-printed guides shorten complex surgeries and improve outcomes, driving hospitals to embed modelling in pre-operative routines. The United States Food and Drug Administration cleared 127 custom surgical devices in 2025, proving regulatory momentum. Top cardiac centers report 30% reductions in planning time when teams use high-fidelity heart models to plan procedures before entering the operating room.
Construction remains a heavyweight spender thanks to ISO 19650 mandates that force digital-twin deliverables into high-value public contracts. Automotive and transportation channel investment into high-definition routing layers for driver-assist and autonomous stacks, while defense agencies consume global terrain meshes for mission rehearsal. This widening sector spread insulates vendors from shocks in any one budget cycle and broadens the qualified buyer pool for emerging cloud-native platforms. As healthcare adoption climbs, the overall 3D mapping and 3D modelling market share becomes less concentrated in entertainment, improving revenue stability.
By Deployment: Cloud First Strategies Cement Category Leadership
Cloud implementations accounted for 63.49% of 2025 revenue and will grow at a 14.08% CAGR as consumption-based GPU instances replace capital-intensive render farms. NVIDIA Omniverse Cloud lets distributed teams co-edit in a browser, eliminating workstation upgrade loops and slashing onboarding time for subcontractors. Hybrid models combine local data lakes with elastic burst rendering to satisfy low-latency production shoots and data-sovereignty mandates in defense or critical utilities. Continuous software delivery keeps feature sets up to date without disruptive version migrations.
On-premise stacks persist where air-gapped security or frame-accurate LED-stage synchronization is non-negotiable, yet even in those environments, burst jobs are increasingly offloaded to public clouds during peak demand. Subscription economics let finance teams align cost outlays with project milestones, trimming idle-asset overhead. As cloud providers extend regional coverage, latency gaps narrow and compliance hurdles ease, widening the funnel for small studios and municipal agencies to adopt on-demand workflows. The structurally lower entry barrier reinforces long-term expansion of the 3D mapping and 3D modelling market, especially in developing regions with limited legacy infrastructure.
Geography Analysis
North America accounted for 36.78% of global revenue in 2025, giving the region the largest share of the 3D mapping and 3D modelling market at the start of the forecast period. Growth now moderates as defense geospatial budgets plateau and entertainment studios streamline asset reuse, yet federal grants for digital construction and high-definition road mapping sustain demand. Asia-Pacific, by contrast, is projected to expand at a 14.67% CAGR through 2031, the fastest pace worldwide. China’s 14th Five-Year Plan earmarks CNY 500 billion (USD 70 billion) for city-scale digital twins. India’s liberalized geospatial data policy allows private firms to win municipal mapping contracts once reserved for the Survey of India.
Europe benefits from ISO 19650 mandates that require digital-twin deliverables on public projects above GBP 50 million, while Germany has allocated EUR 300 million (USD 330 million) for autobahn pilots. The United Kingdom’s National Digital Twin Programme synchronizes data from transport, water, and energy assets across agencies. In the Middle East, sovereign wealth funding for mega-projects such as Saudi Arabia’s NEOM is accelerating the adoption of cloud-native platforms that stream terabyte-scale meshes to dispersed teams. Regional interest is amplified by heat management and energy optimization studies that depend on high-resolution building shells.
South America remains early stages, yet Brazil’s infrastructure monitoring and Argentina’s precision-agriculture pilots validate drone photogrammetry use cases. National broadband upgrades and relaxed unmanned-aircraft rules promise gradual scaling once early results justify budget allocations. In Africa, initial deployments center on South Africa’s mining belt and Egypt’s new administrative capital, where LiDAR and aerial imagery guide earthworks and utility corridors. Collectively, these emerging regions could lift the overall 3D mapping and 3D modelling market size beyond current forecasts if macroeconomic conditions stabilize.

Regulatory Landscape
Regulation for 3D mapping and 3D modelling is increasingly shaped by public-sector geospatial standard setting and by horizontal governance of AI-enabled reconstruction and generative design. In the European Union, the EU AI Act (Regulation 2024/1689) introduces documentation and transparency obligations for providers of general-purpose AI models. That framework affects 3D content generation and automated feature extraction workflows embedded in modelling suites.
On the geospatial side, open standards are becoming procurement anchors for streaming and exchanging large 3D datasets. The Open Geospatial Consortium (OGC) 3D Tiles standard and CityGML support interoperability across browser-based visualization and city-model pipelines. In January 2026, China’s Ministry of Natural Resources released ReS3D operational standards covering oblique photogrammetry specifications and 3D model data and service-interface formats, reinforcing national alignment around consistent realistic 3D model delivery. In the United States, the Federal Geographic Data Committee (FGDC) National Geospatial Advisory Committee (NGAC) issued standards recommendations in March 2026 that emphasize cloud-native formats such as COG, COPC, STAC, and GeoParquet, supporting scalable 3D terrain and point-cloud handling in AI-integrated workflows.
Value Chain Analysis
The value chain starts with data capture (smartphone LiDAR, terrestrial laser scanning, mobile mapping, drones, and satellite imagery). It then moves through processing and reconstruction (photogrammetry, point-cloud registration, mesh generation, classification and feature extraction), followed by modeling and authoring (BIM/CAD and DCC tools). Distribution and monetization come last through cloud collaboration, streaming visualization, and digital twin operations.
Open geospatial standards (for example, OGC 3D Tiles and CityGML) and BIM exchange formats (for example, IFC) cut across the chain to reduce rework at handoffs between survey, design, construction, and operations. Compute and cloud delivery form a critical middle layer, with GPU availability and hyperscaler pricing affecting service margins and project bid competitiveness. The chain is also extending upstream into persistent global basemap production, and downstream into operational decisioning. In February 2025, NTT DATA Group announced the Marble Visions joint venture with PASCO CORPORATION and Canon Electronics to develop a 3D Earth observation satellite system targeting annual global map updates. Enterprise digital-twin deployments increasingly connect 3D models to real-time warehouse and facility data. Partnerships such as Siemens and KION Group (April 2026) illustrate how PLM and digital-twin toolchains are being linked to logistics operations, and Microsoft Azure-based world-model initiatives using large 3D object libraries (Global Objects collaboration announced June 2026) highlight the growing role of curated 3D datasets as training and retrieval assets for AI-enabled spatial applications.
Competitive Landscape
The market is moderately fragmented, with the top five vendors controlling roughly 60% of global revenue. Trimble, Hexagon, and ESRI defend entrenched accounts by bundling sensors, analysis software, and cloud hosting into closed ecosystems that raise switching costs. Their global service networks deter displacement in regulated verticals, yet mid-market buyers gravitate toward lower-cost, single-purpose alternatives, pressuring incumbents to release AI-driven automation annually.
Matterport and Bentley Systems gain share by packaging vertical templates, for example, virtual property tours and infrastructure asset management into subscription bundles that shorten deployment times. Pix4D and DroneDeploy undercut traditional surveyors through browser-based photogrammetry pipelines that eliminate desktop licence fees. Hexagon’s December 2025 partnership with NVIDIA Omniverse Cloud enabled real-time editing of 10-terabyte point clouds. Trimble’s January 2026 acquisition of a European analytics firm added predictive maintenance to its transportation stack. Autodesk’s July 2025 purchase of a generative-design startup embedded AI geometry synthesis in the Forma platform.
Standards adoption also shapes rivalry; municipalities now write 3D Tiles and CityGML into bid documents, marginalizing providers that cling to proprietary schemas. Data-sovereignty rules raise the cost of multi-region cloud operations, squeezing smaller vendors that lack localized hosting. Talent shortages in photogrammetry post-processing further erode service margins, so suppliers are embedding automated feature extraction and mesh cleanup into core tools. Companies that embrace open standards, cloud scalability, and AI-powered productivity are positioned to capture outsized gains as buyers consolidate around resilient, vendor-agnostic platforms.
3D Mapping And 3D Modelling Industry Leaders
Autodesk Inc.
Bentley Systems Inc.
ESRI Inc.
Trimble Inc.
Hexagon AB
- *Disclaimer: Major Players sorted in no particular order

Market Opportunities and Future Outlook
A major whitespace sits at the intersection of GIS-BIM convergence and cloud-native interoperability. Buyers want point clouds, meshes, and BIM deliverables that move cleanly between design platforms and geospatial systems, without manual translation. Vendor actions support this direction: Esri expanded BIM and CAD tooling in the May 2026 ArcGIS Pro release, and Esri also launched ArcGIS for Autodesk Forma to bring spatial context into AECO workflows. This supports integrated design studies and permitting-ready outputs that connect to authoritative GIS layers.
Another opportunity area is improving scan-to-model throughput by pairing low-cost capture with AI-driven processing. This approach reduces dependence on scarce photogrammetry post-processing skills. Tooling updates such as LP360 v2026.1 (March 2026) added integrated photogrammetry capabilities and AI-based classification with support for ASPRS LAS v1.5, aligning with demand for standardized point-cloud pipelines across mixed sensors and downstream applications. As digital-twin programs progress from pilot visualization into operations, platforms that connect reality capture and 3D models to maintenance and facility systems can find buyers, supported by Autodesk’s move to connect operations data to design and engineering workflows through its announced MaintainX acquisition (May 2026) and by cloud scaling initiatives such as Autodesk’s strategic collaboration with AWS (June 2026).
Recent Industry Developments
- June 2026: Autodesk signed a strategic collaboration agreement with Amazon Web Services to advance cloud-based design and make offerings. The agreement expands cloud deployment options for compute-heavy 3D rendering, collaboration, and data management, while aligning Autodesk workflows with hyperscaler infrastructure used by many AECO and manufacturing customers.
- May 2026: Autodesk announced an agreement to acquire MaintainX to connect operational data with design and engineering workflows. The planned combination extends 3D modelling and digital twin use cases into maintenance and operations, with emphasis on keeping as-built models continuously updated after project handover.
- July 2024: Trimble and Esri expanded their long-standing partnership to drive innovation in construction and infrastructure management. Deeper integration between field workflows, GIS context, and project delivery supports tighter alignment of 3D mapping outputs with downstream design, construction verification, and asset-management processes.


Research Methodology Framework and Report Scope
Market Definition and Coverage
For this study, the 3D mapping and 3D modelling market covers revenue earned from software, services, and related enabling hardware used to capture, build, edit, and use 3D spatial models and 3D scenes for business and public-sector use cases.
Scope exclusions: We do not count general-purpose 2D GIS-only tools, pure entertainment-only content creation not tied to mapping or spatial modelling outcomes, and custom one-off internal projects that are not monetized as products or services.
Segmentation Overview
- By Component
- Hardware
- Software
- Services
- By Type
- 3D Mapping
- 3D Modelling
- By Application
- Projection Mapping
- Texture Mapping
- Maps and Navigation
- 3D Rendering and Visualisation
- By End-user Vertical
- Entertainment and Media
- Healthcare
- Building and Construction
- Automotive and Transportation
- Defense and Security
- By Deployment
- On-premise
- Cloud
- By Geography
- North America
- United States
- Canada
- Mexico
- South America
- Brazil
- Argentina
- Rest of South America
- Europe
- United Kingdom
- Germany
- France
- Italy
- Rest of Europe
- Asia Pacific
- China
- Japan
- India
- South Korea
- Rest of Asia Pacific
- Middle East and Africa
- Middle East
- United Arab Emirates
- Saudi Arabia
- Rest of Middle East
- Africa
- South Africa
- Egypt
- Rest of Africa
- Middle East
- North America
Data Sources, Market Sizing, and Validation
Desk Research
Desk research is used to set the basic demand pool and to keep assumptions grounded in observable signals. We review public sources such as USGS and NOAA geospatial releases, NASA and ESA remote sensing publications, Open Geospatial Consortium standards, and IEEE or ACM papers that describe mapping accuracy, point-cloud workflows, and compute needs. For demand-side context, we also use public procurement portals and infrastructure program documents, plus updates from regulators and transportation agencies where 3D mapping is being adopted.
On the supply side, filings, annual reports, product documentation, and credible press coverage help us understand revenue mix patterns, shifts between cloud and on-premise deployments, and pricing logic. In a few places, paid subscriptions for company financials and news intelligence, patent databases, and shipment-level trade data are used to cross-check supplier activity and technology momentum, rather than relying on any single dataset. The sources listed above are illustrative only, and many other public and paid references were also used for data collection, validation, and clarification.
Primary Interviews and Surveys
Primary work is used to pressure-test the sizing model inputs and to resolve gaps that desk research cannot answer cleanly, such as typical contract structures, usage-linked pricing, and how buyers split spend between capture, processing, and ongoing updates. We speak with solution providers, system integrators, and end users across major regions, then reconcile differences in how each group labels 3D mapping versus 3D modelling so the final totals remain internally consistent.
Distribution of primary research fieldwork respondents
| Company type | Respondent position | Region |
|---|---|---|
| Top tier: 31% | CXOs: 12% | APAC: 46% |
| Mid tier: 49% | Functional/Unit leaders: 40% | EMEA: 32% |
| Smaller Players: 20% | Managers: 48% | Americas: 22% |
Market-Sizing & Forecasting
The sizing starts with a top-down build where spend is reconstructed from adoption and usage indicators tied to mapping and modelling workflows, then converted into USD revenue using realistic pricing and renewal patterns. To keep the model practical, we focus on inputs such as the installed base for LiDAR and photogrammetry capture, cloud rendering and processing utilization, digital twin program rollouts, demand from maps and navigation refresh cycles, and the shift toward subscription and usage-based software pricing.
Results are then checked with selective bottom-up signals, such as sampling vendor revenue disclosures, triangulating typical license and services price bands, and validating volume assumptions through channel conversations. Where direct values are not visible, gaps are handled using proxies like regional project counts, procurement frequency, and known productivity ratios between raw capture and finished 3D outputs.
For forecasting, we primarily use scenario analysis supported by regression-style relationships between demand drivers and spend, and we adjust the final trajectory using expert consensus on adoption timing. The scenarios are anchored to change factors such as sensor penetration in smartphones and field devices, cloud cost trends, infrastructure digitization, and accuracy requirements in regulated or safety-led deployments.
Data Validation & Update Cycle
Checks are run in layers so the final numbers do not depend on one assumption. We compare outputs against independent signals such as procurement momentum, disclosed contract wins, patent intensity in relevant workflows, and regional adoption narratives collected from interviews, then revisit the drivers if the model moves outside reasonable ranges.
Before sign-off, variance checks are reviewed by another analyst, and any large step change triggers a re-contact with selected respondents to confirm whether the movement is real or driven by model mechanics. The report is refreshed annually, and interim updates are done when material events occur, such as major platform changes, new deployment patterns, or meaningful macro demand shifts. Right before delivery, a final pass is completed so clients receive the latest updated view.
Mordor Intelligence's 3d Mapping and 3d Modelling Market Sizing Compared With Other Published Estimates
It is normal to see different market sizes for 3D mapping and 3D modelling because each publisher draws the market box in a slightly different way and also selects different timing for currency and inflation assumptions. Differences also come from how services are treated, how cloud usage is converted into revenue, and whether adjacent categories are folded into the same number.
Some published figures use a broader interpretation that blends nearby 3D software and visualization spend that is not always tied to spatial mapping outcomes. In Mordor Intelligence, the estimate is counted only when revenue is directly linked to 3D mapping and 3D modelling workflows (capture, processing, modelling, and update services), and general 3D design tools that do not produce geospatial or spatially referenced outputs are kept out of scope.
Benchmark comparison
| Source | Market Size | Gaps in Research Methodology |
|---|---|---|
| Mordor Intelligence | USD 9.74 B (2026) | |
| Industry Research Publisher A | USD 7.12 B (2024) | Uses an earlier base year and may apply a narrower conversion of cloud and services revenue, which can understate paid processing and recurring update work in fast-adopting use cases. |
| Market Research Publisher B | USD 5.42 B (2024) | Reports a smaller 2024 starting point and appears to rely on a tighter spend definition and different growth assumptions, which can reduce the captured value of integrated mapping plus modelling programs. |
The comparison shows that most of the spread is explained by year alignment and what gets counted as monetized workflow spend versus adjacent 3D software. By keeping inputs tied to observable adoption signals and by checking price and renewal logic through interviews, the final number stays traceable and repeatable for planning.


Key Questions Answered in the Report
What is the projected size and CAGR of the 3D mapping and 3D modelling market by 2031?
The market is forecast to reach USD 18.44 billion by 2031, expanding at a 13.62% CAGR over 2026-2031.
Which component segment is expanding fastest through 2031?
Services lead growth at a 14.28% CAGR as companies outsource photogrammetry post-processing, cloud migration and digital-twin integration.
Why is Asia-Pacific expected to outpace North America in growth?
Large smart-city rollouts in China, India’s liberalized geospatial-data policy and Japan’s BIM mandates push the region toward a 14.67% CAGR that exceeds North America’s mature pace.
How are smartphone LiDAR sensors influencing adoption?
Embedded LiDAR in flagship phones delivers millimeter-level scans without dedicated hardware, lowering entry costs and broadening 3D capture to contractors and facility managers.
What regulatory mandates are driving public-infrastructure demand?
ISO 19650-aligned digital-twin requirements in the United Kingdom, New South Wales and multiple U.S. transport grants convert compliance into recurring software and services spend.
How does cloud deployment lower total cost of ownership for SMEs?
Consumption-based GPU instances from leading hyperscalers replace capital-intensive render farms, bundling compute, storage and collaboration under predictable operating expenses.
Page last updated on:


