Beryllium Market Size and Share
Market Overview
| Study Period | 2021 - 2031 |
|---|---|
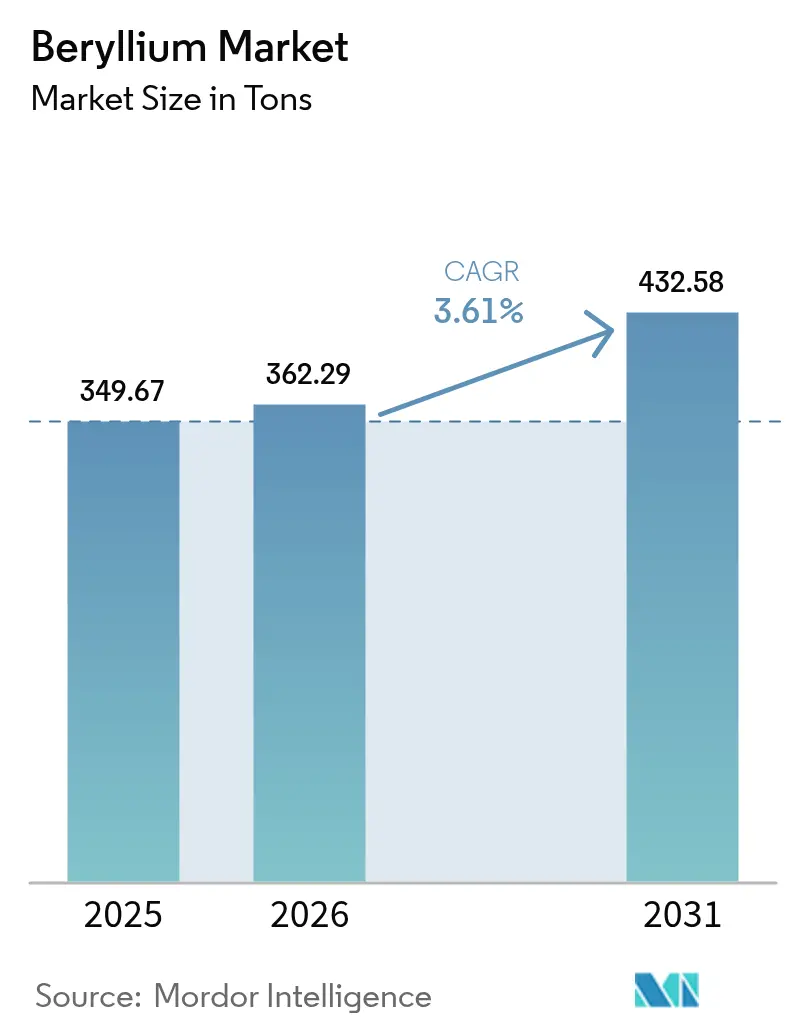
| Market Volume (2026) | 362.29 tons |
| Market Volume (2031) | 432.58 tons |
| Growth Rate (2026 - 2031) | 3.61% CAGR |
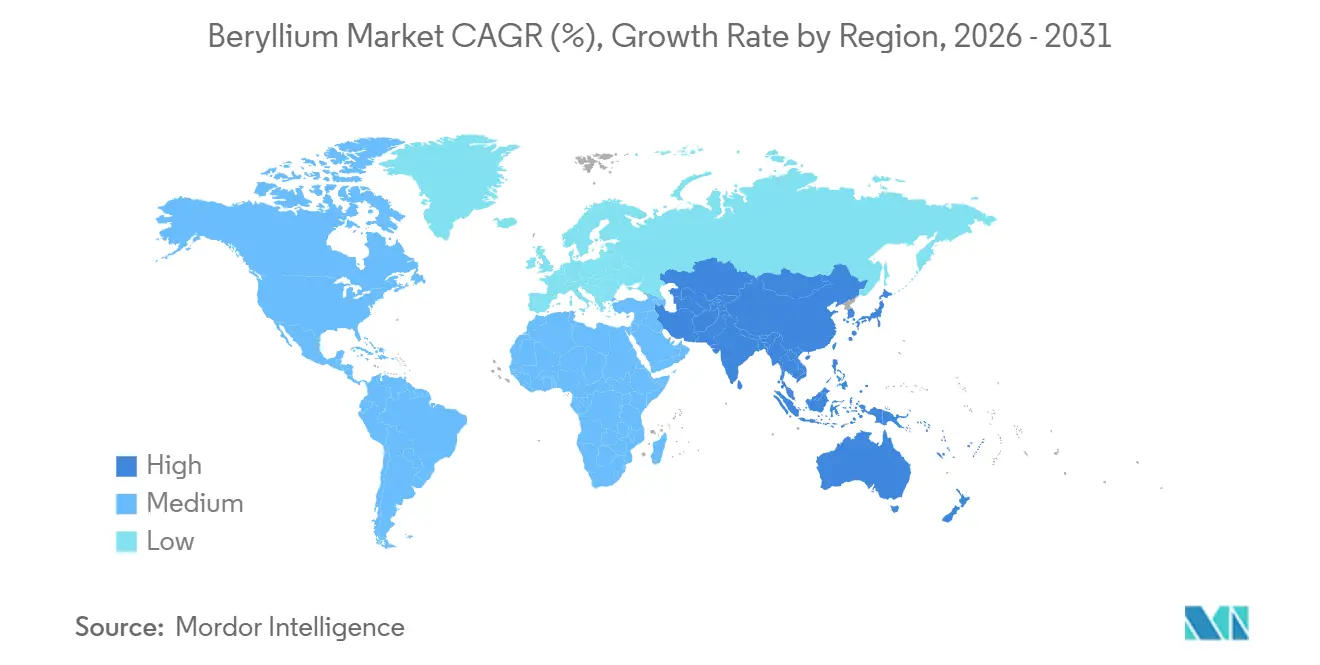
| Fastest Growing Market | Asia Pacific |
| Largest Market | Asia Pacific |
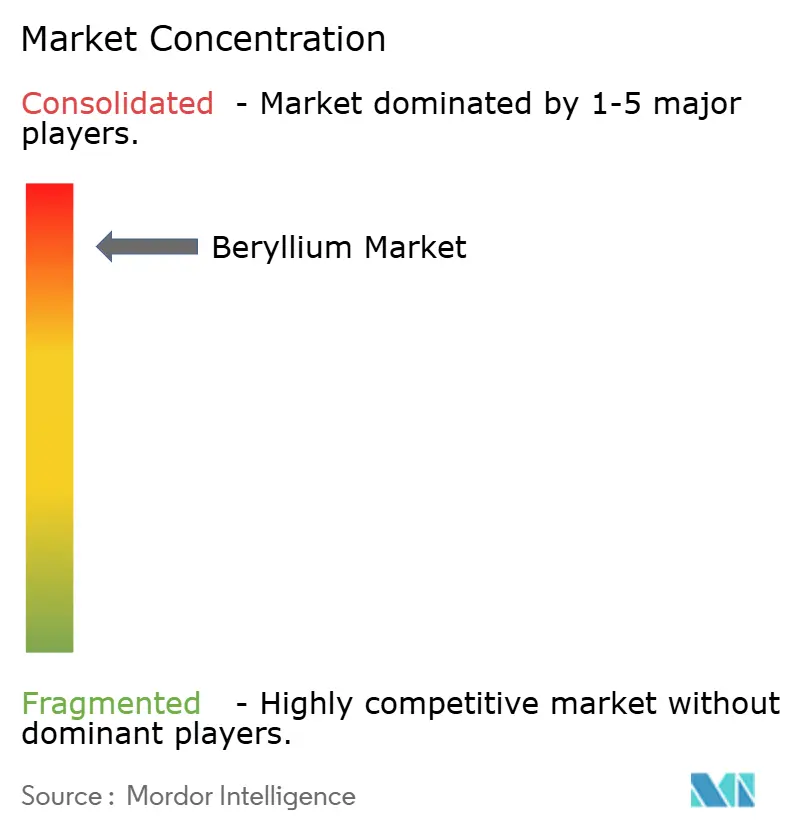
| Market Concentration | High |
Major Players *Disclaimer: Major Players sorted in no particular order Image © Mordor Intelligence. Reuse requires attribution under CC BY 4.0. | |
Beryllium Market Analysis by Mordor Intelligence
The Beryllium Market size is projected to be 349.67 tons in 2025, 362.29 tons in 2026, and reach 432.58 tons by 2031, growing at a CAGR of 3.61% from 2026 to 2031. Strong demand persists where replacing the metal is neither technically nor economically feasible, including 5G RF filters, reusable-launch-vehicle structures, molten-salt-reactor coolants, and satellite optical benches. Rapid price escalation highlights supply fragility tied to concentrate output in Kazakhstan and China. Materion’s Spor Mountain mine remains the lone Western ore-to-alloy chain, supplying 250-270 t of concentrate each year. Asia-Pacific leads demand as beryllium-copper connectors anchor electronics and electric-vehicle production, while North America and Europe sustain premium pricing through aerospace and defense contracts. Environmental regulation, notably the U.S. 0.2 µg/m³ exposure limit, raises compliance costs, yet tightening standards also deters new entrants and reinforces incumbent advantage.
Key Report Takeaways
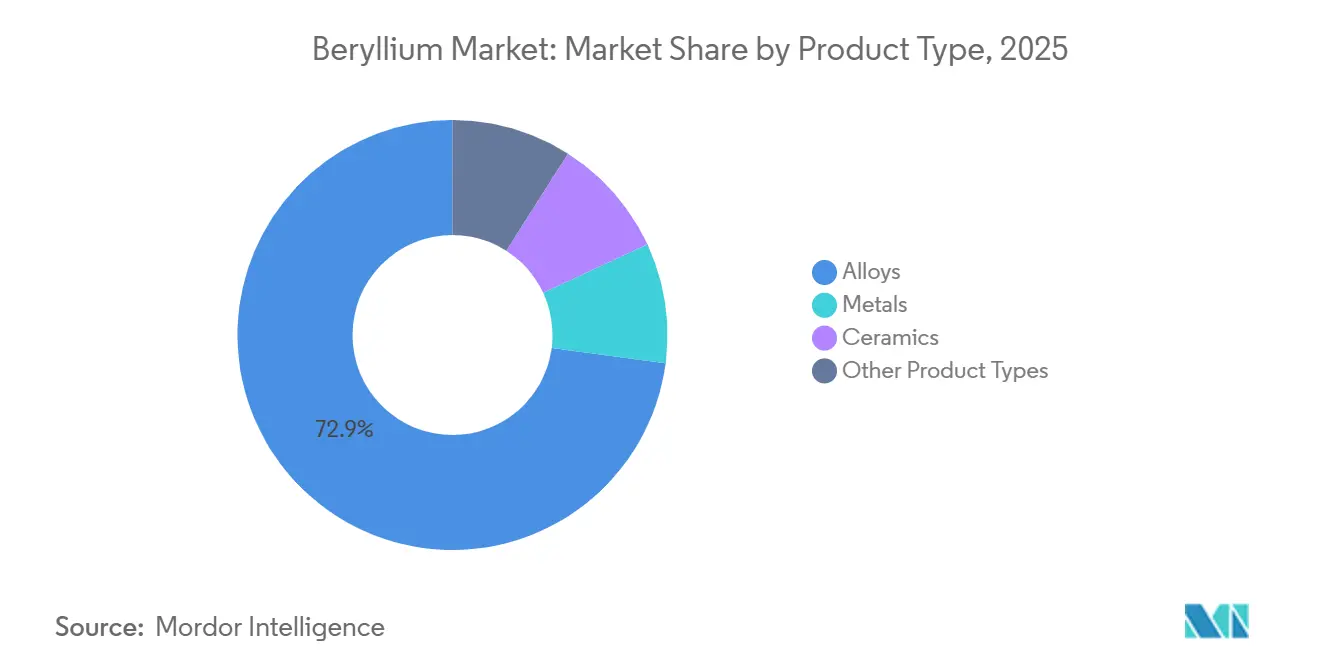
- By product type, alloys held 72.91% of the beryllium market share in 2025 and are advancing at a 3.98% CAGR through 2031, underscoring their dual leadership in scale and growth.
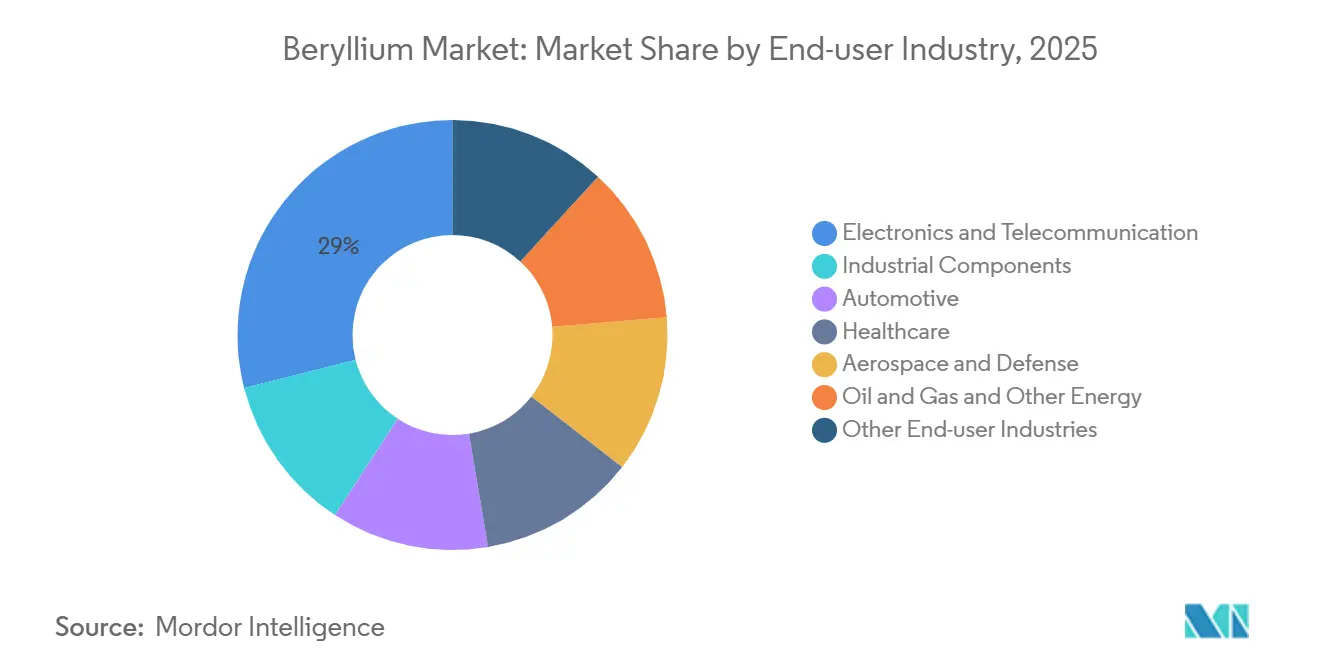
- By end-user industry, electronics and telecommunications commanded 28.96% revenue in 2025, while automotive exhibits the fastest expansion at 4.99% CAGR to 2031, owing to electric-vehicle thermal-management needs.
- By geography, Asia-Pacific contributed 37.78% volume in 2025 and is forecast to retain the highest regional growth at 4.18% CAGR on the back of 5G base-station deployment and electronics manufacturing depth.
Note: Market size and forecast figures in this report are generated using Mordor Intelligence’s proprietary estimation framework, updated with the latest available data and insights as of 2026.
Global Beryllium Market Trends and Insights
Drivers Impact Analysis*
| Drivers | (~) % Impact on CAGR Forecast | Geographic Relevance | Impact Timeline |
|---|---|---|---|
| Rising adoption of Be-Cu alloys in 5G and mm-wave base-station RF filters | +0.9% | Global, with concentration in China, South Korea, United States | Short term (≤ 2 years) |
| Growing requirement for lightweight, high-stiffness structures in reusable launch vehicles | +0.7% | North America, Europe, with emerging activity in China and India | Medium term (2-4 years) |
| Escalating demand for thermal management materials in advanced EV power electronics | +0.8% | Asia-Pacific core (China, Japan, South Korea), spill-over to Europe and North America | Medium term (2-4 years) |
| Defense modernization programs boosting satellite, missile-seeker, and optical sensor volumes | +0.6% | United States, Europe, India, with secondary impact in Middle East | Long term (≥ 4 years) |
| Emerging need for neutron-transparent Be reflectors in small modular reactors | +0.3% | United States, Canada, United Kingdom, with pilot projects in Eastern Europe | Long term (≥ 4 years) |
| Source: Mordor Intelligence | |||
Rising Adoption of Be-Cu Alloys in 5G and mm-Wave Base-Station RF Filters
Millimeter-wave 5G equipment imposes strict mechanical and thermal demands on its connectors, springs, and grounding contacts. Beryllium-copper alloys offer unmatched conductivity, fatigue resistance, and non-magnetic properties, setting them apart from the more affordable phosphor-bronze. Telecom OEMs from China, Japan, and South Korea achieved significant penetration in 5G subscribers. This milestone led NGK Metals to expand strip capacity at its plants in Japan and Europe, supporting the surge in base stations[1]NGK Metals Corporation, “Corporate Profile and Capabilities,” ngkmetals.com. As mm-wave frequencies surpass 24 GHz, challenges in thermal dissipation uphold the premium status of these materials, even as commodity connectors shift to more economical alloys.
Growing Requirement for Lightweight, High-Stiffness Structures in Reusable Launch Vehicles
Reusable launch systems prioritize mass savings, leading to reduced fuel consumption and quicker turnaround times. Beryllium, with a specific stiffness four times that of aluminum and a lower density, also boasts dimensional stability through repeated thermal cycles. The strong commercial commitment to beryllium hardware is evident. Programs like NASA's James Webb Space Telescope have validated beryllium's cryogenic performance[2]NASA, “James Webb Space Telescope Mirror Fact Sheet,” nasa.gov. Meanwhile, current launch integrators are turning to beryllium-aluminum castings for engine mounts, especially where titanium's density poses challenges. As the industry shifts from expendable to reusable launch vehicles, the demand for beryllium is set to grow.
Escalating Demand for Thermal-Management Materials in Advanced EV Power Electronics
In 800-V electric vehicles, silicon-carbide inverters dissipate heat and demand substrates with high thermal conductivity. Beryllium-oxide ceramics provide this thermal conductivity while maintaining electrical insulation. Materion stands out as the sole commercial source of BeO, catering to both automotive and industrial sectors via its Performance Materials division. In 2024, China's output of new-energy vehicles increased significantly, incorporating beryllium-copper contacts in both charging ports and battery-management systems. Furthermore, as the industry pivots towards higher-temperature SiC devices, the premium outlook for BeO becomes increasingly pronounced.
Defense Modernization Programs Boosting Satellite, Missile-Seeker, and Optical-Sensor Volumes
Satellites and missile seekers rely heavily on lightweight, thermally stable components. Beryllium, already in use for avionics housings in the F-35 fighter, is gaining traction. The U.S. Air Force Research Laboratory granted Materion an award to push forward the additive manufacturing of beryllium-aluminum alloys. With the rise of proliferated low-Earth-orbit constellations, the demand for compact spacecraft surges. Here, polished beryllium optical benches play a pivotal role in minimizing line-of-sight drift. While India's defense budget for FY 2025 stands significant, earmarked for satellite and missile projects, the nation's beryllium production remains minimal, leading to a reliance on imports from North America and Kazakhstan.
Restraints Impact Analysis*
| Restraints | (~) % Impact on CAGR Forecast | Geographic Relevance | Impact Timeline |
|---|---|---|---|
| Stringent occupational exposure limits and rising compliance costs | -0.5% | Global, with heightened enforcement in United States, European Union, and Japan | Short term (≤ 2 years) |
| Volatility of beryllium concentrate supply from Kazakhstan and China | -0.4% | Global, with acute impact on North America and Europe dependent on imports | Medium term (2-4 years) |
| Accelerating research and development on aluminum and titanium metal-matrix composites as substitutes | -0.3% | North America and Europe aerospace sectors, with limited near-term commercialization | Long term (≥ 4 years) |
| Source: Mordor Intelligence | |||
Stringent Occupational Exposure Limits and Rising Compliance Costs
In 2018, the U.S. OSHA slashed the permissible exposure limit for beryllium to 0.2 µg/m³. This move compelled plants to upgrade their facilities, implement medical surveillance, and enhance hygiene measures. Despite having extensive controls in place, Materion faced and settled violations in 2019. The European Union, under its REACH regulations, has classified beryllium as a substance of very great concern. Concurrently, Japan has instituted similar airborne limits. These intensified compliance measures not only deter new market entrants but also restrict capacity expansions, subtly moderating the growth trajectory of the beryllium market.
Volatility of Beryllium Concentrate Supply from Kazakhstan and China
Ulba Metallurgical Plant in Kazakhstan and mines in China lead the world in concentrate output. As geopolitical and logistical uncertainties surfaced, spot prices surged significantly in 2024. IBC Advanced Alloys, bound by a contract with Ulba until 2026, finds itself vulnerable to these price fluctuations. While Western buyers turn to Materion’s Spor Mountain mine, its annual yield limits supply flexibility. Disruptions in Kazakhstan's rail corridors or shifts in Chinese export policies quickly ripple through to alloy and oxide prices in North America and Europe.
*Our forecasts treat driver/restraint impacts as directional, not additive. The impact forecasts reflect baseline growth, mix effects, and variable interactions.
Segment Analysis
By Product Type: Alloys, Anchor Telecom, and EV Use Cases
Alloys commanded 72.91% of 2025 volume, reflecting their cost-to-performance edge in connectors, springs, and tooling. The alloys segment is positioned to post a 3.98% CAGR through 2031, the fastest within product categories. The beryllium market for alloys is on track to expand further, driven by the expansion of 6G infrastructure and fast-charging networks.
While pure metal and powder focus on high-stiffness aerospace components, they command a modest share in volume. Ceramics, mainly BeO, cater to the demands of electric-vehicle inverters. However, due to occupational handling concerns, their adoption is limited to premium modules. Additionally, other products like BeF₂ salts carve out a niche, primarily associated with molten-salt reactors. Notably, advancements in continuous casting and additive manufacturing, backed by funding from the U.S. Air Force, hint at potential cost reductions, which could expand beryllium's footprint in intricate aerospace designs.


By End-User Industry: Electronics Lead, Automotive Accelerates
Electronics and telecommunications consumed 28.96% of beryllium in 2025, supported by 5G roll-outs and data-center switches. Automotive, however, is on track for the quickest climb at 4.99% CAGR to 2031. Materion's Alloy 190 is tailored for charging ports, ensuring mandatory durability. The aerospace and defense sectors, bolstered by satellite expansions and hypersonic missile initiatives, stand as a stable third pillar. Additionally, smaller yet specialized niches include industrial tools, healthcare imaging windows, and connectors in the oil and gas sector.
While electronics are set to moderate their leadership beyond 2027, following the peak of 5G densification, a shift towards 6G terahertz bands might spark renewed upgrades in connectors. The automotive sector's growth is underpinned by ongoing electric-vehicle incentives in China, credits from the U.S. Inflation Reduction Act, and stringent CO₂ compliance targets in Europe. Together, these dynamics underscore a robust and diversified demand for beryllium across various technology sectors.
Geography Analysis
Asia-Pacific dominated 2025 volume at 37.78% and is set to widen its lead at a 4.18% CAGR. China's electronics production and its milestone in new-energy vehicles highlight a robust demand. Meanwhile, South Korea and Japan are cementing their roles in semiconductor packaging, particularly with Be-Cu leadframes. In India, increased defense spending is driving up imports of satellite optics and missile seekers. Additionally, regional policies, like Ningxia's encouraged-industries list, hint at Beijing's strategy to secure upstream beryllium supplies.
North America reaps the rewards of vertical integration. Materion's Spor Mountain mine not only caters to domestic alloy plants but also acts as a buffer for aerospace contractors against disruptions from Kazakhstan. The region's clout is further underscored by recent multi-year contracts with propulsion OEMs, showcasing a premium pricing advantage. Looking ahead, Canada's roadmap for small modular reactors could boost demand for BeF₂. At the same time, Mexico's EV assembly plants are already integrating Be-Cu connectors, sourced through U.S. supply chains.
Europe, while trailing in volume, continues to cater to the quality-sensitive aerospace sector. Notably, Airbus's satellite payloads and the European Space Agency's science missions depend on beryllium optical benches procured from Ulba. Geopolitical tensions surrounding Russian concentrates have spurred supply-security measures in Germany, France, and the UK. Meanwhile, South America and the Middle East, though currently accounting for only single-digit tonnage, hint at potential growth. Brazil's burgeoning aerospace sector and the Gulf's expanding data centers, which favor Be-Cu high-density server interconnects, underscore this latent demand.

Competitive Landscape
The market is highly consolidated in nature. Strategic moves focus on long-term supply security. Materion signed multiyear deals with Kairos Power and Commonwealth Fusion Systems to provide BeF₂ for advanced reactors and fusion research, lengthening revenue visibility to the 2030s. The U.S. Air Force funds additive-manufacturing development that could streamline complex satellite parts. OSHA’s strict airborne-beryllium limits and Europe’s REACH authorization requirements impose compliance costs that discourage greenfield entrants, concentrating power among incumbents.
Beryllium Industry Leaders
Materion Corporation
NGK INSULATORS, LTD.
JSC Ulba Metallurgical Plant (JSC NAC Kazatomprom)
Hunan Shuikoushan Nonferrous Metals Group Co., Ltd.
IBC Advanced Alloys
- *Disclaimer: Major Players sorted in no particular order

Recent Industry Developments
- March 2025: Rockland Resources Ltd. acquired the Claybank Beryllium Project near Utah’s Spor Mountain, enlarging North American resource potential
- January 2025: Materion expanded AlBeCast aluminum-beryllium casting capacity at Elmore, Ohio, incorporating advanced rapid-prototyping lines to support aerospace and defense contracts.


Global Beryllium Market Report Scope
Beryllium is a hard, light, silver-grey metal with chemical properties similar to aluminum. It is brittle at room temperature. It is used to make strong alloys and finds application in industrial components, aerospace and defense, electronics, etc.
The beryllium market is segmented by product type, end-user industry, and geography. By product type, the market is segmented into alloys, metals, ceramics, and other product types. By end-user industry, the market is segmented into industrial components, automotive, healthcare, aerospace and defense, oil and gas and other energy, electronics and telecommunications, and other end-user industries. The report covers the market sizes and forecasts for the global beryllium market in 16 countries across major regions. For each segment, the market sizing and forecasts are done based on volume (Tons).
| Alloys |
| Metals |
| Ceramics |
| Other Product Types |
| Industrial Components |
| Automotive |
| Healthcare |
| Aerospace and Defense |
| Oil and Gas and Other Energy |
| Electronics and Telecommunication |
| Other End-user Industries |
| Asia-Pacific | China |
| Japan | |
| India | |
| South Korea | |
| Rest of Asia-Pacific | |
| North America | United States |
| Canada | |
| Mexico | |
| Europe | Germany |
| United Kingdom | |
| France | |
| Italy | |
| Russia | |
| Rest of Europe | |
| South America | Brazil |
| Argentina | |
| Rest of South America | |
| Middle-East and Africa | Saudi Arabia |
| South Africa | |
| Rest of Middle-East and Africa |
| By Product Type | Alloys | |
| Metals | ||
| Ceramics | ||
| Other Product Types | ||
| By End-user Industry | Industrial Components | |
| Automotive | ||
| Healthcare | ||
| Aerospace and Defense | ||
| Oil and Gas and Other Energy | ||
| Electronics and Telecommunication | ||
| Other End-user Industries | ||
| By Geography | Asia-Pacific | China |
| Japan | ||
| India | ||
| South Korea | ||
| Rest of Asia-Pacific | ||
| North America | United States | |
| Canada | ||
| Mexico | ||
| Europe | Germany | |
| United Kingdom | ||
| France | ||
| Italy | ||
| Russia | ||
| Rest of Europe | ||
| South America | Brazil | |
| Argentina | ||
| Rest of South America | ||
| Middle-East and Africa | Saudi Arabia | |
| South Africa | ||
| Rest of Middle-East and Africa | ||


Key Questions Answered in the Report
What CAGR is the beryllium market expected to register between 2026 and 2031?
The beryllium market is projected to grow at a 3.61% CAGR during 2026-2031. The market is expected to grow from 362.29 tons in 2026 to 432.58 tons by 2031.
Which product type accounts for the largest share of demand?
Alloys, mainly beryllium-copper grades, represented 72.91% of the 2025 volume.
Why is Asia-Pacific the leading consumer region?
Rapid electronics production and strong electric-vehicle output in China, Japan, and South Korea push Asia-Pacific to 37.78% of 2025 volume and the fastest regional CAGR.
What drives the rising automotive use of beryllium?
800-V EV architectures require high-conductivity connectors and thermal-stable contacts, elevating automotive demand at a 4.99% CAGR.
Page last updated on:


