Silicon Metal Market Size and Share
Market Overview
| Study Period | 2020 - 2031 |
|---|---|
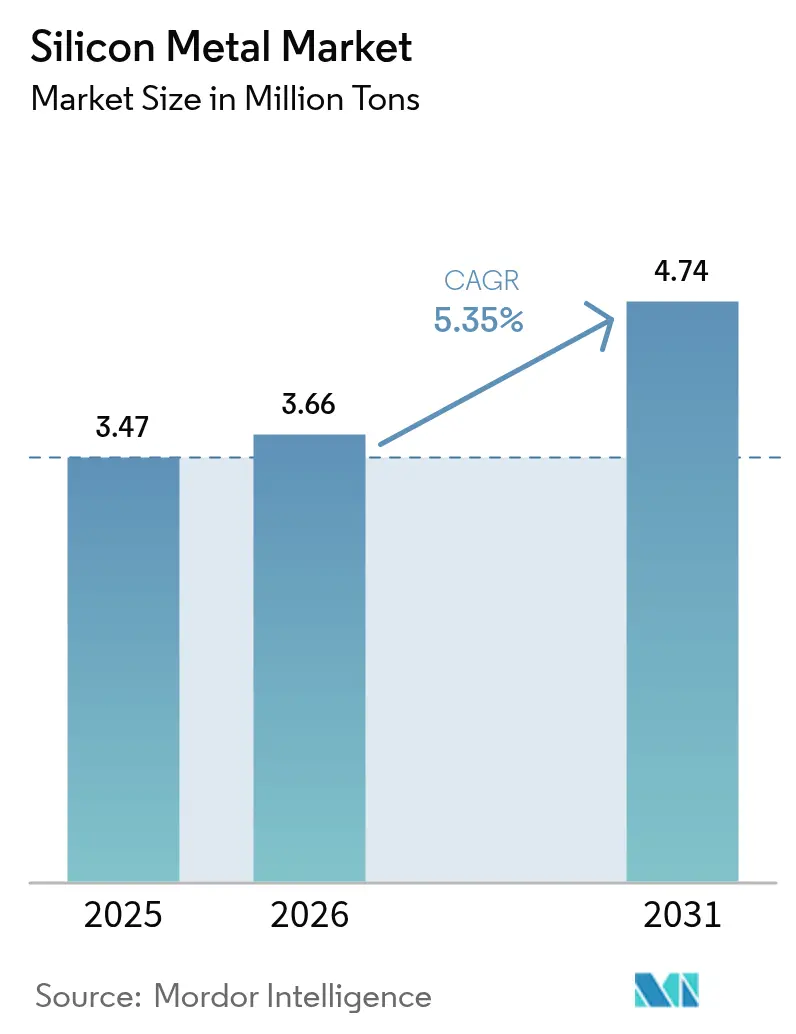
| Market Volume (2026) | 3.66 Million tons |
| Market Volume (2031) | 4.74 Million tons |
| Growth Rate (2026 - 2031) | 5.35% CAGR |
| Fastest Growing Market | Asia Pacific |
| Largest Market | Asia Pacific |
| Market Concentration | Medium |
Major Players *Disclaimer: Major Players sorted in no particular order Image © Mordor Intelligence. Reuse requires attribution under CC BY 4.0. | |
Silicon Metal Market Analysis by Mordor Intelligence
Silicon Metal Market size in 2026 is estimated at 3.66 million tons, growing from 2025 value of 3.47 million tons with 2031 projections showing 4.74 million tons, growing at 5.35% CAGR over 2026-2031. The upward trajectory reflects the material’s pivotal role in aluminum lightweighting, solar-PV modules, and silicon-anode batteries. Production cuts announced by Chinese smelters in April 2025 sharpened global supply awareness even as demand from automotive gigacasting, photovoltaic expansions, and semiconductor recovery stayed firm. Trade policy actions, including new U.S. antidumping petitions and existing tariffs on several Asian origins, have widened regional price spreads, elevating North American premiums but allowing Asian buyers to capitalize on lower spot values. Energy-intensive production economics and tightening carbon regulations continue to shift procurement toward low-emission suppliers. Parallel progress in silicon-anode technology, supported by sizable federal grants and private capital rounds, offers a nascent yet strategically important outlet that could cushion the silicon metal market against future cyclic downturns.
Key Report Takeaways
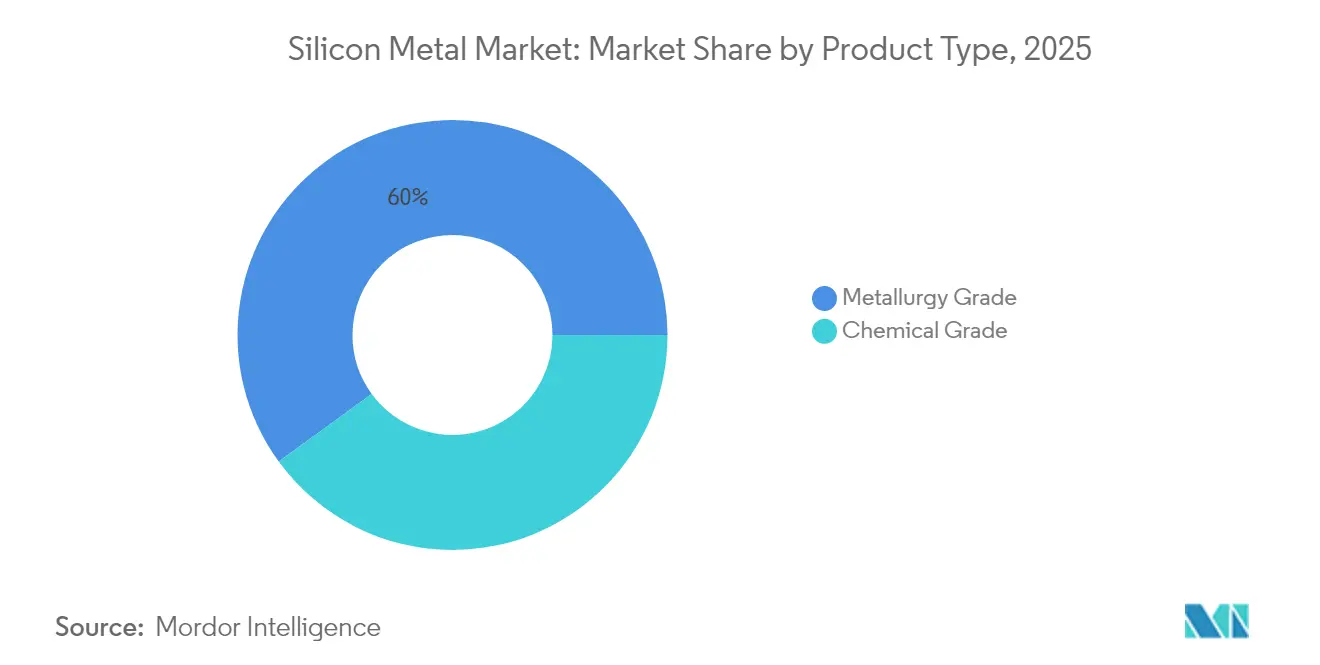
- By product type, metallurgy grade led with 60.02% of silicon metal market share in 2025 and posted the fastest 5.83% CAGR through 2031.
- By form, lump accounted for 44.62% share of the silicon metal market size in 2025 whereas powder registered a 6.25% CAGR forecast to 2031.
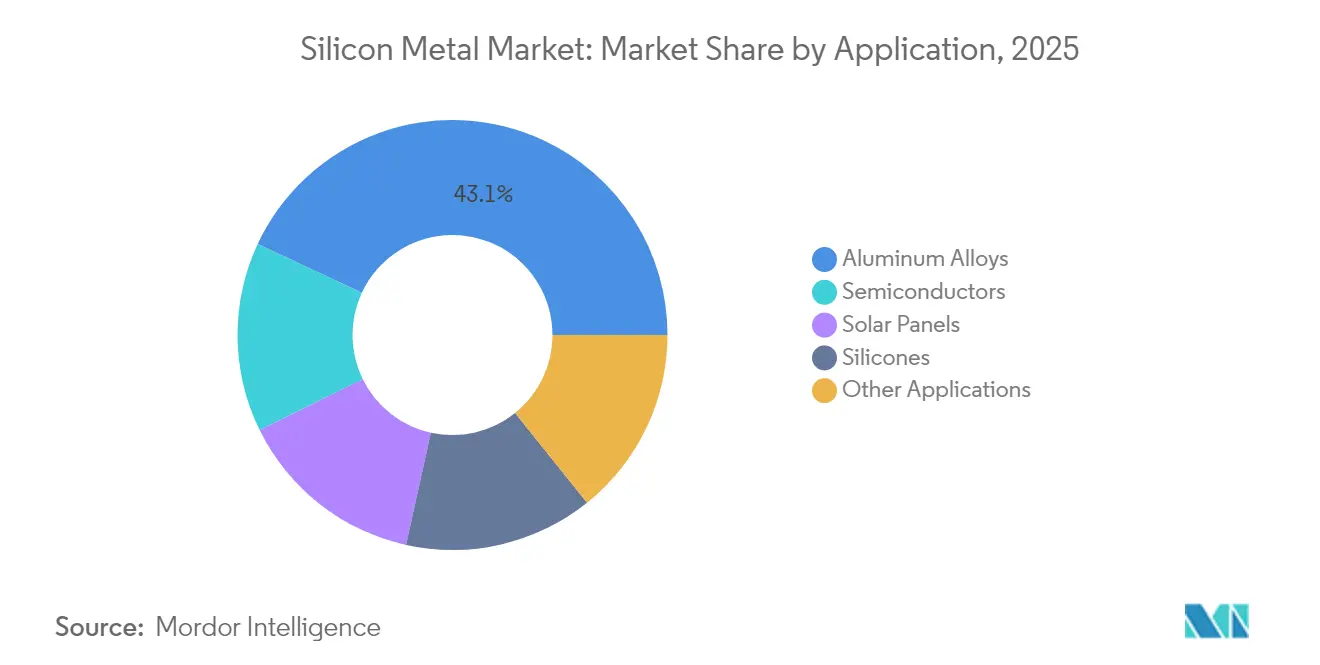
- By application, aluminum alloys captured 43.05% of the silicon metal market share in 2025; solar panels are projected to expand at 6.92% CAGR to 2031.
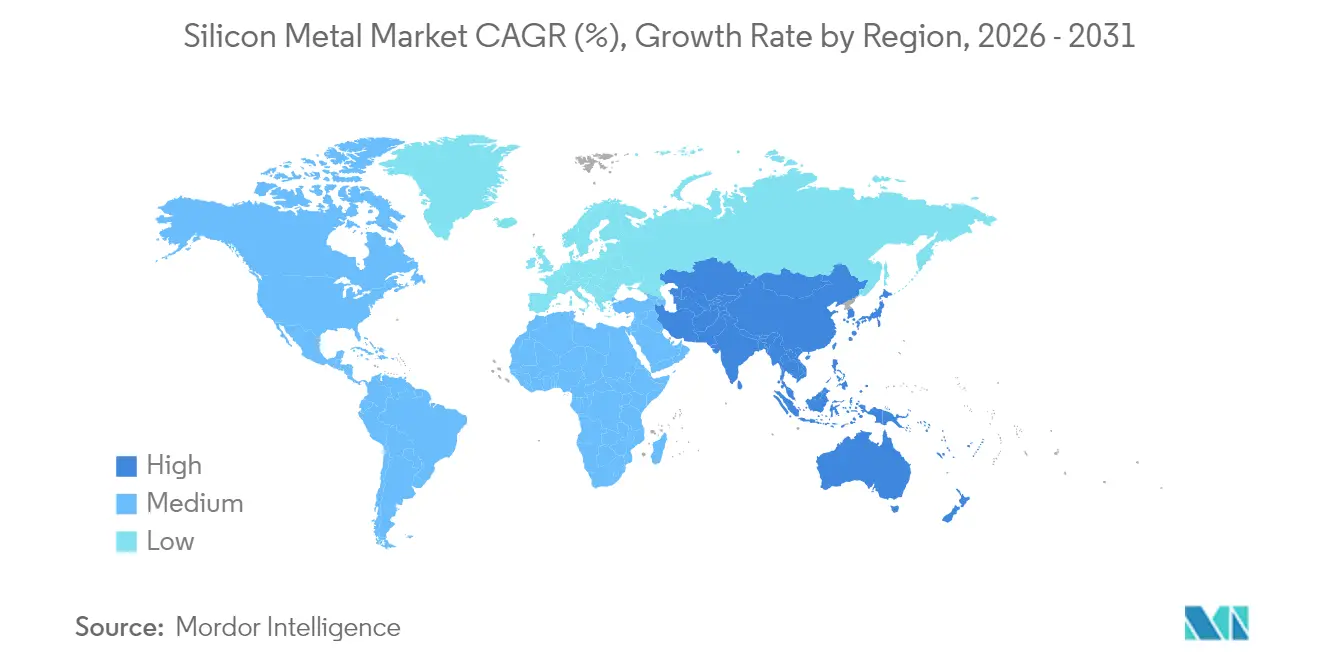
- By geography, Asia-Pacific commanded 67.74% share of the silicon metal market in 2025 and is advancing at a 5.78% CAGR through 2031.
Note: Market size and forecast figures in this report are generated using Mordor Intelligence’s proprietary estimation framework, updated with the latest available data and insights as of 2026.
Global Silicon Metal Market Trends and Insights
Driver Impact Analysis*
| Drivers | (~) % Impact on CAGR Forecast | Geographic Relevance | Impact Timeline |
|---|---|---|---|
| Lightweight Al-Alloy demand boom | +1.2% | APAC and North America | Medium term (2-4 years) |
| Solar-PV capacity additions accelerating | +1.8% | Global, led by APAC and emerging markets | Short term (≤ 2 years) |
| Expanding global silicones capacity | +1.1% | North America, Europe, APAC | Medium term (2-4 years) |
| Semiconductor content growth per device | +0.9% | Global, concentrated in APAC hubs | Long term (≥ 4 years) |
| Silicon-anode batteries commercialising | +0.4% | North America and APAC early adopters | Long term (≥ 4 years) |
| Source: Mordor Intelligence | |||


Lightweight Al-Alloy Demand Boom (Automotive and EV)
Automotive OEMs are raising aluminum content per vehicle because lighter structures extend driving range without enlarging battery packs. Tesla’s gigacasting adoption spurred other EV start-ups in China to replicate large aluminum body sections that need high-purity metallurgy-grade silicon additives. Aluminum foundries in the United States and Europe have announced capacity expansions that secure local alloy grades yet intensify demand for stable silicon inputs. Chinese alloy producers keep price leadership thanks to scale, though higher freight and tariff barriers erode some of that edge for buyers west of the Pacific. As more battery enclosures move from cast iron to aluminum, silicon metal purchases from automotive tier-ones rise in tandem with every new EV platform rollout. The driver therefore underpins steady baseline growth in the silicon metal market even when cyclical sectors fluctuate.
Solar-PV Capacity Additions Accelerating
China shipped 499 gigawatts of PV modules in 2024 and targets more than 580 gigawatts in 2025. Polysilicon oversupply forced leading Chinese producers to cut furnace utilization below 40% yet the government’s clean-energy mandate keeps greenlighting new downstream capacity. India, Brazil, and the Middle East accelerate solar flotillas that lean on imported ingots, adding breadth to global demand. Although polysilicon margins compressed severely, silicon metal consumption for rod reactors remains tied to long-term installation curves, not quarterly price swings. As modules become more efficient, wafer makers compensate by using higher quality feedstock, indirectly lifting purity requirements for chemical-grade silicon. Even with short-term volatility, the multi-year solar buildout reinforces a strong positive contribution to the overall silicon metal market.
Expanding Global Silicones Capacity
Dow, Wacker Chemie, and Shin-Etsu each approved multi-year debottlenecks that lift silicone elastomer volumes for construction and automotive sealants. Unlike solar or semiconductors, silicones tap many end-markets, buffering demand across economic cycles. New architectural codes that mandate weather-resistant façades fuel the adoption of silicone-based coatings, especially in Southeast Asia’s tropical climates. Electronics OEMs specify thermal interface materials made from specialty silicones that dissipate heat in high-power servers, adding premium pull on high-purity silicon metal feedstock. North American converters pursue domestic sourcing to hedge logistical risk, supporting new smelter feasibility studies in Canada. The diversified consumption pattern supplies a stable tailwind for the silicon metal market, limiting exposure to single-sector swings.
Semiconductor Content Growth per Device
Wafer shipments are projected to rise between 11% and 19% in 2025 as AI servers and edge devices proliferate[1]SEMI, “Quarterly Wafer Shipment Forecast,” semi.org. Advanced packaging requires a larger die per package as well as through-silicon vias, lifting raw silicon intensity. Taiwan’s TSMC and South Korea’s Samsung both run multibillion-dollar fabs that backstop bulk polysilicon demand. While memory downturns can dent near-term offtake, the secular trend toward higher transistor counts sustains a positive slope. Emerging silicon-on-insulator substrates impose stricter impurity specifications, favoring suppliers with upgraded refining lines. The geographically concentrated node ecosystem in East Asia underlines the need for secure feedstock, reinforcing a long-term, albeit moderate, boost to the silicon metal market.
Restraint Impact Analysis*
| Restraints | (~) % Impact on CAGR Forecast | Geographic Relevance | Impact Timeline |
|---|---|---|---|
| High energy-cost and CO₂-intensive production | -1.5% | Europe and North America | Short term (≤ 2 years) |
| China-centric supply-chain price volatility | -0.8% | Global, acute in import-dependent regions | Medium term (2-4 years) |
| Forced-labor trade restrictions risk | -0.6% | Global, concentrated on Xinjiang-sourced materials | Medium term (2-4 years) |
| Source: Mordor Intelligence | |||
High Energy-Cost and CO₂-Intensive Production
Producing 1 ton of silicon metal consumes near 12 megawatt-hours of electricity, exposing smelters to volatile power tariffs across Europe and parts of North America. EU carbon prices above EUR 80 per ton CO₂ further burden Western players that already pay twice the grid rates typical in Yunnan or Sichuan. Elkem’s Norwegian pilot to capture furnace off-gas and recycle it as a reductant demonstrates proactive mitigation yet demands heavy capex. Absent such low-carbon upgrades, cost gaps can exceed USD 650 per ton, eroding regional competitiveness. Buyers with ESG mandates favor greener supply but balk at paying steep premiums, leading some European fabricators to import Asian material despite tariff exposure. The restraint suppresses expansion plans in high-cost geographies and drags on the global silicon metal market growth momentum.
Forced-Labor Trade Restrictions Risk
The Uyghur Forced Labor Prevention Act presumes all Xinjiang-origin silicon is tainted unless proven otherwise, obliging importers to produce rigorous traceability records[2]U.S. Department of Commerce, “Uyghur Forced Labor Prevention Act Entity List,” commerce.gov . Hoshine Silicon Industry’s inclusion on U.S. entity lists in 2024 exemplifies reputational exposure. Customs detentions delay shipments for months, forcing buyers to split supply lots and raise working capital buffers. Global brands issue supplier codes requiring independent audits, prompting some smelters to exit the region entirely. Compliance technology such as blockchain tracing raises overhead for smaller players, indirectly consolidating the market. While the restriction chiefly affects chemical-grade flows into polysilicon, spillover sentiment squeezes metallurgy-grade sales linked to suspect mines, dampening the silicon metal market outlook.
*Our forecasts treat driver/restraint impacts as directional, not additive. The impact forecasts reflect baseline growth, mix effects, and variable interactions.
Segment Analysis
By Product Type: Metallurgy Grade Maintains Volume Leadership
Metallurgy grade contributed 60.02% to 2025 shipments and is forecast to grow 5.83% annually on the back of sturdy aluminum alloy demand in automotive and aerospace. This portion of the silicon metal market size equated to just over 2.08 million tons and scales in near lockstep with aluminum casting output in China, the United States, and Mexico. Gigacasting adoption multiplies alloy ingot pull per vehicle, embedding silicon at roughly 7% weight in key alloy series. Asian smelters leverage hydro-power and large submerged-arc furnaces to deliver low-cost feedstock, helping the silicon metal market maintain competitive pricing despite energy hikes elsewhere. Looking ahead, 3D-printed aluminum structures could modestly reduce melt volumes yet raise purity requirements, supporting premium niches.
Chemical grade covers the balance and supports polysilicon, silicones, and semiconductor raw material flows that swing with technology cycles. Silicon metal market share for chemical grade fell marginally in 2025 as polysilicon oversupply pressed volumes, but replacement demand from electronics and EV battery supply chains caps the downside. Vertical integrators aligned with wafer and chemical plants hedge price risk by self-consuming, shielding margins when external orders soften. Over the forecast, modest recovery in solar investment and stable silicones end-markets keeps chemical-grade CAGR in the 4% zone, slower than metallurgy yet integral to the silicon metal market’s resilience.


By Form: Powder Segment Rises on Advanced Applications
Lump still dominated at 44.62% in 2025 due to ease of charging submerged-arc furnaces and lower processing cost. Nevertheless, powder shipments are climbing 6.25% per year, and the share of the silicon metal market size tied to powders could top 29.00% by 2031. Fine powders under 10 microns supply lithium-ion battery anodes, thermal interface pastes, and metal additive manufacturing. Producers invest in inert-gas atomizers to achieve spherical morphology that improves flowability in laser sintering systems, thereby carving out high-margin channels. Granules remain important for chemical reactions that rely on surface-area control, but growth is moderate.
Powder’s ascent attracts newcomers specializing in chemical vapor deposition coatings and composite matrix fillers. Prices hover 15-18% above lump on an equivalent silicon basis, cushioning margins against energy inflation. Regulatory scrutiny over dust hazards spurs the adoption of encapsulated handling systems that raise barriers to entry. Over time, inter-material competition from nano-silica and silicon carbide may temper absolute growth, but the powder form’s flexibility locks it in as the fastest contributor to incremental demand across the silicon metal market.
By Application: Solar Panels Outpace Long-Time Alloy Leader
Aluminum alloys absorbed 43.05% of global consumption in 2025 and continue as the cornerstone of the silicon metal market. Every metric ton of AlSi castings requires 70–100 kilograms of silicon, and the automotive transition to lightweight frames anchors a durable baseline. Construction extrusions in the Middle East and Southeast Asia add further volume, extending geographic spread. Yet solar panels now hold the highest growth slot at 6.92% CAGR to 2031, primed by ambitious climate targets and falling module costs.
Polysilicon’s current glut reduced furnace run-rates, but module shipment momentum remains intact, ensuring that chemical grade uptake resumes once destocking concludes. Semiconductor and silicones applications share roughly equal slices near 10% each, giving the silicon metal market diverse income streams. Niche emerging uses range from high-entropy alloys for aerospace to porous silicon in next-gen sensors. Some of these pathways could unlock step-change demand if commercial hurdles fall, but the core application mix remains stable throughout the outlook.
Geography Analysis
Asia-Pacific delivered 67.74% of 2025 tonnage and is tracking a 5.78% CAGR to 2031, supported by China’s integrated mine-to-module clusters that shorten lead times and compress cost. Yunnan’s hydro-rich grid lowers power tariffs, maintaining smelter breakevens even with carbon fees. Japan and South Korea add refined demand via cutting-edge semiconductors and EV platforms. Indonesia channels USD 45.74 billion into silica downstreaming to hatch regional alternatives that hedge against Chinese dominance.
North America logged premium spot prices as antidumping probes steered imports away, magnifying supply tightness. The Inflation Reduction Act’s domestic content rules encourage fresh furnace projects in the Pacific Northwest, where hydro-power can partially neutralize energy cost headwinds. Canada positions its low-carbon grid as a magnet for OEMs seeking ESG-compliant alloys. Europe faced similar cost challenges with electricity tariffs, yet, embraced innovation grants to advance CO₂-free process pilots, keeping capacity viable through technology differentiation.
Brazil leverages abundant quartzite and existing metallurgical know-how, while Gulf Cooperation Council members channel cheap natural gas and solar power into aluminum complexes that require silicon alloying. Africa focuses on solar-PV buildouts in high-insolation corridors, promising a future lift in polysilicon-related demand. The mosaic underscores how regional energy economics and policy filters govern the silicon metal market’s evolving geography.

Competitive Landscape
The silicon metal industry is moderately fragmented. Elkem, Ferroglobe, Wacker Chemie, GCL Technology, and Hoshine leverage scale and integrated supply. Chinese producers trimmed output in April 2025 to stabilize domestic margins, signaling coordinated supply stewardship. Trade policies reshape the playing field. The April 2025 U.S. petitions applied pressure on Australian, Laotian, Norwegian, and Thai exporters, prompting some to reroute volumes to Europe and Japan. Technology investment represents another front: companies pair submerged-arc furnaces with photovoltaic power arrays to mitigate electricity volatility, while powder specialists build proprietary surface treatments to secure battery OEM approvals.
Silicon Metal Industry Leaders
Elkem ASA
Ferroglobe
Hoshine Silicon Industry Co., Ltd.
Rusal
Wacker Chemie AG
- *Disclaimer: Major Players sorted in no particular order

Recent Industry Developments
- April 2025: U.S. producers Ferroglobe and Mississippi Silicon filed antidumping and countervailing duty petitions covering imports from Australia, Laos, Norway, and Thailand, citing unfair subsidies and margin injury.
- November 2024: Elkem secured an EU Innovation Fund award to pilot carbon-capture reuse at Norwegian plants with the goal of producing CO₂-free silicon metal.


Global Silicon Metal Market Report Scope
Silicon is a metallic element derived from quartz and carbonaceous raw materials through a smelting process. It is a hard, brittle, shiny gray metalloid with high thermal and electrical conductivity. Silicon metal is primarily composed of silicon and small amounts of impurities such as iron, aluminum, calcium, and magnesium. It is commonly used as an alloying agent in the production of aluminum alloys, ferrosilicon alloys, and other specialty alloys.
The silicon metal market is segmented by product type, applications, and geography. On the basis of product type, the market is segmented into metallurgy grade and chemical grade. On the basis of applications, the market is segmented into aluminum alloys, semiconductors, solar panels, silicones, and other applications (construction and infrastructure). The report also covers the market size and forecast for silicon metal in 27 countries across major regions.
For each segment, the market sizing and forecast have been done based on volume (tons).
| Metallurgy Grade |
| Chemical Grade |
| Lump |
| Powder |
| Granules |
| Aluminum Alloys |
| Semiconductors |
| Solar Panels |
| Silicones |
| Other Applications |
| Asia-Pacific | China |
| India | |
| Japan | |
| South Korea | |
| Malaysia | |
| Thailand | |
| Indonesia | |
| Vietnam | |
| Rest of Asia-Pacific | |
| North America | United States |
| Canada | |
| Mexico | |
| Europe | Germany |
| United Kingdom | |
| France | |
| Italy | |
| Spain | |
| Turkey | |
| Russia | |
| Nordic Countries | |
| Rest of Europe | |
| South America | Brazil |
| Argentina | |
| Colombia | |
| Rest of South America | |
| Middle-East and Africa | Saudi Arabia |
| United Arab Emirates | |
| Qatar | |
| Egypt | |
| Nigeria | |
| South Africa | |
| Rest of Middle-East and Africa |
| By Product Type | Metallurgy Grade | |
| Chemical Grade | ||
| By Form | Lump | |
| Powder | ||
| Granules | ||
| By Application | Aluminum Alloys | |
| Semiconductors | ||
| Solar Panels | ||
| Silicones | ||
| Other Applications | ||
| By Geography | Asia-Pacific | China |
| India | ||
| Japan | ||
| South Korea | ||
| Malaysia | ||
| Thailand | ||
| Indonesia | ||
| Vietnam | ||
| Rest of Asia-Pacific | ||
| North America | United States | |
| Canada | ||
| Mexico | ||
| Europe | Germany | |
| United Kingdom | ||
| France | ||
| Italy | ||
| Spain | ||
| Turkey | ||
| Russia | ||
| Nordic Countries | ||
| Rest of Europe | ||
| South America | Brazil | |
| Argentina | ||
| Colombia | ||
| Rest of South America | ||
| Middle-East and Africa | Saudi Arabia | |
| United Arab Emirates | ||
| Qatar | ||
| Egypt | ||
| Nigeria | ||
| South Africa | ||
| Rest of Middle-East and Africa | ||


Key Questions Answered in the Report
How fast is global demand for silicon metal expected to grow through 2031?
Volume expands from 3.66 million tons in 2026 to 4.74 million tons in 2031 at a 5.35% CAGR.
Which region commands the largest share of silicon metal consumption?
Asia-Pacific accounted for 67.74% in 2025, driven by integrated supply chains and lower power costs.
What application will add the most incremental tons by 2031?
Solar panels lead growth at a 6.92% CAGR as global PV installations rise despite current polysilicon oversupply.
Why are Western smelters investing in carbon-capture technology?
High energy prices and EU carbon charges threaten cost competitiveness, so low-carbon upgrades help secure market access and price premiums.
How are trade policies influencing regional silicon prices?
U.S. antidumping actions and existing tariffs widen spreads, lifting North American prices to USD 2,751 per ton versus USD 1,459 in Asia-Pacific.
Page last updated on:


