Polysilicon Market Size and Share
Market Overview
| Study Period | 2021 - 2031 |
|---|---|
| Market Size (2026) | USD 18.45 Billion |
| Market Size (2031) | USD 34.19 Billion |
| Growth Rate (2026 - 2031) | 13.13% CAGR |
| Fastest Growing Market | Asia Pacific |
| Largest Market | Asia Pacific |
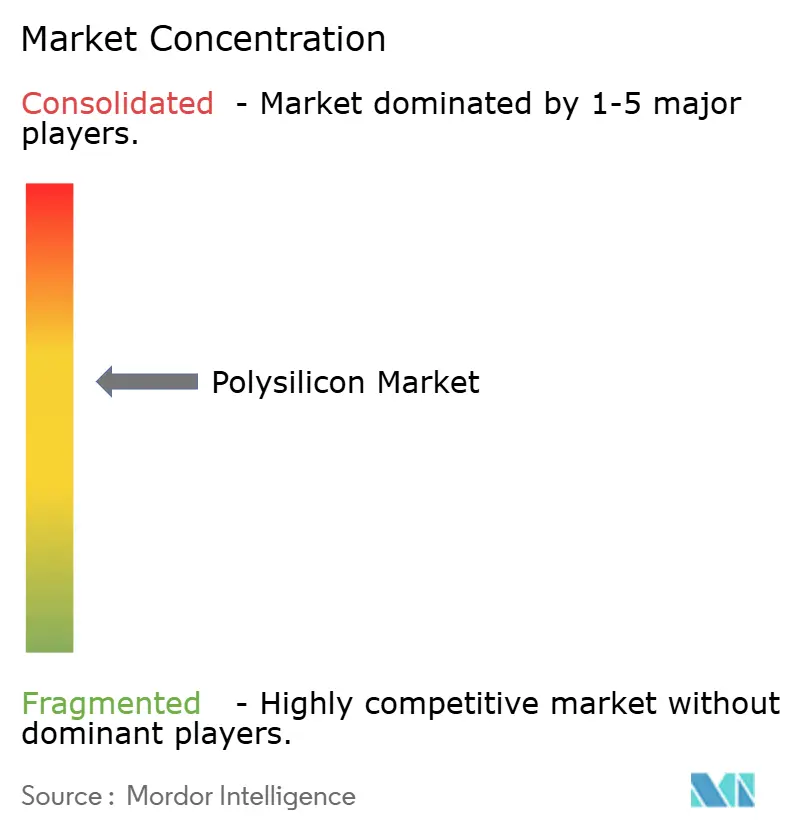
| Market Concentration | Medium |
Major Players *Disclaimer: Major Players sorted in no particular order Image © Mordor Intelligence. Reuse requires attribution under CC BY 4.0. | |
Polysilicon Market Analysis by Mordor Intelligence
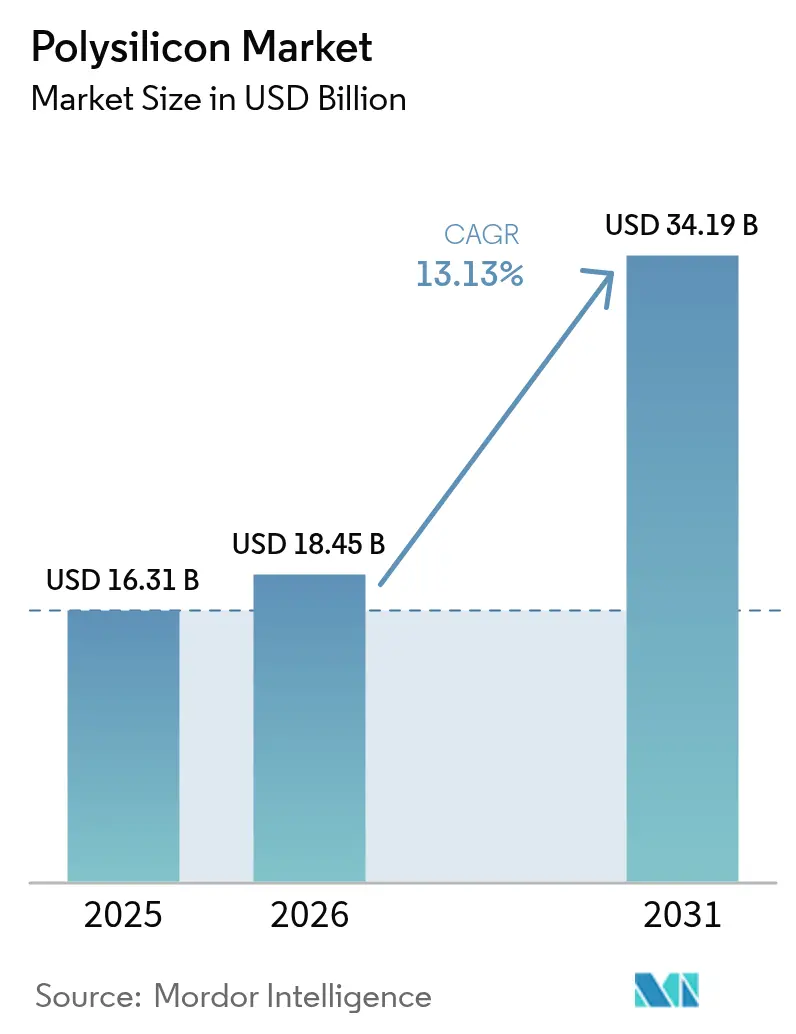
The Polysilicon Market size is expected to grow from USD 16.31 billion in 2025 to USD 18.45 billion in 2026 and is forecast to reach USD 34.19 billion by 2031 at 13.13% CAGR over 2026-2031. Increasing semiconductor investments below the 3-nanometer node, growing demand for N-type TOPCon solar cells, and on-shoring incentives in the United States and Europe are tightening the supply of high-purity feedstock and strengthening long-term pricing power. In China, production cuts periodically reduce inventories, causing spot prices to fluctuate by double-digit percentages within weeks. The polysilicon market is also undergoing a cost structure transformation, as fluidized bed reactor (FBR) technology reduces energy consumption by 20-25% compared to the dominant Siemens process, targeting a cost floor of USD 6 per kilogram, which poses a challenge to traditional margins. Policy changes further shape the market dynamics: Europe’s Carbon Border Adjustment Mechanism (CBAM) offers a 5-10% premium for low-carbon materials, while the U.S. Inflation Reduction Act provides a USD 3 per kilogram credit, narrowing the landed-cost differential.
Key Report Takeaways
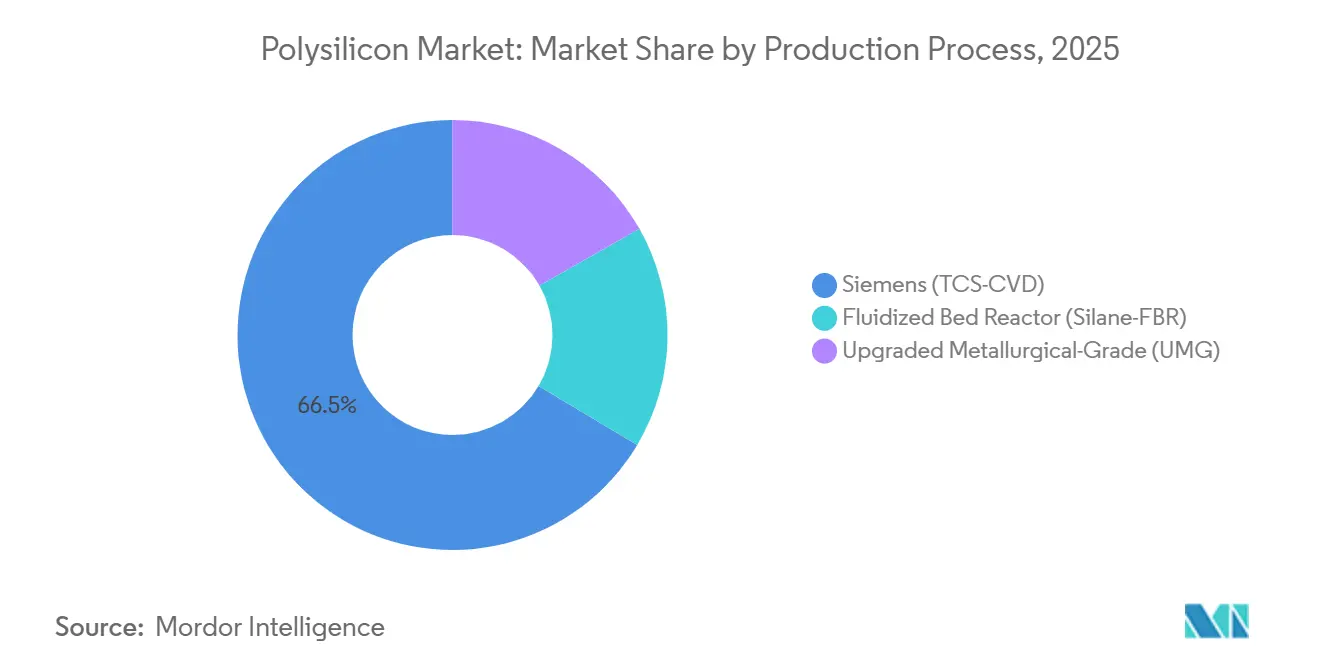
- By production process, Siemens (TCS-CVD) led with 66.46% of the polysilicon market share in 2025, while Fluidized Bed Reactor (Silane-FBR) is forecast to increase at a 14.26% CAGR through 2031.
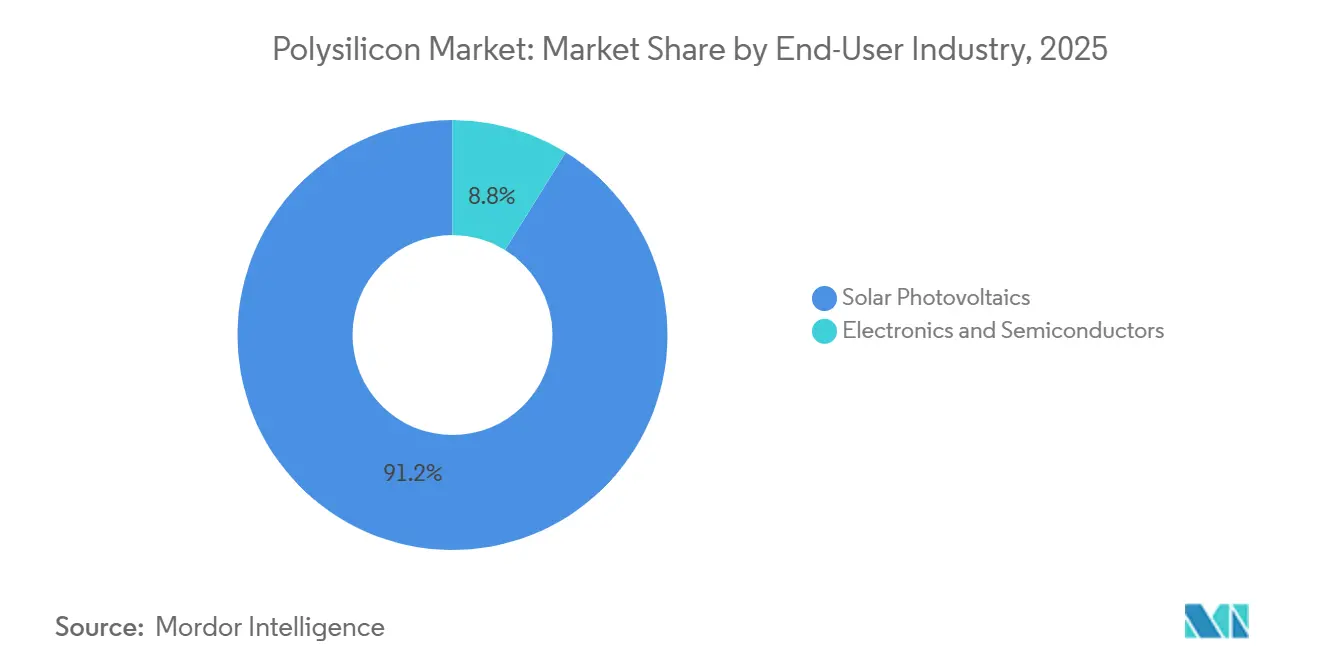
- By end-user industry, solar photovoltaics commanded 91.18% of the polysilicon market share in 2025 and is projected to grow at a 13.78% CAGR to 2031.
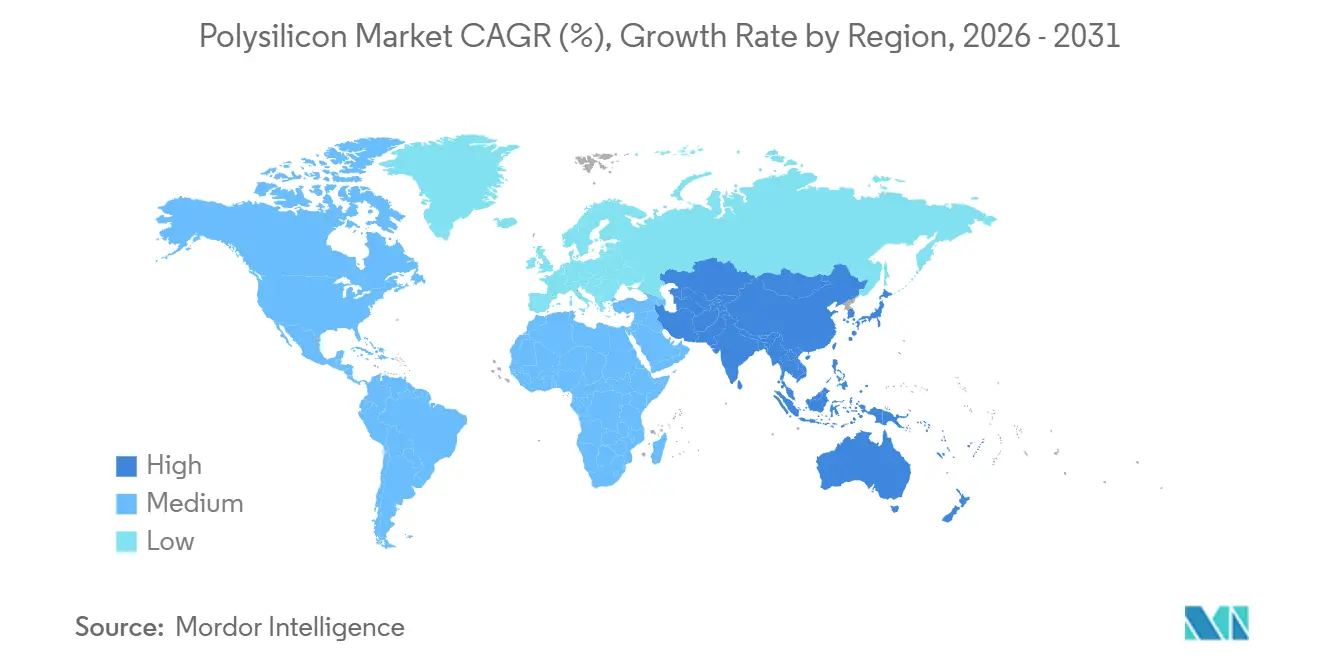
- By geography, Asia-Pacific captured 64.37% of the polysilicon market share in 20252025 and is set to expand at a 13.88% CAGR through 2031.
Note: Market size and forecast figures in this report are generated using Mordor Intelligence’s proprietary estimation framework, updated with the latest available data and insights as of 2026.
Global Polysilicon Market Trends and Insights
Drivers Impact Analysis*
| Driver | (~) % Impact on CAGR Forecast | Geographic Relevance | Impact Timeline |
|---|---|---|---|
| Semiconductor CAPEX super-cycle (≤3 nm) | +2.1% | Global, concentrated in Taiwan, South Korea, United States | Medium term (2-4 years) |
| On-shoring incentives (IRA, Fit-for-55, etc.) | +2.8% | North America and Europe, spill-over to Middle-East | Long term (≥4 years) |
| Ultra-high-purity demand for N-type TOPCon/IBC | +3.4% | Global, led by China, spreading to Southeast Asia | Short term (≤2 years) |
| Low-carbon polysilicon premium under CBAM | +1.6% | Europe, indirect impact on Asia-Pacific exporters | Medium term (2-4 years) |
| Perovskite-silicon tandem pilot-line ramp-up | +0.9% | Global, early adoption in Europe and China | Long term (≥4 years) |
| Source: Mordor Intelligence | |||
Semiconductor CAPEX Super-Cycle (≤ 3 nm)
Taiwan Semiconductor Manufacturing Company and Samsung Foundry are set to invest over USD 100 billion between 2024 and 2027 to develop 3-nanometer and 2-nanometer nodes. These nodes demand polysilicon with metallic impurities below 0.01 parts per billion. Only six Siemens-process producers can achieve this level of purity, driving utilization rates above 95% by late 2025 and reducing lead times for chipmakers. The CHIPS Act’s USD 325 million grant to Hemlock Semiconductor will increase semiconductor-grade capacity by 10,000 metric tons by 2027, further tightening the electronics supply chain. Gate-all-around transistor designs require 8% more polysilicon per wafer compared to FinFET structures, increasing material demand even as solar demand stabilizes in mature markets. Additionally, China’s push to localize 7-nanometer production under export-control pressures is paradoxically raising silicon intensity due to lower yields necessitating more wafer starts.
On-Shoring Incentives (IRA, Fit-for-55)
The U.S. Inflation Reduction Act provides USD 3 per kilogram for domestic polysilicon and USD 12 per square meter for wafers, reducing the delivered-cost gap with Chinese suppliers from 30% to single digits when combined with existing anti-dumping tariffs. REC Silicon resumed operations at its Moses Lake facility in late 2023, achieving 1,784 metric tons of quarterly output by Q3 2024 and targeting a 10,000-ton annual run rate by mid-2026. Europe’s Fit-for-55 package does not directly subsidize production but bans modules with a carbon intensity above 50 kg CO₂/kg Si from public tenders after 2027, effectively requiring hydropower-sourced silicon[1]European Commission, “CBAM Transitional Phase Guidance,” europa.eu. Wacker uses Bavarian hydroelectricity to produce sub-20 kg CO₂/kg material, marketed at a 5% premium, appealing to utility-scale developers focused on ESG compliance. The Middle-East is emerging as a competitive player, with Qatar Solar Technologies and United Solar utilizing natural-gas power to achieve 35 kg CO₂/kg, meeting early CBAM thresholds while underpricing Western output.
Ultra-High-Purity Demand for N-Type TOPCon/IBC
N-type TOPCon cells accounted for over 60% of new capacity additions in 2024 and are projected to exceed 87% by 2035 due to efficiency gains that reduce the levelized cost of energy by 4-6% compared to PERC designs. This architecture requires feedstock resistivity uniformity within ±2%, limiting suppliers to Siemens operators with in-line spectroscopic controls. Interdigitated back-contact (IBC) designs demand 11-nines purity, as iron or chromium levels above 0.1 ppb degrade open-circuit voltage. Tongwei has invested USD 1.2 billion in closed-loop trichlorosilane recovery to supply 540,000 metric tons at USD 5.50 per kilogram, meeting TOPCon specifications while underpricing Western competitors by approximately 20%. As a result, multicrystalline silicon’s market share dropped to 5% in 2024 and continues to decline, as grain boundaries undermine TOPCon’s passivation benefits.
Low-Carbon Polysilicon Premium under CBAM
The European Union began tracking import carbon intensities in 2023 and will implement tariffs in 2026 based on embedded emissions. Coal-heavy Xinjiang plants emit 60-80 kg CO₂/kg, while hydropower-based Sichuan operations average 15-25 kg, enabling a 5-10% premium for low-carbon supply in European tenders. GCL TECH offers FBR granular silicon at USD 6 per kilogram, using 40% less energy, combining a low-carbon profile with cost advantages. Module manufacturers are securing offtake agreements that cap carbon intensity and require ISO 14064 verification, adding 2-3% to procurement costs but protecting buyers from future CBAM tariffs. The regulation is also attracting Middle-Eastern entrants to the value chain, as natural-gas electricity achieves emission levels comparable to hydropower-based Siemens plants while remaining more cost-effective than European production.
Restraints Impact Analysis*
| Restraint | (~) % Impact on CAGR Forecast | Geographic Relevance | Impact Timeline |
|---|---|---|---|
| UMG-Si substitution in low-spec PV | -1.4% | Asia-Pacific, selective adoption in cost-sensitive markets | Medium term (2-4 years) |
| Forced-labour audit exposure (Xinjiang) | -2.2% | Global supply chains, concentrated impact on North America and Europe | Short term (≤2 years) |
| High water-intensity and regional scarcity risk | -1.1% | China (Xinjiang, Inner Mongolia), emerging in Middle-East | Long term (≥4 years) |
| Source: Mordor Intelligence | |||
UMG-Si Substitution in Low-Spec PV
Upgraded metallurgical-grade silicon (UMG-Si), refined to 4- or 5-nines purity, is gaining traction among Tier-2 module manufacturers willing to trade 0.5-1 percentage-point efficiency for 15-20% cheaper feedstock. Chinese ingot pullers have blended up to 10% UMG-Si into multicrystalline boules, pushing marginal Siemens plants with breakeven costs above USD 8 per kilogram into temporary shutdowns, totaling approximately 50,000 metric tons since early 2024. However, phosphorus and boron residues in UMG-Si cause resistivity drift, reducing cell efficiency by 2-3% over a decade, limiting its adoption in bankable, financing-grade projects.
Forced-Labor Audit Exposure (Xinjiang)
The U.S. Uyghur Forced Labor Prevention Act presumes goods from Xinjiang are tainted unless importers provide “clear and convincing” evidence to the contrary, leading to over 3,000 detained solar shipments in 2024[2]U.S. Customs and Border Protection, “Uyghur Forced Labor Prevention Act Statistics,” cbp.gov. Tier-1 assemblers, including Trina and JA Solar, have committed to traceable supply chains, segregating Xinjiang material that benefits from USD 0.03/kWh coal electricity. European buyers face similar obligations under the Corporate Sustainability Due Diligence Directive, increasing compliance costs by USD 0.02-0.03 per watt and creating a two-tier price structure where non-Xinjiang polysilicon commands a 3-5% premium. Producers in Sichuan and Yunnan are expanding capacity to meet this differentiated demand, though their reliance on hydropower raises costs by up to USD 1 per kilogram compared to coal-fired competitors.
*Our forecasts treat driver/restraint impacts as directional, not additive. The impact forecasts reflect baseline growth, mix effects, and variable interactions.
Segment Analysis
By Production Process: Siemens Dominance Faces FBR Disruption
Siemens (TCS-CVD) accounted for 66.46% of the polysilicon market share in 2025, underpinning the polysilicon market size for feedstock, achieving 11-nines semiconductor purity. However, the Fluidized Bed Reactor (Silane-FBR) process is growing at a 14.26% CAGR through 2031 by depositing silicon on seed particles at 600-700°C, reducing electricity consumption by 40% and lowering capital costs to USD 15,000-20,000 per metric ton.
GCL TECH’s granular silicon platform achieved 120,000 metric tons in 2024 and aims for a cost of USD 6 per kilogram by 2026, increasing the price gap that challenges older Siemens lines operating above USD 8 per kilogram. Hybrid facilities like REC Silicon’s Moses Lake are adopting both processes to benefit from Inflation Reduction Act credits for solar and semiconductor-grade production. Despite these developments, Siemens technology remains essential for chip-grade polysilicon, as only six global operators meet the stringent metallic impurity threshold of below 0.01 ppb, ensuring their pricing power remains protected from solar market fluctuations.


By End-user Industry: Solar PV Dominance with Semiconductor Resilience
Solar photovoltaics accounted for 91.18% of polysilicon output in 2025 and is projected to grow at a CAGR of 13.78% through 2031, driven by the adoption of TOPCon and perovskite-silicon tandem technologies. Monocrystalline wafers, now representing over 95% of cell production, require 5.5-6 grams of silicon per watt, maintaining high polysilicon demand despite incremental efficiency improvements.
The electronics industry commands a 3-4× price premium due to its requirement for 9- to 11-nines purity and sub-0.01 ppb metallic impurity specifications, which disqualify FBR and UMG-Si feedstock. TSMC’s gate-all-around nodes have increased silicon usage per wafer by 8%, while Hemlock’s CHIPS Act-supported 10,000-ton expansion in Tennessee aims to reduce North America’s reliance on Asian imports by late 2026. Export restrictions on advanced lithography in China have indirectly boosted polysilicon demand, as older tools require more wafers to match the output of advanced nodes.
Geography Analysis
Asia-Pacific accounted for 64.37% of the polysilicon market value in 2025. Tongwei’s 540,000-ton production base and USD 5.50 per kilogram cash cost reinforce the region’s cost advantage. However, unsold inventory of 400,000 tons at the end of 2024 pushed spot prices below USD 7 per kilogram, leading to production cuts at facilities with breakeven costs above USD 8 per kilogram. India’s USD 2.4 billion Production-Linked Incentive scheme supports integrated PV manufacturing, but over 95% of its polysilicon is still imported from China and Southeast Asia. Japan’s Tokuyama is shifting to semiconductor-grade production to mitigate solar market cyclicality while leveraging its 11-nines purity expertise.
North America is revitalizing its polysilicon supply chain, supported by the Inflation Reduction Act’s USD 3 per kilogram incentive and Hemlock’s CHIPS Act grant, which have narrowed the cost gap with imports to less than 10%. REC Silicon’s Moses Lake facility aims to produce 10,000 tons by 2026, enabling domestic-content bonuses for module assemblers and reducing logistics costs for U.S. fabs. Canada’s 5 GW pipeline remains dependent on imports, highlighting potential for hydro-powered expansions near the U.S. border. Mexico’s access to the USMCA and low labor costs position it as a potential manufacturing hub, though grid instability and limited upstream expertise pose challenges.
Europe’s polysilicon market benefits from premium pricing dynamics. Wacker’s Burghausen facility, with a sub-20 kg CO₂/kg carbon footprint, commands a 5% price premium under CBAM reporting, offsetting higher labor and energy costs. Germany installed 14 GW of PV capacity in 2024 but still imports over 90% of its polysilicon, exposing buyers to geopolitical risks. The Middle-East is emerging as a competitive supplier, with Qatar Solar Technologies and UAE-based United Solar leveraging natural-gas electricity to achieve a 35 kg CO₂/kg intensity, avoiding early CBAM tariffs and underpricing European competitors. South America and Africa remain reliant on imports, though Brazil’s 10 GW utility pipeline and South Africa’s REIPPP expansion could justify regional production if freight costs rise.

Competitive Landscape
The polysilicon market remains concentrated, with the top five firms controlling approximately 64% of global capacity in 2025. However, pricing power is diminishing as FBR technology reduces production costs. Western suppliers rely on policy incentives, such as Hemlock and REC Silicon’s utilization of IRA and CHIPS credits, while Wacker capitalizes on CBAM-compliant low-carbon material for premium pricing. Vertical integration is a key strategy, with Tongwei and GCL TECH expanding into wafer and cell production, while LONGi and JA Solar secure long-term polysilicon offtake agreements with embedded carbon caps.
FBR technology is driving disruption, offering 40% lower energy consumption and faster ramp-up times by 12-18 months compared to Siemens reactors. Patent activity remains high, with Wacker and Hemlock filing over 20 process-improvement patents each during 2024-2025, focusing on closed-loop trichlorosilane recovery and plasma-enhanced deposition. ESG compliance is increasingly critical; ISO 14064 audits add 2-3% to overhead costs but enable access to European tenders exempt from CBAM fees. Forced labor concerns are fragmenting the market, as Xinjiang-origin silicon trades at a 3-5% discount and faces seizure risks in the United States, prompting producers to shift operations to Sichuan and Yunnan despite higher power tariffs.
Polysilicon Industry Leaders
Tongwei Co., Ltd
Wacker Chemie AG
GCL TECH
Xinte Energy Co., Ltd
Daqo New Energy Corp.
- *Disclaimer: Major Players sorted in no particular order

Recent Industry Developments
- February 2026: United Solar Holding began operations at its polysilicon production facility in the Sohar Freezone, Oman. The facility had an anticipated annual production capacity of 100,000 tons.
- August 2025: Chinese polysilicon producers proposed a RMB 50 billion (USD 7 billion) fund to acquire and shut down approximately one-third of the country's production capacity to address severe industry oversupply. The initiative included major producers such as Tongwei, GCL TECH, Daqo New Energy, among others.


Global Polysilicon Market Report Scope
Polycrystalline silicon is the key feedstock in the crystalline silicon-based photovoltaic industry and is used for the production of conventional solar cells.
The polysilicon market is segmented by production process, end-user industry, and geography. By production process, the market is segmented into Siemens (TCS-CVD), fluidized bed reactor (Silane-FBR), and upgraded metallurgical-grade (UMG). By end-user industry, the market is segmented into solar photovoltaics and electronics and semiconductors. The solar photovoltaics is further segmented into monocrystalline solar panel and multicrystalline solar panel. The report also covers the market size and forecasts for the polysilicon in 15 countries across major regions. For each segment, the market sizing and forecasts have been done on the basis of value (USD).
| Siemens (TCS-CVD) |
| Fluidized Bed Reactor (Silane-FBR) |
| Upgraded Metallurgical-Grade (UMG) |
| Solar Photovoltaics | Monocrystalline Solar Panel |
| Multicrystalline Solar Panel | |
| Electronics and Semiconductors |
| Asia-Pacific | China |
| India | |
| Japan | |
| South Korea | |
| Rest of Asia-Pacific | |
| North America | United States |
| Canada | |
| Mexico | |
| Europe | Germany |
| United Kingdom | |
| France | |
| Italy | |
| Rest of Europe | |
| South America | Brazil |
| Argentina | |
| Rest of South America | |
| Middle-East and Africa | Saudi Arabia |
| South Africa | |
| Rest of Middle-East and Africa |
| By Production Process | Siemens (TCS-CVD) | |
| Fluidized Bed Reactor (Silane-FBR) | ||
| Upgraded Metallurgical-Grade (UMG) | ||
| By End-user Industry | Solar Photovoltaics | Monocrystalline Solar Panel |
| Multicrystalline Solar Panel | ||
| Electronics and Semiconductors | ||
| By Geography | Asia-Pacific | China |
| India | ||
| Japan | ||
| South Korea | ||
| Rest of Asia-Pacific | ||
| North America | United States | |
| Canada | ||
| Mexico | ||
| Europe | Germany | |
| United Kingdom | ||
| France | ||
| Italy | ||
| Rest of Europe | ||
| South America | Brazil | |
| Argentina | ||
| Rest of South America | ||
| Middle-East and Africa | Saudi Arabia | |
| South Africa | ||
| Rest of Middle-East and Africa | ||


Key Questions Answered in the Report
What is the size of the polysilicon market?
The polysilicon market stands at USD 18.45 billion and is expected to reach USD 34.19 billion by 2031.
How fast is the fluidized bed reactor production process growing through 2031?
The fluidized bed reactor is forecast to grow at a 14.26% CAGR through 2031 as producers chase lower energy costs.
Which region holds the largest share of global polysilicon capacity in 2025?
Asia-Pacific commands 64.37% of the 2025 market value.
What incentive is driving U.S. polysilicon onshoring?
The Inflation Reduction Act grants USD 3 per kilogram for domestic polysilicon, narrowing the cost gap with imports.
Page last updated on:


