Membrane Water And Wastewater Treatment Market Size and Share
Market Overview
| Study Period | 2021 - 2031 |
|---|---|
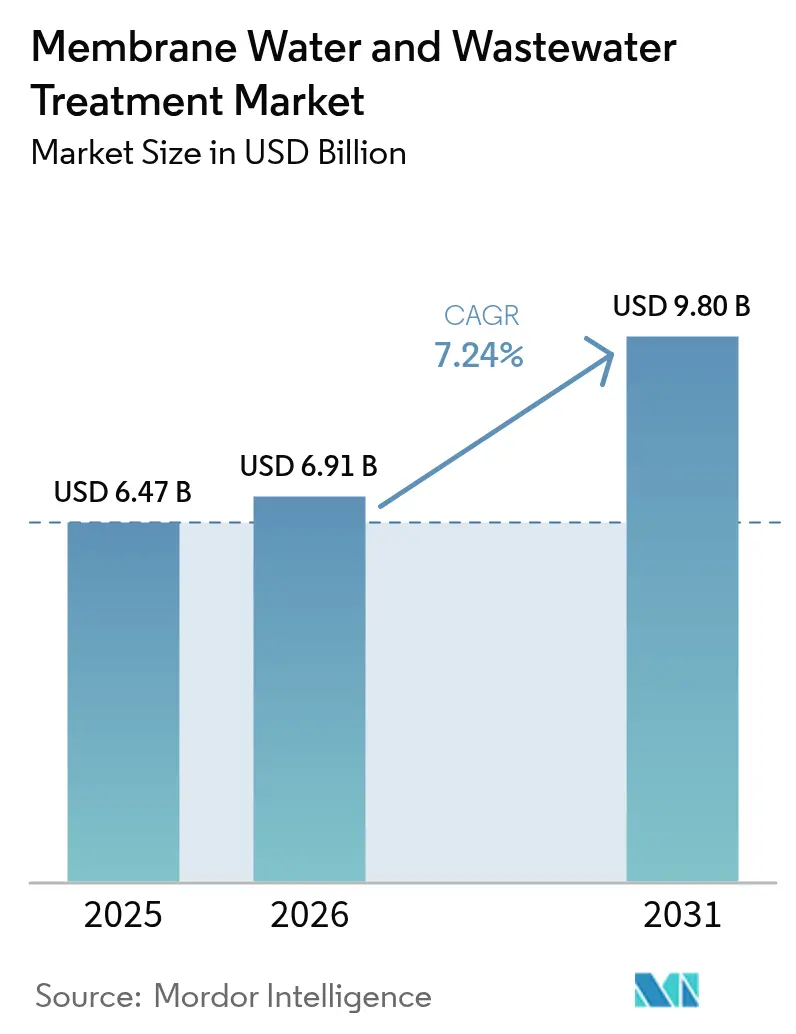
| Market Size (2026) | USD 6.91 Billion |
| Market Size (2031) | USD 9.80 Billion |
| Growth Rate (2026 - 2031) | 7.24% CAGR |
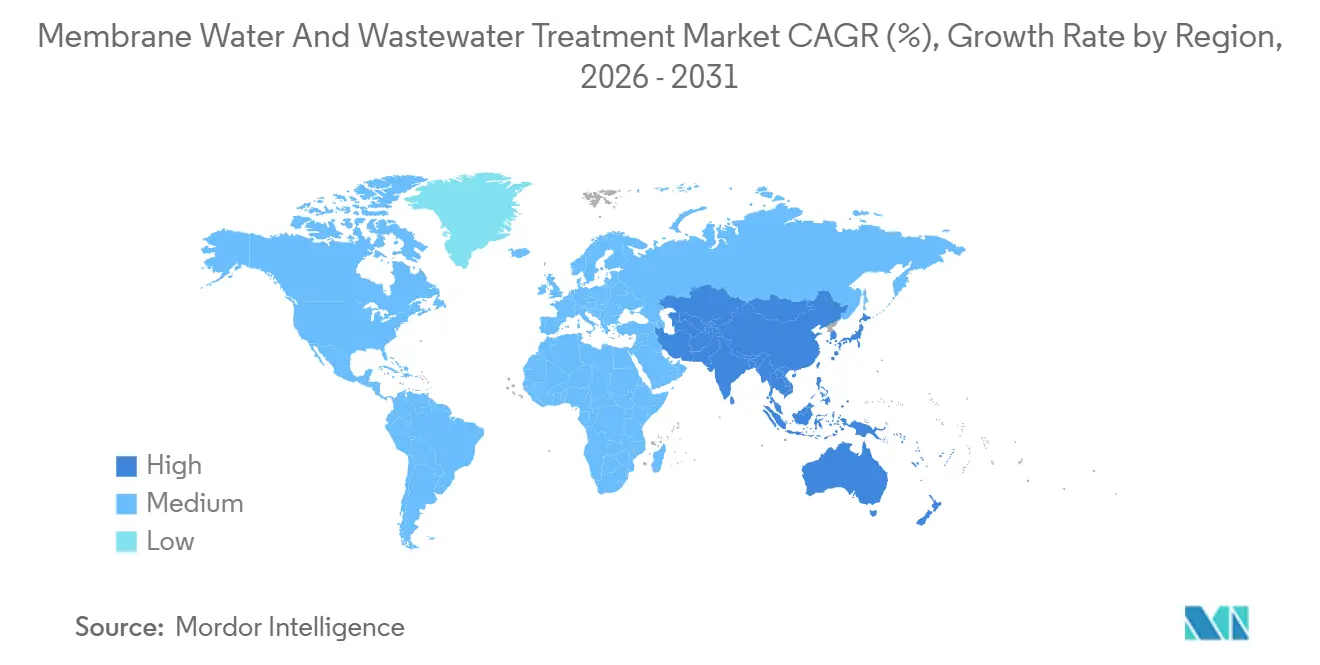
| Fastest Growing Market | Asia Pacific |
| Largest Market | Europe |
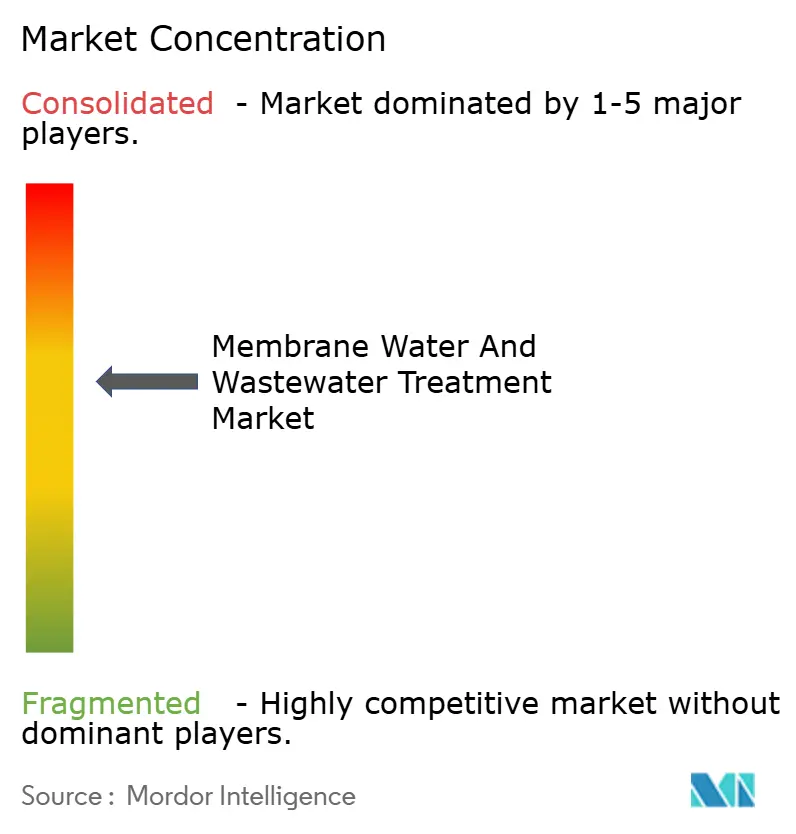
| Market Concentration | Medium |
Major Players *Disclaimer: Major Players sorted in no particular order Image © Mordor Intelligence. Reuse requires attribution under CC BY 4.0. | |
Membrane Water And Wastewater Treatment Market Analysis by Mordor Intelligence
The Membrane Water and Wastewater Treatment Market size is projected to be USD 6.47 billion in 2025, USD 6.91 billion in 2026, and reach USD 9.80 billion by 2031, growing at a CAGR of 7.24% from 2026 to 2031. As utilities and industrial operators grapple with stricter limits on micropollutants and per- and polyfluoroalkyl substances (PFAS), pressure-driven separation is overtaking traditional clarification methods. Europe's updated Urban Wastewater Treatment Directive, set to take effect in January 2025, requires enhanced treatment for populations exceeding 10,000 by 2045. This directive solidifies the demand for ultrafiltration and nanofiltration across all 27 member states. Reverse osmosis, already a leader in desalination retrofits, is poised for significant expansion, especially as plants in the Middle East and Asia-Pacific transition to energy-recovery-equipped, hollow-fiber stacks. While municipal utilities accounted for a substantial portion of revenue, the food and beverage sector—especially dairies and breweries embracing cold microfiltration—emerges as the fastest-growing end-user. Driven by regulatory frameworks, Europe commanded a leading share of revenue. Meanwhile, the Asia-Pacific region, led by China's urban water initiative emphasizing membrane bioreactors for most new plants, is set to outpace global growth.
Key Report Takeaways
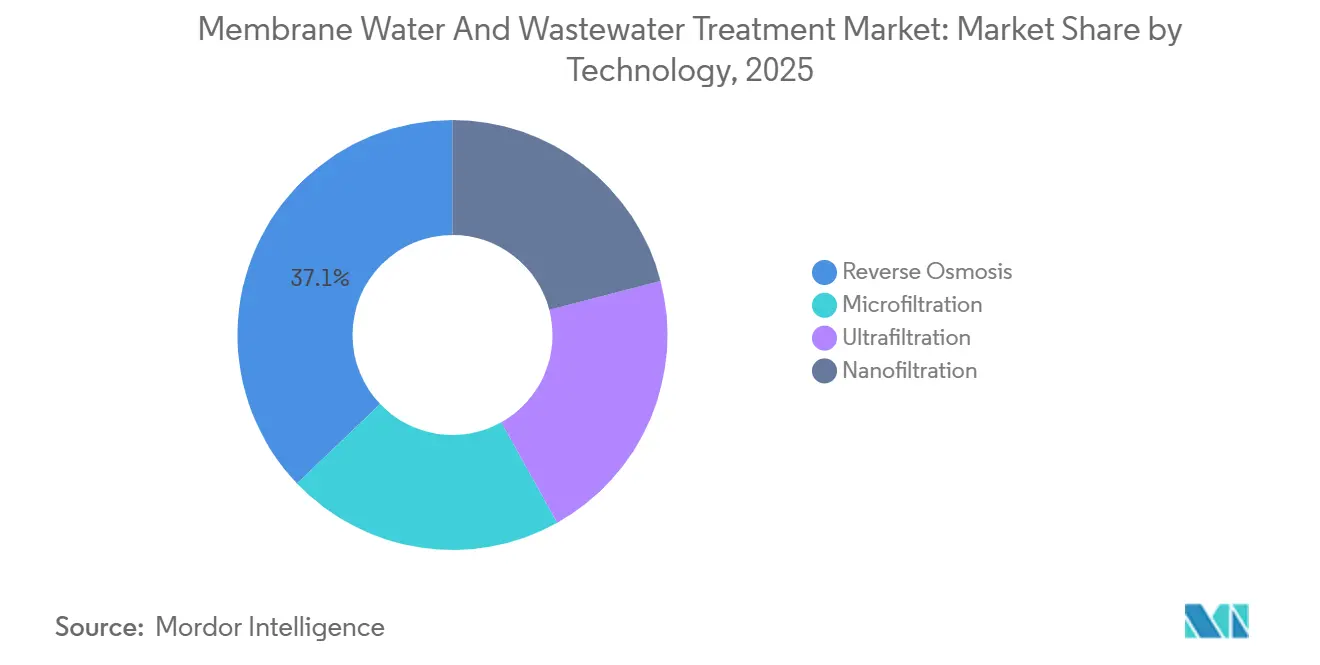
- By technology, reverse osmosis secured 37.14% of the membrane water and wastewater treatment market share in 2025 and is advancing at a 7.77% CAGR through 2031.
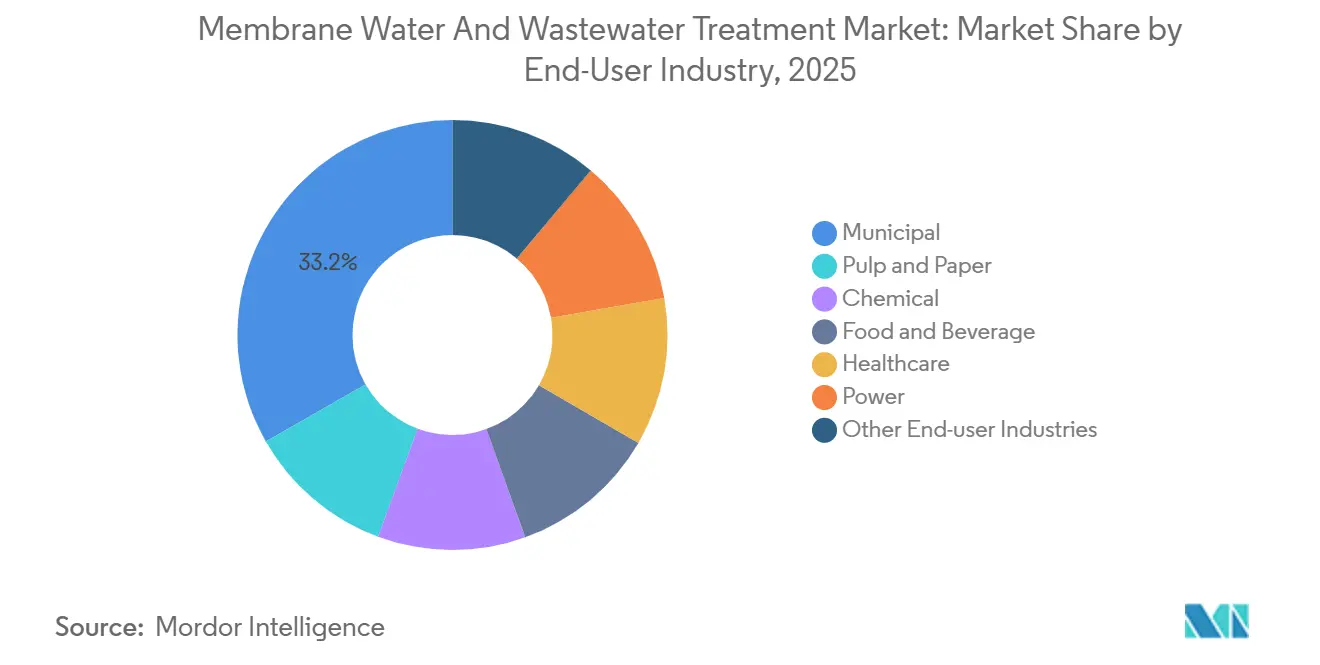
- By end-user industry, municipal utilities held 33.25% revenue share of the membrane water and wastewater treatment market size in 2025, whereas food and beverage applications are projected to expand at a 7.99% CAGR to 2031.
- By geography, Europe dominated with a 34.30% share in 2025; Asia-Pacific exhibits the fastest growth at a 7.90% CAGR through 2031.
Note: Market size and forecast figures in this report are generated using Mordor Intelligence’s proprietary estimation framework, updated with the latest available data and insights as of 2026.
Market Trends and Insights
Drivers Impact Analysis of Membrane Water And Wastewater Treatment Market*
| Drivers | (~) % Impact on CAGR Forecast | Geographic Relevance | Impact Timeline |
|---|---|---|---|
| Rapid adoption of low-pressure membrane systems | +1.8% | Global, with concentration in Asia-Pacific and Europe | Medium term (2-4 years) |
| Stricter discharge norms for micropollutants and PFAS | +2.1% | North America and Europe, emerging in Asia-Pacific | Long term (≥ 4 years) |
| AI-enabled predictive maintenance lowering OPEX | +1.2% | Global, early adoption in North America and Singapore | Short term (≤ 2 years) |
| Circular-economy demand for polymer-to-fuel membrane recycling | +0.6% | Japan, Europe, pilot stage in North America | Long term (≥ 4 years) |
| Desalination retrofits shifting to energy-efficient RO stacks | +1.5% | Middle East, Asia-Pacific coastal cities, Mediterranean | Medium term (2-4 years) |
| Source: Mordor Intelligence | |||
Rapid Adoption of Low-Pressure Membrane Systems
Low-pressure microfiltration and ultrafiltration are now preferred over sand filtration and dissolved air flotation. These methods achieve significant pathogen removal without the need for coagulant dosing. China's guidelines, set for December 2024, mandate ultrafiltration in all new surface-water plants for cities with large populations. This directive impacts numerous municipalities and millions of residents. A German facility showcased the longevity of ultrafiltration, operating continuously for many years without needing element replacements, equating its module life to that of traditional concrete clarifiers[1]MANN+HUMMEL, “Ultrafiltration Longevity Study,” mann-hummel.com. With modular skids, utilities can boost capacity in just a few months, a stark contrast to the longer timelines typically required for basin construction. The energy demand is significantly lower compared to reverse osmosis. This efficiency makes it an attractive option for decentralized schemes, especially in India and Southeast Asia. These advantages are propelling the membrane water and wastewater treatment market towards low-pressure platforms.
Stricter Discharge Norms for Micropollutants and PFAS
In March 2025, the U.S. EPA set a stringent limit for PFOA and PFOS, achievable solely through advanced methods like granular activated carbon combined with nanofiltration or anion-exchange-assisted reverse osmosis[2]U.S. Environmental Protection Agency, “PFAS National Primary Drinking Water Regulation,” epa.gov. Germany aims for an ambitious reduction in industrial micropollutant loads by 2030, as outlined in its draft ordinance. Meanwhile, Switzerland has mandated ozonation or powdered-activated-carbon ultrafiltration at its top plants by 2035. Such proactive policies not only highlight the growing emphasis on water treatment but also create a robust demand for high-rejection membranes, signaling a bullish outlook for the membrane water and wastewater treatment market.
AI-Enabled Predictive Maintenance Lowering OPEX
In 2024, Choa Chu Kang Waterworks in Singapore achieved a reduction in chemical consumption and extended replacement intervals by implementing machine-learning fouling predictions. A digital twin overseeing multiple installations boasts a decrease in unplanned downtime and a cut in the total ownership cost. These algorithms differentiate between reversible and irreversible fouling, enabling operators to fine-tune backwash and cleaning cycles. In North America, where round-the-clock labor coverage can surpass high annual costs, mounting labor cost pressures are driving faster adoption of these technologies.
Circular-Economy Demand for Polymer-to-Fuel Recycling
Toray's Shiga pilot successfully converts spent polyamide membranes into synthetic crude. With a target throughput, the company aims to break even. Highlighting the growing importance of polyamide membranes, the EU's 2024 Circular Economy Action Plan designates them as a priority waste stream. This move, emphasizing extended producer responsibility, could mandate take-back programs by 2028. Furthermore, utilities and processors adopting closed-loop practices are reaping ESG credits, bolstering demand in the membrane water and wastewater treatment market.
Restraints Impact Analysis of Membrane Water And Wastewater Treatment Market*
| Restraints | (~) % Impact on CAGR Forecast | Geographic Relevance | Impact Timeline |
|---|---|---|---|
| Persistent membrane fouling and chemical cleaning cost | -1.3% | Global, acute in industrial wastewater applications | Short term (≤ 2 years) |
| Capital-intensive ceramic membrane manufacturing | -0.7% | Global, constrains adoption in high-temperature applications | Medium term (2-4 years) |
| Skilled-operator shortage for advanced membrane plants | -0.9% | Asia-Pacific, Middle East, emerging in Africa | Long term (≥ 4 years) |
| Source: Mordor Intelligence | |||
Persistent Membrane Fouling and Chemical Cleaning Cost
Within weeks, fouling boosts transmembrane pressure, necessitating chemical cleans regularly. Chemical usage inflates operating costs and repeated exposure reduces the lifespan of polymeric membranes to just 4–5 years, especially in demanding pulp-and-paper or chemical environments. Meanwhile, pretreatments like coagulation, ozonation, or media filtration diminish these gains, tightening profit margins for those in the membrane water and wastewater treatment sector.
Capital-Intensive Ceramic Membrane Manufacturing
With sintering furnaces being expensive, ceramic element prices are significantly higher than their polymeric counterparts. Ceramics only reach a break-even point if cleaning intervals are reduced to less than 15 days or if feed temperatures exceed 60 °C. The limited supplier base, comprising TAMI, Pall, and Veolia, fosters an oligopolistic pricing structure, hindering wider adoption.
*Our forecasts treat driver/restraint impacts as directional, not additive. The impact forecasts reflect baseline growth, mix effects, and variable interactions.
Membrane Water And Wastewater Treatment Market Segment Analysis
By Technology:
RO Dominance Anchored in Desalination and ReuseIn 2025, reverse osmosis accounted for a 37.14% portion of the membrane water and wastewater treatment market share, buoyed by major projects like the UAE's Taweelah plant, boasting a substantial capacity. The market size for reverse osmosis in membrane water and wastewater treatment is projected to grow at a 7.77% CAGR, thanks in part to energy-recovery devices that optimize energy consumption. Ultrafiltration stands out as the primary standalone barrier for municipal drinking water and frequently acts as a pretreatment for RO, particularly in initiatives under China's 14th Five-Year Plan. Microfiltration is foundational to most membrane bioreactor setups, producing irrigation-ready effluent without the need for tertiary polishing. While nanofiltration carves out a niche in removing divalent ions and mitigating PFAS, it's often paired in hybrid configurations with anion-exchange units. Companies like Veolia and Xylem, with their standardized skid-mounted solutions, are slashing project lead times and minimizing engineering risks for developers in the membrane water and wastewater treatment arena.
As technology converges, there's a trend towards package offerings—pairing ultrafiltration with either nanofiltration or reverse osmosis—to strike a balance between capital expenditure and energy consumption, all while meeting escalating effluent quality standards. Innovations in membrane chemistry, such as DuPont's patent on graphene-oxide-enhanced thin-film composites, boost permeability significantly without compromising rejection rates. These high-permeability elements now function at lower pressure ranges, leading to significant capital expenditure reductions on high-pressure pumps. As a result, the choice of technology is increasingly driven by lifecycle economics rather than just initial costs, nudging utilities towards integrated membrane trains to ensure future compliance.


By End-User Industry:
Municipal Scale Meets Food and Beverage GrowthMunicipal utilities accounted for 33.25% of 2025 revenue, reflecting mandatory upgrades under Europe’s quaternary-treatment rules and California’s potable-reuse guidelines. While growth is expected to moderate, the municipal allocation in the membrane water and wastewater treatment market is set to remain the dominant revenue source through 2031. In contrast, food and beverage processors are forecast to post a 7.99% CAGR. This surge is largely attributed to dairies transitioning from traditional thermal pasteurization to cold microfiltration, a method that not only preserves flavor compounds but also extends the product's shelf life. Notably, recent initiatives across European dairies achieved a remarkable reduction in energy consumption and extended product life. Breweries are now turning to cross-flow microfiltration, allowing them to stabilize beer without the need for pasteurization. Similarly, juice producers are adopting nanofiltration techniques to concentrate flavors while maintaining low temperatures.
In the chemical sector, ultrafiltration and nanofiltration are being harnessed to recover catalysts, leading to significant savings on raw materials. A testament to this is the implementation of retrofits at major production sites, which have resulted in substantial annual savings. Pulp and paper mills are utilizing ultrafiltration to recycle white water, achieving a notable reduction in freshwater intake. Meanwhile, the healthcare sector is employing these technologies for validated pathogen barriers, and the power sector is using ultrapure boiler-feed pretreatment. Additionally, sectors like electronics, mining, and oil and gas are contributing to the demand, further expanding the membrane water and wastewater treatment market's reach.
Geography Analysis
Europe Membrane Water And Wastewater Treatment Market
Europe dominated the membrane water and wastewater treatment market with 34.30% revenue in 2025. This dominance is largely attributed to the Urban Wastewater Treatment Directive recast, mandating a significant removal of micropollutants by 2045 for plants catering to populations over 10,000. Germany, boasting the world's highest density, operates numerous membrane bioreactors. Meanwhile, France and the Netherlands are swiftly rolling out quaternary treatments. With capital investments projected for 2026-2031, a steady demand for equipment is assured.
APAC Membrane Water And Wastewater Treatment Market
Asia-Pacific is forecast to be the fastest-growing regional cluster at a 7.90% CAGR, propelled by China, India, and Southeast Asia. China's ambitious 14th Five-Year Plan allocates significant resources to urban water infrastructure, earmarking a large portion of projects for membrane bioreactors. This move significantly bolsters the market size for membrane water and wastewater treatment. In India, the Jal Jeevan Mission implements ultrafiltration in numerous villages grappling with arsenic and fluoride issues. Meanwhile, Korea and Japan are modernizing their aging desalination plants with low-pressure RO stacks, and Australia is ramping up potable reuse initiatives to counter drought challenges. Notably, Perth's Groundwater Replenishment Scheme is set to process an impressive volume annually through UF-RO trains.
The Americas and MEA Membrane Water And Wastewater Treatment Market
North America is intensifying its investments to align with the EPA’s proposed cap for PFAS. In California, a 2024 mandate for multi-barrier reuse encompasses numerous projects, collectively handling significant volumes. Canada is upgrading its clarifiers to ultrafiltration-reverse osmosis systems to effectively eliminate contaminants like Cryptosporidium and Giardia. Additionally, Mexico is channeling investments into border-city reuse projects, facilitated by the North American Development Bank. In South America, both Chile and Brazil are desalinating seawater to support their copper and lithium industries. Notably, BHP and Antofagasta have commissioned a combined reverse osmosis capacity set to come online between 2024 and 2026. Meanwhile, the Middle East and Africa continue to assert their dominance in desalination, with new capacity under construction. This expansion, primarily driven by energy-recovery-equipped reverse osmosis, further amplifies the growth of the membrane water and wastewater treatment market.
Mordor Intelligence provides coverage of the membrane water and wastewater treatment market across other key regional markets, including South America, each with their regulatory frameworks and demand patterns.

Value Chain Analysis
The value chain begins with upstream feedstocks and components, including engineering polymers (for example, PSU/PESU/PPSU resins used in housings and module components) and specialty chemicals for membrane casting and fabrication. Midstream membrane-element producers, including DuPont, Toray, and LG Chem, typically capture outsized value due to performance qualification, warranty expectations, and utility approval cycles that drive high switching costs and long qualification timelines, especially for municipal-scale installations.
Downstream, EPCs and system integrators package membranes into trains such as UF-RO and MBR systems, then handle commissioning and provide O&M, spares, and cleaning services over multi-year cycles. Specification demand flows from utilities and industrial end users to integrators and membrane OEMs, and regulatory drivers, including tighter PFAS limits in the United States and micropollutant removal requirements in Europe, are accelerating retrofit work. That shift is also raising the role of application engineering, piloting, and digital monitoring tools that help reduce fouling-related OPEX.
Competitive Landscape
The membrane water and wastewater treatment market is moderately consolidated. Chinese producers scale aggressively, chipping at incumbents’ shares. White-space opportunities persist in ceramic ultrafiltration for high-temperature streams and hybrid anion-exchange–nanofiltration for PFAS below 4 ng/L. Strategic moves include vertical integration, with equipment vendors buying membrane shops to secure supply, and regional expansion into Asia-Pacific and Middle East markets, where installed capacity doubles every three to four years, reinforcing competitive intensity across the membrane water and wastewater treatment market.
Membrane Water And Wastewater Treatment Industry Leaders
Veolia
DuPont
TORAY INDUSTRIES, INC.
Hydranautics (A Nitto Group Company)
LG Chem
- *Disclaimer: Major Players sorted in no particular order
Membrane Water And Wastewater Treatment Market Companies Covered in this Report
- ALFA LAVAL
- Aquatech
- Asahi Kasei Corporation
- AXEON Water
- DuPont
- Hydranautics (A Nitto Group Company)
- Kovalus Separation Solutions
- LG Chem
- MANN+HUMMEL Water & Fluid Solutions GmbH
- NX Filtration BV
- Pall Corporation
- Pentair
- TORAY INDUSTRIES, INC.
- Toyobo Co., Ltd.
- Veolia
- Vontron Technology Co., Ltd.
- Xylem
Read Analysis of Membrane Water And Wastewater Treatment Companies

Market Opportunities and Future Outlook
Regulation-driven upgrades and reuse programs are creating whitespace for packaged, upgrade-friendly membrane trains, particularly where utilities need quaternary treatment for micropollutants. In the European Union, the recast Urban Wastewater Treatment Directive (Directive (EU) 2024/3019) entered into force on January 1, 2025, with member states required to transpose by July 31, 2027. This timeline shifts project pipelines toward advanced tertiary and quaternary treatment and increases pull-through for MBR, UF, NF, and hybrid trains as utilities move from pilots to more standardized designs.
Large municipal programs also support opportunities for suppliers that can combine hardware, process design, and operating optimization. In March 2026, Tampa Bay Water broke ground on a USD 181 million expansion of its regional surface water treatment plant, a multi-year capital project that reinforces demand for scalable membrane pretreatment, retrofit integration, and long-term service support. On the innovation front, NAWI has prioritized R&D themes including autonomous operations, precision separations, intensified brine management, and modular membrane systems, aligning supplier roadmaps toward digitalized operations and brine and resource recovery capabilities that address both PFAS compliance and industrial ZLD/MLD needs.
Recent Industry Developments in Membrane Water And Wastewater Treatment Market
- July 2026: DuPont launched an upgraded Water Application Value Engine (WAVE PRO) that models multi-technology treatment trains across ultrafiltration, ion exchange, reverse osmosis, and nanofiltration in a single workflow. This supports faster front-end engineering for complex reuse and industrial water projects and reinforces the trend toward integrated process design rather than single-membrane selection.
- September 2025: Veolia signed an agreement with SATORP for a major industrial water recycling project in Jubail Industrial City, Saudi Arabia, structured around a USD 500 million plant and a 30-year O&M contract. The scale and duration of the deal strengthen the role of membrane-based reuse in heavy industry and expand long-term service and consumables revenue attached to installed assets.
- May 2024: Veolia was awarded a USD 320 million contract to supply water technology for the Hassyan seawater desalination plant in the United Arab Emirates, centered on reverse osmosis and energy-efficiency performance targets. The award highlights continued investment in large SWRO capacity and places more emphasis on RO stack efficiency, system integration, and lifecycle operating cost.


Membrane Water And Wastewater Treatment Market Report Scope and Research Methodology
Market Definition and Coverage
For this methodology, the market covers revenues generated from membrane-based treatment solutions used to purify water and treat wastewater across municipal and industrial facilities, where separation is achieved through pressure-driven membranes used in core treatment steps.
Scope exclusions: We do not count conventional non-membrane treatment equipment, commodity chemicals, or general civil construction value that is not specific to membrane treatment systems.
Segments Covered in This Report
- By Technology
- Microfiltration
- Ultrafiltration
- Nanofiltration
- Reverse Osmosis
- By End-User Industry
- Municipal
- Pulp and Paper
- Chemical
- Food and Beverage
- Healthcare
- Power
- Other End-user Industries
- By Geography
- Asia-Pacific
- China
- India
- Japan
- South Korea
- Rest of Asia-Pacific
- North America
- United States
- Canada
- Mexico
- Europe
- Germany
- United Kingdom
- France
- Italy
- Russia
- Rest of Europe
- South America
- Brazil
- Argentina
- Rest of South America
- Middle-East and Africa
- Saudi Arabia
- South Africa
- Rest of Middle-East and Africa
- Asia-Pacific
Data Sources, Market Sizing, and Validation
Desk Research
Desk research was used to set the basic market map and to collect reference data points that are stable and publicly checkable. We leaned on sources such as the US EPA, Eurostat, the UN Water and WHO/UNICEF JMP databases for water and sanitation indicators, and World Bank datasets for municipal infrastructure spend signals. For trade and installed base direction, customs statistics and tariff-line trade releases were used as supporting checks where membrane modules and related equipment are visible.
To keep assumptions realistic, we also reviewed company annual reports, 10-K style filings, investor presentations, project announcements, and association publications on desalination and water reuse. In selective cases, paid subscriptions for company financials and patent databases were used to reduce missed players and to understand technology intensity, then the results were cross-checked back to public sources. The sources listed here are illustrative only, and many other public documents and datasets were also referred to for data collection, validation, and clarification.
Primary Interviews and Surveys
Primary work focused on interviews and short surveys with membrane suppliers, system integrators, EPC-linked experts, utilities, and industrial plant teams that procure or operate treatment assets. Since this is a global market, we covered demand and pricing realities across APAC, EMEA, and the Americas so regional adoption differences (reuse rules, salinity challenges, and retrofit cycles) could be reflected. These discussions helped clarify what buyers actually purchase, how projects are packaged at tender level, and which variables most often shift budgets from one year to the next.
Distribution of primary research fieldwork respondents
| Company type | Respondent position | Region |
|---|---|---|
| Top tier: 34% | CXOs: 15% | APAC: 51% |
| Mid tier: 51% | Functional/Unit leaders: 33% | EMEA: 29% |
| Smaller Players: 15% | Managers: 52% | Americas: 20% |
Market-Sizing & Forecasting
The sizing model starts with a top-down build that reconstructs the addressable demand pool from water and wastewater treatment capacity, technology penetration of membrane steps, and typical spend per installed or upgraded unit, and then these totals are reconciled with selective bottom-up checks. Those checks include sampled price per square meter for membrane modules, replacement and retrofit timing, and a light roll-up of visible supplier and integrator revenues in membrane-related lines, which helps adjust for under-coverage in countries with limited public reporting.
Key inputs used (illustrative) include municipal wastewater reuse targets, desalination additions and retrofits where RO is core, industrial wastewater tightening in sectors with high load (such as chemicals and power), and inflation-linked movement in membrane module pricing and system CAPEX. For forecasting, scenario analysis was used so adoption can flex with capex cycles, permitting timelines, and regulation enforcement strength, and then the selected path was aligned to what primary experts described as the most likely project pipeline behavior. When bottom-up signals were incomplete, gaps were handled through proxy indicators like treatment capacity additions and replacement rates, followed by re-checks on implied revenues per unit.
Data Validation & Update Cycle
We validate estimates through triangulation across three layers: demand indicators, supply-side revenue visibility, and price and volume sanity checks. If a country or end-use result looks out of pattern, we re-test it against independent signals like capacity additions, announced project awards, and trade movement, then review again before sign-off.
Reports are refreshed annually, with interim updates when material events occur such as regulation shifts, major project delays, or sharp raw material and energy-driven price moves. Before delivery, an analyst performs a fresh pass on the core inputs and the current-year estimate so clients receive an updated view that matches the latest available signals.
Mordor Intelligence's Membrane Water and Wastewater Treatment Wwt Market Size Versus Other Published Estimates
Published market sizes for membrane water and wastewater treatment often do not match, even when the same membrane types are named. Differences usually come from what is counted as the market, which year is treated as the anchor, and how pricing and replacement cycles are modeled in the forecast.
Some external figures expand the scope into adjacent water treatment membranes used outside full treatment systems or into broader water infrastructure spend, which lifts the headline value. The split is clearer when the count is limited to MF, UF, NF, and RO used in membrane water and wastewater treatment systems and then tied back to adoption rates, project packaging, and validated price points, which is how Mordor Intelligence keeps the 2026 total traceable to real procurement patterns.
Benchmark comparison
| Source | Market Size | Gaps in Research Methodology |
|---|---|---|
| Mordor Intelligence | USD 6.91 B (2026) | |
| Global Consultancy A | USD 10.86 B (2023) | Uses an earlier base year and may capture a wider revenue pool across membranes for water and wastewater, which can mix module sales and broader application uses without a consistent project-system filter. |
| Industry Publisher B | USD 8.27 B (2025) | Focuses on wastewater treatment with membranes and applies a different year and growth path, which can shift totals when water treatment and desalination-linked membrane demand are not fully aligned in scope. |
Across the three figures, the spread mainly reflects scope boundaries and year selection, and then how replacement timing and pricing are carried forward in the model. By keeping the inputs tied to adoption, project packaging, and price checks that can be re-tested, the estimate stays usable for planning and for comparing regions on a like-for-like basis.


Key Questions Answered in the Report
What is the forecast value of the membrane water and wastewater treatment market by 2031?
It is expected to reach USD 9.80 billion by 2031, advancing at a 7.24% CAGR from USD 6.91 billion in 2026.
Which technology currently dominates global shipments?
Reverse osmosis leads, holding 37.14% of 2025 revenue and growing through large desalination retrofits.
Why is Asia-Pacific forecast to be the fastest-growing region?
Government spending in China, India, and Southeast Asia on membrane bioreactors and desalination drives a 7.90% CAGR to 2031.
Which end-user segment is expanding the quickest?
Food and beverage processors are projected to post a 7.99% CAGR as dairies and breweries adopt cold microfiltration.
Page last updated on:


