
Membrane Separation Technology Market Size and Share
Market Overview
| Study Period | 2020 - 2031 |
|---|---|
| Market Size (2026) | USD 27.53 Billion |
| Market Size (2031) | USD 33.82 Billion |
| Growth Rate (2026 - 2031) | 4.21 % |
| Fastest Growing Market | North America |
| Largest Market | Asia Pacific |
| Market Concentration | Medium |
Major Players *Disclaimer: Major Players sorted in no particular order Image © Mordor Intelligence. Reuse requires attribution under CC BY 4.0. | |
Membrane Separation Technology Market Analysis by Mordor Intelligence
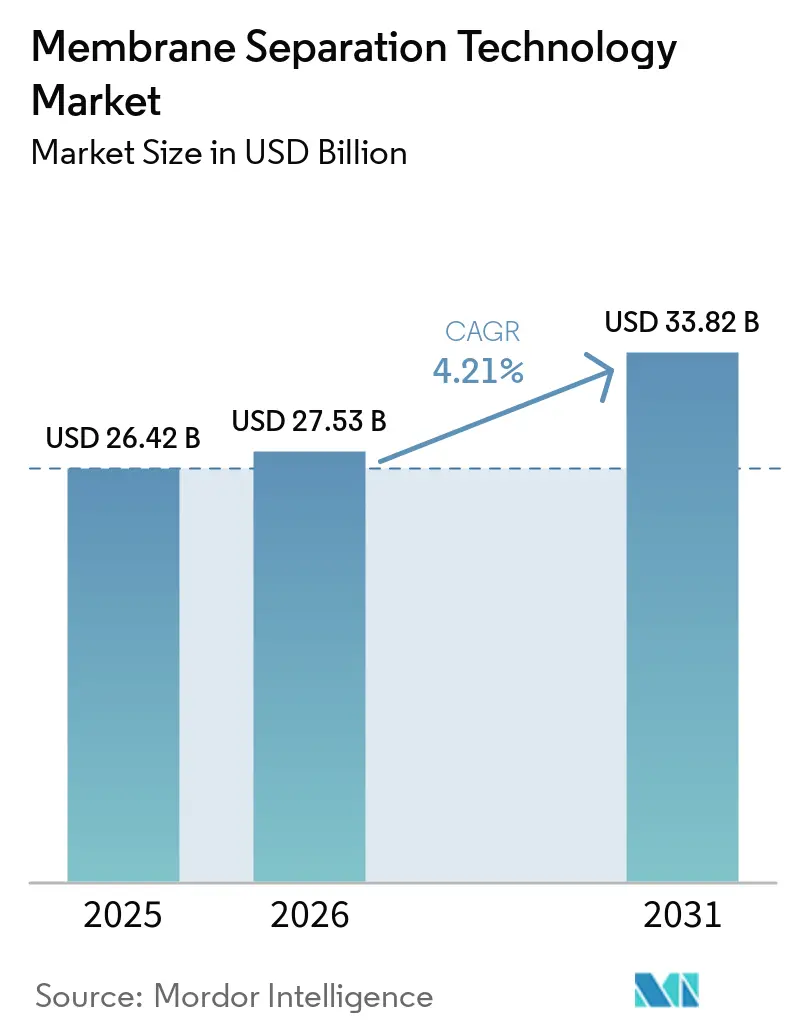
The Membrane Separation Technology Market size market is expected to grow from USD 26.42 billion in 2025 to USD 27.53 billion in 2026 and is forecast to reach USD 33.82 billion by 2031 at 4.21% CAGR over 2026-2031. Robust demand for high-quality water, tougher discharge rules, and rapid progress in membrane chemistry anchor this expansion. Reverse osmosis holds sway because large-scale desalination projects still prize its high salt rejection, yet forward-osmosis pilots and smarter hybrid systems are narrowing the efficiency gap. Polymeric membranes remain the workhorse thanks to cost advantages, but composite-hybrid designs loaded with graphene oxide or metal-organic frameworks are capturing attention for their higher selectivity and better fouling resistance. Hollow fiber modules dominate installations because their self-supporting geometry packs more surface area per vessel, trims installation weight, and cuts long-run maintenance needs. Regionally, Asia-Pacific’s industrial surge keeps it in the lead, while North America’s fresh PFAS rules lift demand for nanofiltration and next-generation reverse-osmosis lines.
Key Report Takeaways
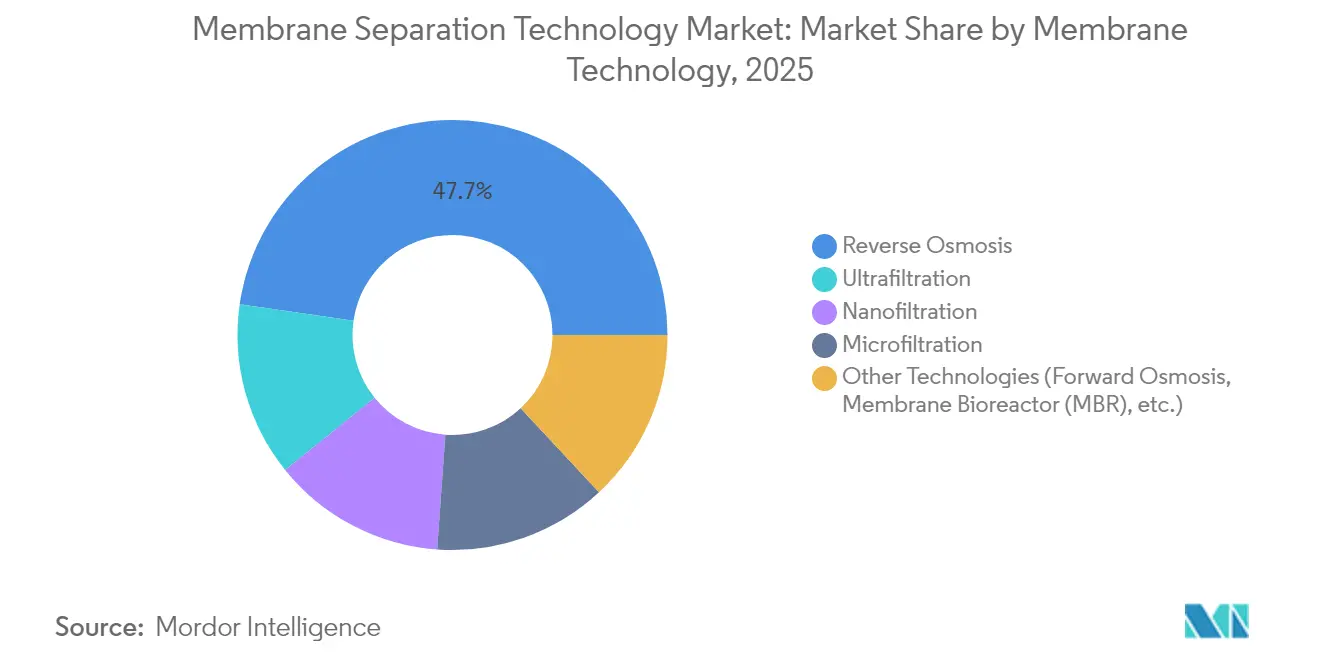
- By membrane technology, reverse osmosis commanded 47.73% of membrane separation technology market share in 2025, whereas forward-osmosis and membrane bioreactor systems are projected to log the quickest 4.92% CAGR through 2031.
- By membrane material, polymeric grades captured 64.52% of the membrane separation technology market size in 2025; composite-hybrid variants are on track for a 5.11% CAGR over the forecast window.
- By module configuration, hollow fiber accounted for 52.66% of the membrane separation technology market size and is forecast to expand at a 4.96% CAGR between 2026-2031.
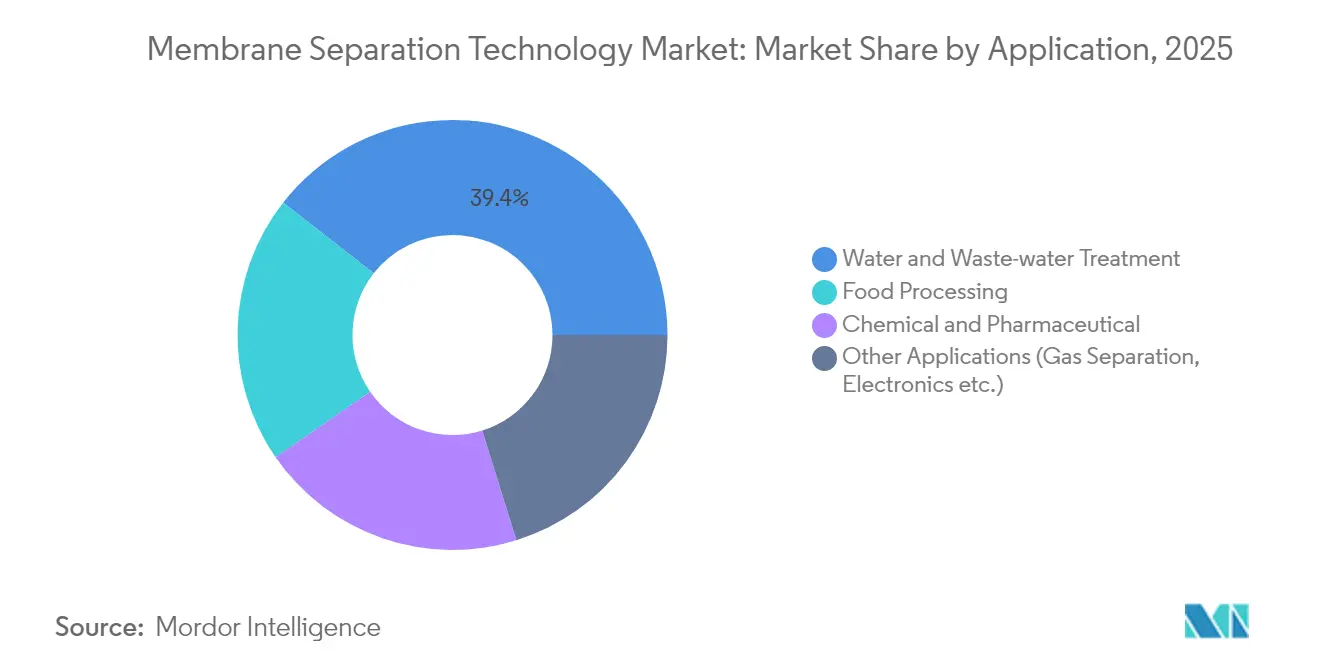
- By application, water and wastewater treatment led with 39.42% of revenue in 2025, while chemical and pharmaceutical processing is set to grow at a 5.09% CAGR to 2031.
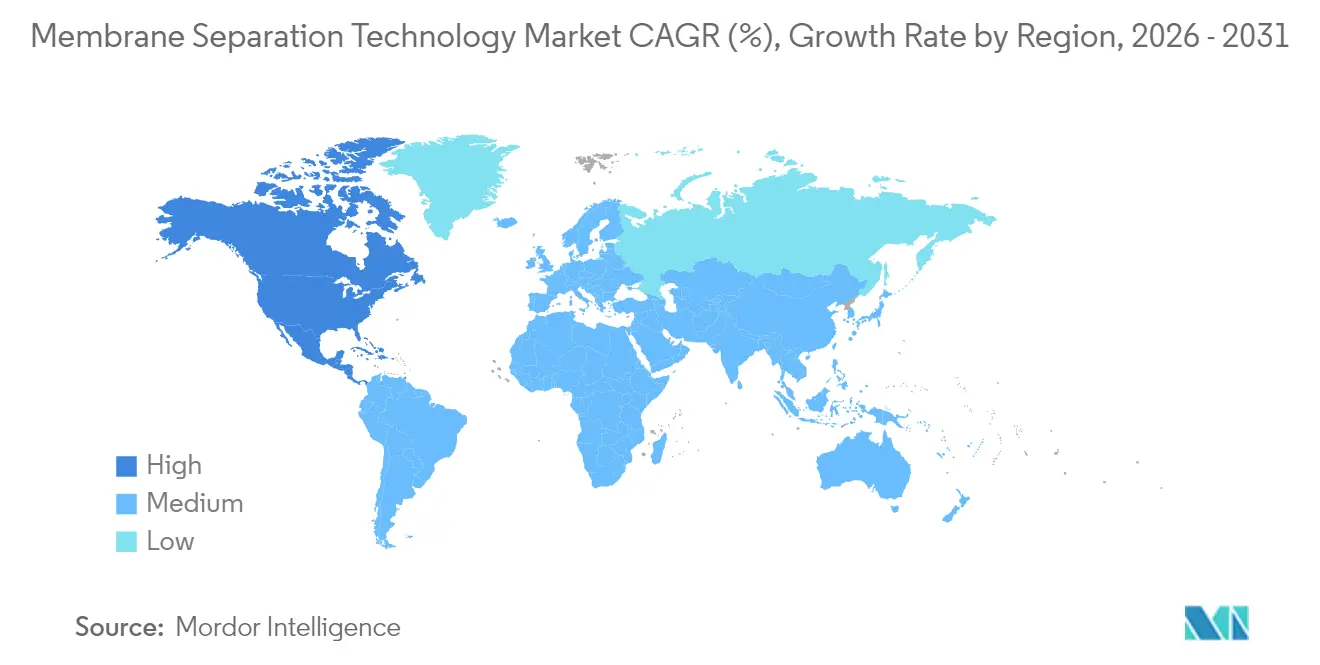
- By geography, Asia-Pacific held 40.83% of revenue in 2025, while North America is the fastest-growing region at a 4.86% CAGR through 2031.
Note: Market size and forecast figures in this report are generated using Mordor Intelligence’s proprietary estimation framework, updated with the latest available data and insights as of 2026.
Market Trends and Insights
Drivers Impact Analysis of Membrane Separation Technology Market*
| Driver | (~) % Impact on CAGR Forecast | Geographic Relevance | Impact Timeline |
|---|---|---|---|
| Rising Demand for Water and Waste-Water Treatment | +1.2% | Global, with highest impact in Asia-Pacific and Middle East | Long term (≥ 4 years) |
| Growth in Food, Beverage and Pharma Processing | +0.8% | North America and EU, expanding to Asia-Pacific | Medium term (2-4 years) |
| Stricter Industrial Effluent Regulations | +0.7% | Global, led by EU and North America | Short term (≤ 2 years) |
| Adoption of Forward-Osmosis and Electrically Responsive Membranes | +0.5% | North America and EU, pilot deployments in Asia-Pacific | Long term (≥ 4 years) |
| Low-Alcohol Beverage Processing Demand | +0.3% | Global, concentrated in developed markets | Medium term (2-4 years) |
| Source: Mordor Intelligence | |||
Rising Demand for Water and Waste-Water Treatment
Water scarcity affects 2 billion people globally, creating unprecedented demand for membrane-based purification technologies that can process contaminated water sources previously deemed unusable. Municipal water treatment facilities are increasingly adopting membrane bioreactor systems, with China alone implementing over 300 MBR plants achieving nearly 100% annual growth compared to the global rate of 10.9%. The technology's ability to produce high-quality effluent suitable for direct reuse is driving adoption in water-stressed regions, where traditional treatment methods prove inadequate for meeting stringent discharge standards. Advanced membrane configurations are enabling utilities to extract potable water from sources with high salinity and organic contamination levels. The shift toward decentralized water treatment systems is creating new market segments, particularly in industrial zones where on-site treatment reduces transportation costs and regulatory compliance risks.
Growth In Food, Beverage and Pharma Processing
Dairy groups now rely on cross-flow microfiltration to concentrate whey proteins without heat damage, extending product lines into high-margin nutritional isolates DAIRYNETWORK.COM. Pharmaceutical plants are shifting from distillation to ultrafiltration for water-for-injection; Asahi Kasei’s latest skid removes 99.999% endotoxins while trimming energy draw by 30%[1]Asahi Kasei Corporation, “UF-UF Systems for Pharmaceutical Water,” asahikasei.com . The surge in low-alcohol beverages further strengthens demand because hollow fiber nanofiltration strips ethanol while preserving delicate aroma compounds better than vacuum evaporation. Membrane steps also isolate bioactive ingredients for functional foods at ambient temperatures, protecting heat-sensitive nutraceuticals and lowering operating costs.
Stricter Industrial Effluent Regulations
The EU Industrial Emissions Directive compels chemical plants to adopt Best Available Techniques, propelling uptake of ceramic nanofiltration lines that withstand high temperatures and harsh solvents EUR-LEX.EUROPA.EU. North American refineries mirror this trend as the US Environmental Protection Agency tightens heavy-metal limits in discharge permits. Modular membrane skids allow staged expansions when rules get tougher, sidestepping costly civil works. Coupled with real-time conductivity monitoring, membranes help factories recycle 40%-60% of process water, tempering fresh-water withdrawals and complying with ESG mandates.
Adoption of Forward-Osmosis and Electrically Responsive Membranes
Forward-osmosis plants now exploit recyclable draw solutions, slicing specific energy use by 30% relative to classic reverse osmosis in high-brine streams. Laboratory prototypes of electrically gated nanochannels shift permeability with a one-volt cue, replicating 15 bar of hydraulic pressure and enabling on-the-fly tuning. AI-coupled membrane bioreactors forecast fouling and schedule clean-in-place cycles automatically, extending membrane life by 25% and cutting chemical use. These breakthroughs open fresh opportunities in difficult niches such as produced-water treatment and selective resource recovery.
Restraints Impact Analysis of Membrane Separation Technology Market*
| Restraint | (~) % Impact on CAGR Forecast | Geographic Relevance | Impact Timeline |
|---|---|---|---|
| High Capital and Operating Costs | -0.9% | Global, most pronounced in developing markets | Medium term (2-4 years) |
| Membrane Fouling and Maintenance Complexity | -0.6% | Global, particularly in industrial applications | Short term (≤ 2 years) |
| Impending PFAS Restrictions on Membrane Components | -0.4% | EU and North America, expanding globally | Long term (≥ 4 years) |
| Source: Mordor Intelligence | |||
High Capital and Operating Costs
Ceramic membranes outlast polymeric rivals but require pricier alumina or zirconia substrates, elevating installed costs by up to 50% in low-income regions. Where power rates exceed USD 0.12 /kWh, energy line items can raise life-cycle ownership by 20-30% over conventional clarification. Investors demand clear visibility on payback, lengthening procurement cycles for public utilities that already face budget constraints. Financing hurdles spur innovative leasing models and outcome-based contracts that shift capital risk to suppliers, yet adoption remains slow in markets with limited credit access.
Membrane Fouling and Maintenance Complexity
Biofouling slashes flux in food and beverage applications rich in proteins and polysaccharides. Graphene-oxide surface coatings delay colonization but add manufacturing steps and cost premiums of 10-12%. Industrial users often lack trained technicians to diagnose early fouling, leading to daily cleans that boost chemical use and downtime. Predictive analytics platforms tied to trans-membrane pressure sensors are starting to fill this gap, but widespread deployment hinges on stronger digital skills at plant level.
*Our forecasts treat driver/restraint impacts as directional, not additive. The impact forecasts reflect baseline growth, mix effects, and variable interactions.
Membrane Separation Technology Market Segment Analysis
By Membrane Technology:
Reverse Osmosis Holds a Comfortable Lead but Alternatives AccelerateReverse osmosis contributed 47.73% to the membrane separation technology market in 2025 on the back of seawater desalination megaprojects and industrial reuse schemes. Utilities pick RO for its near-universal chemistry barrier and mature supply base that cushions capital costs. Forward-osmosis together with membrane bioreactors is now the fastest-expanding cluster at a 4.92% CAGR, showing that operators want lower energy profiles for high-TDS feeds. Ultrafiltration and nanofiltration continue to carve space by handling specific solute ranges and acting as robust pretreatment steps that safeguard downstream RO arrays.
Hybrid trains that weld microfiltration, nanofiltration, and advanced oxidation in one compact skid are entering pilot stages across Europe. This modular architecture shortens commissioning by 25% and achieves target effluent quality without bespoke civil works. The membrane separation technology industry therefore sees integrators compete on smart process controls and interoperable element designs rather than on polymer recipes alone.



By Membrane Material:
Polymeric Grades Remain Mainstay but Composite-Hybrid Builds MomentumPolymeric membranes accounted for 64.52% of the membrane separation technology market size in 2025 owing to scalable extrusion lines and well-studied chemistries. Polyethersulfone and polyvinylidene fluoride dominate potable-water deployments where mechanical resilience and chlorine tolerance are prized. However, looming PFAS phase-outs are nudging suppliers to tweak formulations and test fluorine-free alternatives.
Composite-hybrid membranes will clock a 5.11% CAGR through 2031 by embedding graphene oxide, zeolites, or metal-organic frameworks inside polymer backbones that raise selectivity without hurting permeability for gas separation membrane applications. Pilot ceramic-supported composites already outperform legacy polymers in hot acid streams, granting them footholds in petrochemical and mining sectors. The resultant material diversification lowers reliance on any single chemical feedstock and mitigates regulatory risks that could otherwise slow the membrane separation technology market.
By Module Configuration:
Hollow Fiber Clinches Both Volume and VelocityHollow fiber retained 52.66% of shipments in 2025 and is forecast to rise at a 4.96% CAGR to 2031, making it the unrivaled champion in surface-area efficiency. In lifescience membrane technology, capsule and cartridge formats serve pilot plants, while hollow-fiber modules are used in commercial biologics lines. Plants favor the geometry because it self-supports, dispenses with spacers, and delivers higher packing densities that trim footprint by up to 20%. Gas-tight hollow fiber bundles now target hydrogen recovery and CO₂ removal, broadening revenue prospects.
Spiral-wound elements keep their hold in reverse-osmosis trains due to standardized dimensions and well-priced housings. Plate-and-frame stacks address niche hygienic duties where full-face clean-in-place access is mandatory. Tubular modules, though niche, endure in pulp and paper mills that endure heavy solids loading. Advances in automated potting and fiber integrity-testing assure plant managers of trouble-free runs, reinforcing hollow fiber’s broadening acceptance.
By Application:
Water Treatment Still Dominates While Pharma Races AheadWater and wastewater treatment represented 39.42% of 2025 revenue and remains central to the membrane separation technology market. Municipal plants champion hollow fiber ultrafiltration as a polishing step before disinfection, enabling potable reuse programs that offset groundwater stress. Industrial clusters add closed-loop rinse water circuits equipped with nanofiltration to slash intake fees and meet zero-liquid-discharge mandates.
Chemical and pharmaceutical lines, though smaller, will post a 5.09% CAGR to 2031—the steepest among end uses. Biologics firms install single-use tangential-flow filters to speed batch changeovers while keeping sterility risk low. Beverage groups broaden the reach of dealcoholized beer and wine, a segment that pivotally leans on spiral-wound nanofiltration cassettes to preserve volatile aromas. These trends cement membranes as essential enablers of product innovation and green manufacturing agendas.
Geography Analysis
APAC Membrane Separation Technology Market
Asia-Pacific generated 40.83% of global sales in 2025, underpinned by double-digit industrial growth across China, India, and Vietnam. China rolled out more than 300 membrane bioreactor projects last year, showcasing readiness to leapfrog directly to advanced treatment technologies without legacy aeration lagoons CHINA-WATER.ORG. Regional electronics clusters add wafer-grade ultrapure water capacity every quarter, giving polymeric ultrafiltration and reverse-osmosis skid suppliers a dependable sales funnel. Government subsidies for rural potabilization further widen the addressable base.
North America Membrane Separation Technology Market
North America is on track for the swiftest 4.86% CAGR to 2031 because tightened PFAS caps in drinking water spur urgent retrofit orders. Several US municipalities have issued design-build contracts for nanofiltration lines guaranteed to strip 99% of long-chain PFAS, lifting demand for low-pressure high-selectivity membranes EPA.GOV. Canada’s mining friends are next: revised effluent limits for selenium and nitrate mean membrane concentrators are replacing multi-step chemical treatments.
EMEA Membrane Separation Technology Market
Europe constitutes a mature yet innovative arena where strict industrial emission ceilings nourish continuous upgrades. Germany and the Netherlands refine ceramic nanofiltration for hard-to-treat leachate and refinery waste, adding use cases that slowly migrate to neighboring markets. Meanwhile, the Middle East accelerates large-scale seawater desalination, typically pairing energy-recovery devices with advanced thin-film composite membranes. African utilities trail but receive concessional finance for containerized treatment units that bypass piped infrastructure deficits, planting seeds for long-run growth.

Regulatory Landscape
Membrane separation technology demand is increasingly tied to tightening drinking-water and discharge compliance regimes, particularly for micropollutants. In the United States, US EPA actions around PFAS in drinking water, including a proposed compliance extension rule in May 2026, keep nanofiltration and reverse osmosis central to municipal retrofit plans. US EPA Region 8 also issued a final NPDES fact sheet in April 2026 for a general permit covering wastewater discharges associated with domestic water production, and it explicitly frames membrane filtration as a regulated treatment category.
In Europe, water reuse governance continues to formalize validation and risk-management requirements for reclaimed-water projects. Commission Delegated Regulation (EU) 2024/1261 specifies technical requirements tied to risk management under Regulation (EU) 2020/741. In China, a set of standards released and coming into force during 2026, including HG/T 5111-2025 implemented on March 1, 2026 and GB/T 46604-2025 implemented on May 1, 2026, plus the release of JB/T 15460-2026 on April 28, 2026 (implemented on November 2, 2026), strengthens specification-led procurement for hollow fiber modules and integrated flat-membrane domestic sewage treatment equipment, raising the compliance bar for module design, testing, and system integration.
Value Chain Analysis
The value chain starts with upstream polymer and ceramic inputs, including PES and PVDF for polymeric membranes and alumina or zirconia for ceramic membranes. After membrane-sheet or fiber fabrication, the supply chain converts elements into configurations such as spiral-wound, hollow fiber, tubular, and plate-and-frame formats, which are then packaged into skid-mounted systems.
System integrators and EPC partners typically complete pretreatment, controls, and cleaning-in-place architectures across municipal potable reuse and wastewater treatment, as well as industrial ZLD/MLD trains and pharmaceutical water systems. Downstream, channel power often concentrates with utilities and industrial owners that procure performance guarantees (permeate quality, recovery, uptime) and service bundles, which favors suppliers with field service and digital monitoring capabilities. Energy and chemical consumption, fouling management, and supply continuity for specialized materials and high-precision module manufacturing remain key friction points, encouraging vendors to pursue partnerships for piloting, validation, and lifecycle service contracts rather than one-off element sales.
Competitive Landscape
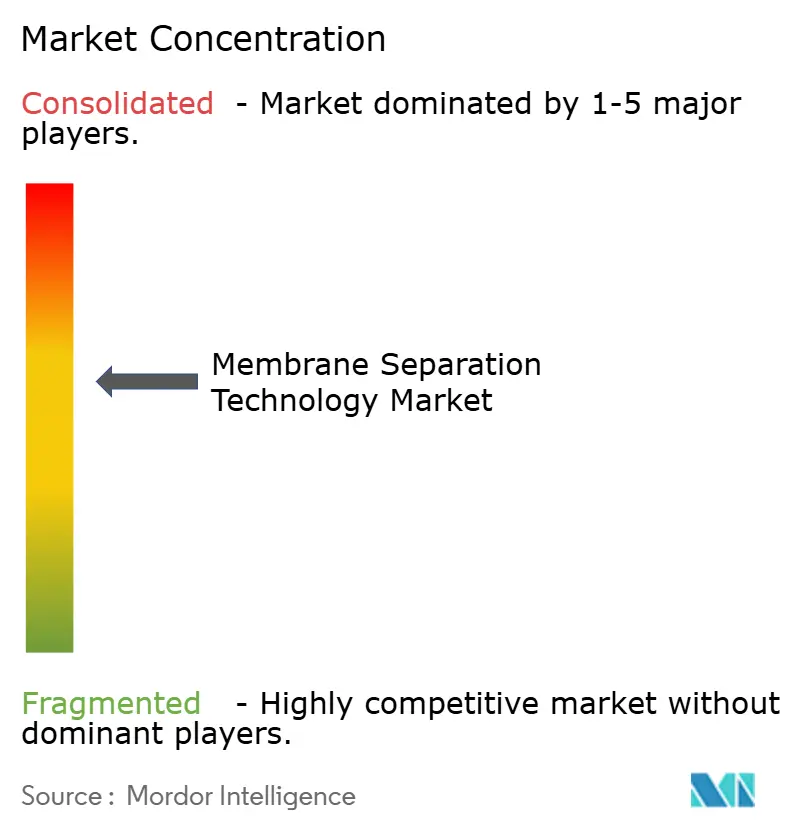
Global supply is moderately consolidated. DuPont, 3M, Toray, and Veolia collectively held a combined 52% share in 2024, leveraging vast patent estates, broad element catalogues, and service networks. DuPont canceled a proposed water-business spin-off in March 2025, signaling confidence that drinking-water and lithium-extraction membranes warrant internal investment DUPONT.COM. The company continues to bundle ion-exchange and membrane products for holistic treatment packages, raising switching costs for clients.
Strategic moves intensify: Thermo Fisher paid USD 4.1 billion for Solventum’s purification unit to bolster bioproduction offerings and cross-sell into single-use assemblies[2]Thermo Fisher Scientific, “Thermo Fisher to Acquire Solventum’s Purification & Filtration Unit,” thermofisher.com. Toray scales graphene-oxide coating on hollow fibers to cut fouling in MBRs, while Veolia pilots electrically responsive membranes, aiming to commercialize them by 2028. Smaller innovators such as NX Filtration and Aquaporin pursue IPO funds or licensing deals, betting that biomimetic channels and thin nano-porous layers will capture premium niches.
White-space opportunities sprout in lithium brine purification where nanofiltration selectively rejects divalent ions yet passes lithium at high flux. Multiple Australian start-ups trial these membranes in Chile and Argentina to sidestep reagent-heavy precipitation routes. AI-enabled predictive maintenance also turns into a battleground; service contracts now promise uptime benchmarks with penalties that incentivize vendors to deploy cloud analytics and edge sensors across installed fleets.
Membrane Separation Technology Industry Leaders
DuPont
TORAY ENGINEERING Co.,Ltd.
Veolia Water Technologies & Solutions
Nitto Denko Corporation
3M
- *Disclaimer: Major Players sorted in no particular order
Membrane Separation Technology Market Companies Covered in this Report
- 3M
- ALFA LAVAL
- Aquaporin A/S
- Asahi Kasei Corporation
- AXEON Water
- DuPont
- Kovalus Separation Solutions
- KUBOTA Corporation
- LG Chem
- Nitto Denko Corporation
- Pall Corporation
- Pentair
- Samco Technologies, Inc.
- Sartorius AG
- Thermo Fisher Scientific
- TORAY ENGINEERING Co.,Ltd.
- Veolia Water Technologies & Solutions
- Xylem

Market Opportunities and Future Outlook
The most immediate opportunity is in regulated PFAS compliance and broader drinking-water quality tightening, where municipal buyers specify nanofiltration and reverse osmosis retrofits to meet contaminant targets with measurable operating-cost outcomes. Water reuse and high-recovery industrial wastewater programs also create whitespace for ZLD/MLD-oriented elements and more chemically robust membranes, supported by supplier actions such as DuPont's April 2026 FilmTec Fortilife XC-Max UHP and XC220 RO element launch for advanced ZLD/MLD and resource-recovery applications.
Project activity points to adoption vectors beyond conventional seawater RO. IDE Technologies signed a contract in January 2026 with SIPCOT for a 60 MLD SWRO desalination plant in Tuticorin, India. In June 2026, Maynilad awarded Acuriant phase one of a 100 MLD ceramic ultrafiltration retrofit at PWTP-1 in Metro Manila, which indicates municipal willingness to use ceramic UF for retrofit durability. On the supply side, AdiMem Technologies (Vipul Organics unit) began commercial sales in April 2026 from its Sayakha, Gujarat facility for indigenously developed RO and UF membranes, suggesting regional supply chain build-out that can shorten lead times and support price-competitive tenders in high-volume water and industrial accounts.
Recent Industry Developments in Membrane Separation Technology Market
- April 2026: DuPont launched FilmTec Fortilife XC-Max UHP and XC220 reverse osmosis membrane elements targeted at ZLD/MLD and resource recovery systems. The release expands high-recovery options for industrial water reuse and strengthens DuPont's position in high-end RO element supply for municipal and industrial customers. This move supports broader retrofit and new-build projects requiring robust membrane performance.
- September 2025: Veolia signed a 30-year operation and maintenance contract for a USD 500 million industrial water recycling plant at SATORP in Jubail Industrial City, Saudi Arabia, incorporating ZeeWeed membranes. The long-duration services contract reinforces the shift toward lifecycle solutions that bundle membranes, performance assurance, and plant optimization.
- May 2024: Veolia (through SIDEM) signed a contract to supply reverse osmosis technology for the 818,000 cubic meter per day Hassyan seawater desalination plant in Dubai, UAE, with initial operations slated for 2026. The project adds scale to Middle East SWRO deployments and supports continued standardization of high-volume RO element supply and service ecosystems.


Membrane Separation Technology Market Report Scope and Research Methodology
Market Definition and Coverage
For this study, the membrane separation technology market covers revenues earned from membrane-based separation used to remove, concentrate, or purify liquids and gases across industrial and municipal use, including the membrane elements and related modules sold for these processes.
Scope exclusions: We do not count non-membrane separation equipment (such as centrifuges and conventional thermal distillation trains) and routine plant services that are not sold as membrane separation products.
Segments Covered in This Report
- By Membrane Technology
- Reverse Osmosis
- Ultrafiltration
- Nanofiltration
- Microfiltration
- Other Technologies (Forward Osmosis, Membrane Bioreactor (MBR), etc.)
- By Membrane Material
- Polymeric
- Ceramic
- Composite / Hybrid (Graphene, MOF, Zeolite)
- By Module Configuration
- Spiral Wound
- Hollow Fiber
- Plate and Frame
- Tubular
- By Application
- Water and Waste-water Treatment
- Food Processing
- Chemical and Pharmaceutical
- Other Applications (Gas Separation, Electronics etc.)
- By Geography
- Asia-Pacific
- China
- Japan
- India
- South Korea
- ASEAN Countries
- Rest of Asia-Pacific
- North America
- United States
- Canada
- Mexico
- Europe
- Germany
- United Kingdom
- France
- Italy
- Spain
- Russia
- NORDIC Countries
- Rest of Europe
- South America
- Brazil
- Argentina
- Rest of South America
- Middle-East and Africa
- Saudi Arabia
- South Africa
- Rest of Middle-East and Africa
- Asia-Pacific
Data Sources, Market Sizing, and Validation
Desk Research
Desk work starts with building the demand and supply context that sits behind membrane adoption. We referenced public sources such as US EPA water regulations and guidance notes, USGS water and industrial water-use statistics, Eurostat industrial production indicators, and UN Comtrade trade flows for relevant filtration and membrane-related product categories.
To keep assumptions realistic, we also reviewed items like patent databases for membrane materials and module designs, peer-reviewed journals covering RO, UF, NF, and MF performance trends, and association and standards body publications that explain testing methods and membrane ratings. Company annual reports, investor decks, and reputable press were used to spot capacity additions, expansion plans, and pricing commentary, and then a paid subscription for company financials and an import-export shipment-level database were used selectively to validate directional volumes and supplier exposure. This list is illustrative, and many other public and paid sources were also checked for data collection, cross-verification, and clarification.
Primary Interviews and Surveys
Primary discussions were completed with a mix of membrane manufacturers, system integrators, EPC-linked experts, and end users in municipal water, industrial wastewater, food processing, and chemicals so that secondary assumptions could be corrected where needed. For a global market like this, we made sure inputs were balanced across APAC, EMEA, and the Americas because regulation intensity, reuse needs, and project cycles can look very different by region.
Distribution of primary research fieldwork respondents
| Company type | Respondent position | Region |
|---|---|---|
| Top tier: 37% | CXOs: 12% | APAC: 47% |
| Mid tier: 41% | Functional/Unit leaders: 28% | EMEA: 33% |
| Smaller Players: 22% | Managers: 60% | Americas: 20% |
Market-Sizing & Forecasting
Sizing is built using a top-down approach where macro water-treatment and industrial processing activity, trade and production signals, and technology penetration are used to reconstruct the addressable demand pool for membrane separation. The model is then checked using selective bottom-up approximations, such as sampled ASP times estimated volumes for common module formats (spiral wound and hollow fiber) and channel feedback on replacement cycles, and totals are adjusted when the checks do not align.
Inputs that matter in this market include municipal and industrial water-treatment capex cycles, desalination and reuse project momentum, tightening contaminant rules that push higher rejection requirements, membrane replacement frequency by application, and mix shifts across RO, UF, NF, and MF that change the average selling price over time. Since country-level data can be uneven, gaps are handled through regional proxying that is anchored to observable indicators like industrial output, wastewater treatment intensity, and import trends, and then validated through interviews.
Forecasts are produced using scenario analysis supported by trend-based smoothing on the core demand drivers, and we only lock a forward view after the variables match the consensus ranges heard from practitioners on capacity growth, project timing, and pricing movement.
Data Validation & Update Cycle
Validation is done through multiple passes, where outputs are compared against independent signals like project pipelines, trade direction, and observed adoption shifts across key applications, and then outliers are investigated before sign-off. If a sharp variance shows up, analysts re-check the input series, revisit conversion and inflation handling, and re-contact sources when a driver changed materially.
The report is refreshed on an annual cycle, and interim updates are triggered when major regulatory actions, large capacity additions, or abrupt feedwater and energy cost changes shift demand assumptions. Before delivery, a final review pass is completed so the numbers reflect the latest available public data and the most recent market conversations.
Mordor Intelligence's Membrane Separation Technology Market Size Versus Other Published Estimates
It is normal to see different market values for membrane separation technology because publishers do not always count the same revenue buckets or use the same timing for currency and price assumptions. The spread also increases when one estimate leans on aggressive adoption curves, and another relies more on observed project flow and replacement demand.
Some published figures group in adjacent filtration and treatment hardware or include broader plant-level spending, and this expands the total quickly. In Mordor Intelligence, the market total is limited to membrane separation technologies and their related module configurations across applications, and then cross-checks like technology mix (RO, UF, NF, MF) and replacement cycle logic are used so double counting is less likely.
Benchmark comparison
| Source | Market Size | Gaps in Research Methodology |
|---|---|---|
| Mordor Intelligence | USD 27.53 B (2026) | |
| Global Consultancy A | USD 34.65 B (2025) | Uses a broader current-year base that can reflect faster penetration and higher blended pricing across multiple applications, and the time frame difference can also shift totals due to currency and inflation timing. |
| Industry Publisher B | USD 25.65 B (2024) | Anchors the estimate in an earlier base year and may apply a different technology and application mix at that point, which can reduce the implied ASP and the counted adoption in industrial and municipal projects. |
Overall, the table shows that year selection and what gets counted around membrane-related spending are the two biggest drivers behind the differences. Our approach stays traceable because the total is built from clear demand indicators, checked with practical price and volume logic, and then reviewed for variance before forecasts are finalized.


Key Questions Answered in the Report
What is the current size of the membrane separation technology market?
The market is valued at USD 27.53 billion in 2026 and is forecast to reach USD 33.82 billion by 2031.
Which membrane technology holds the largest share today?
Reverse osmosis leads with 47.73% of global revenue thanks to its established role in desalination and high-purity water production.
Which application segment is growing fastest through 2031?
Chemical and pharmaceutical processing is projected to post a 5.09% CAGR owing to stricter purity needs in biologics and sterile formulations.
Why is North America the fastest-growing regional market?
New PFAS drinking-water limits have triggered accelerated investments in nanofiltration and low-pressure reverse-osmosis replacements.
What is the biggest restraint on wider adoption of membrane technologies?
High capital outlays and operating costs, especially for ceramic systems, continue to delay purchases in developing regions.
Page last updated on:


 Your data is secure and never sold or shared.


