Reverse Osmosis Membrane Market Size and Share
Market Overview
| Study Period | 2020 - 2031 |
|---|---|
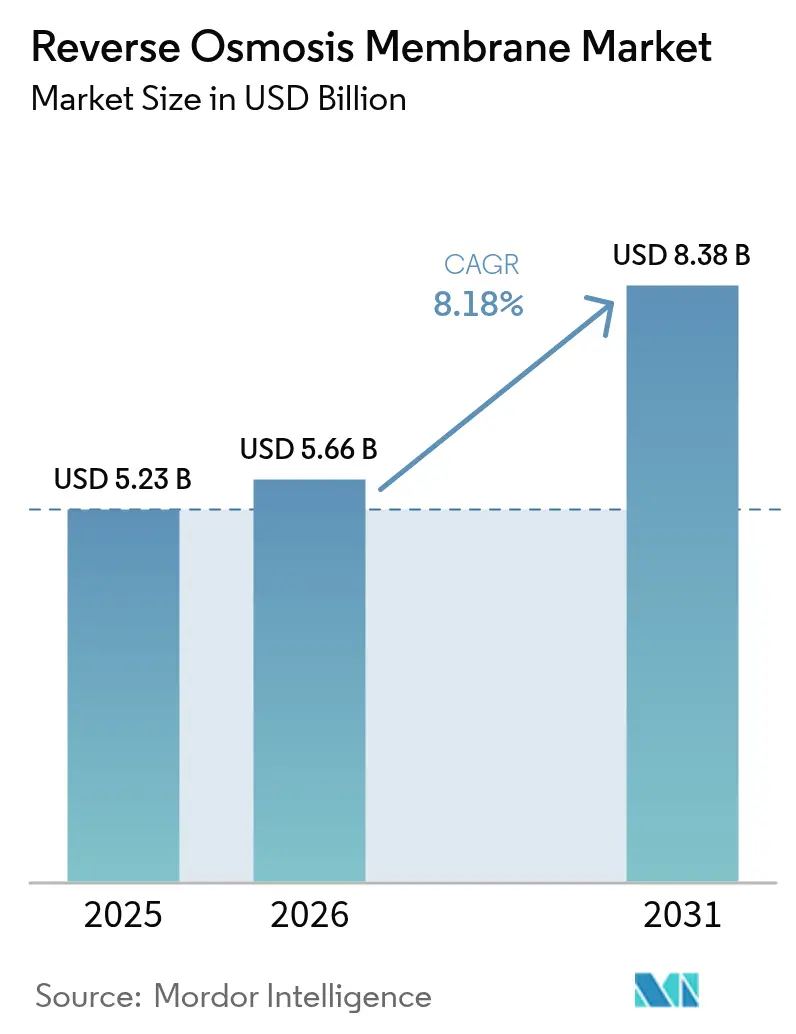
| Market Size (2026) | USD 5.66 Billion |
| Market Size (2031) | USD 8.38 Billion |
| Growth Rate (2026 - 2031) | 8.18% CAGR |
| Fastest Growing Market | Middle East and Africa |
| Largest Market | Asia Pacific |
| Market Concentration | Medium |
Major Players *Disclaimer: Major Players sorted in no particular order Image © Mordor Intelligence. Reuse requires attribution under CC BY 4.0. | |
Reverse Osmosis Membrane Market Analysis by Mordor Intelligence
The Reverse Osmosis Membrane market size is expected to grow from USD 5.23 billion in 2025 to USD 5.66 billion in 2026 and is forecast to reach USD 8.38 billion by 2031 at 8.18% CAGR over 2026-2031. Water‐scarcity pressures, tightening discharge regulations, and membrane technology improvements collectively lift demand for thin-film composite (TFC) elements in industrial and municipal plants across all major regions. Regulatory agencies in the European Union, China, and the United States now cap priority contaminants such as PFAS and specific pharmaceutical actives at parts-per-trillion levels, prompting rapid upgrades of legacy treatment lines to thin-film modules that can consistently meet those limits. At the same time, hollow-fiber innovations improve fouling resistance and packing density, enabling compact systems for off-grid or space-restricted installations.
Key Report Takeaways
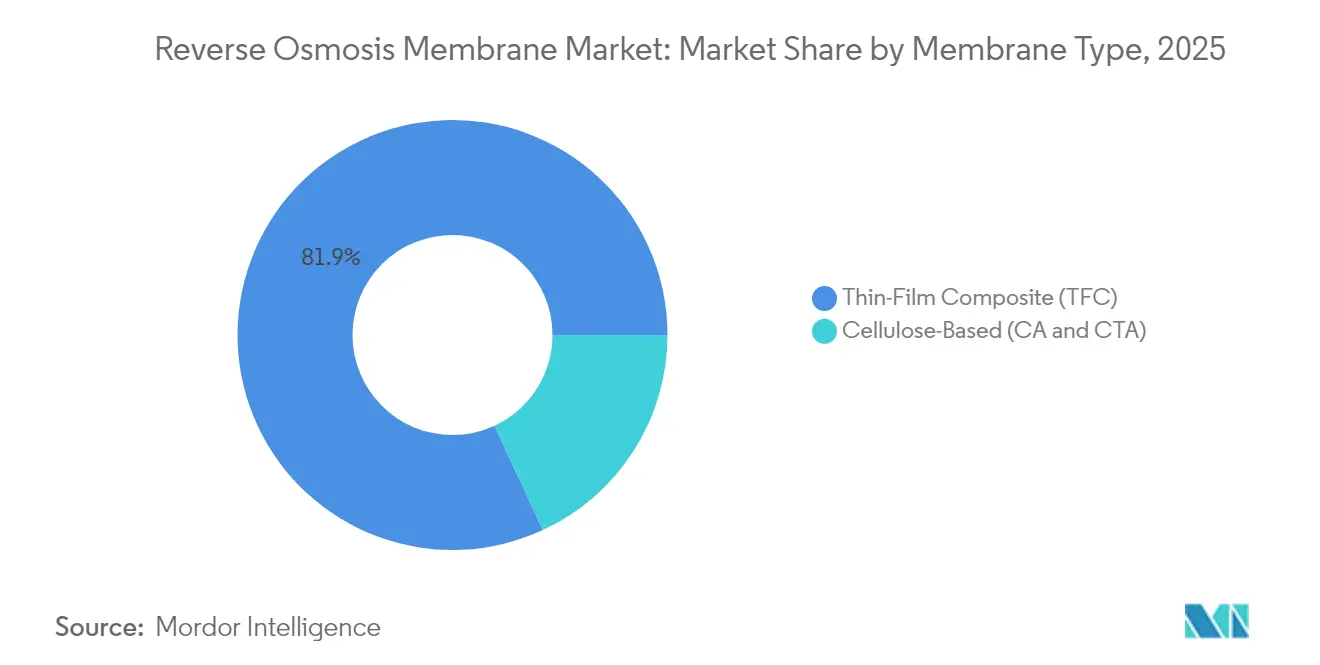
- By membrane type, thin-film composite elements captured 81.90% revenue share in 2025 while cellulose-based membranes posted the highest projected CAGR at 8.62% through 2031.
- By configuration, spiral-wound devices held 69.60% of the reverse osmosis membrane market share in 2025, whereas hollow-fiber modules are projected to expand at an 8.55% CAGR to 2031.
- By end-use industry, municipal and desalination utilities accounted for a 37.85% share of the reverse osmosis membrane market size in 2025 and healthcare and pharmaceuticals is advancing at a 8.92% CAGR through 2031.
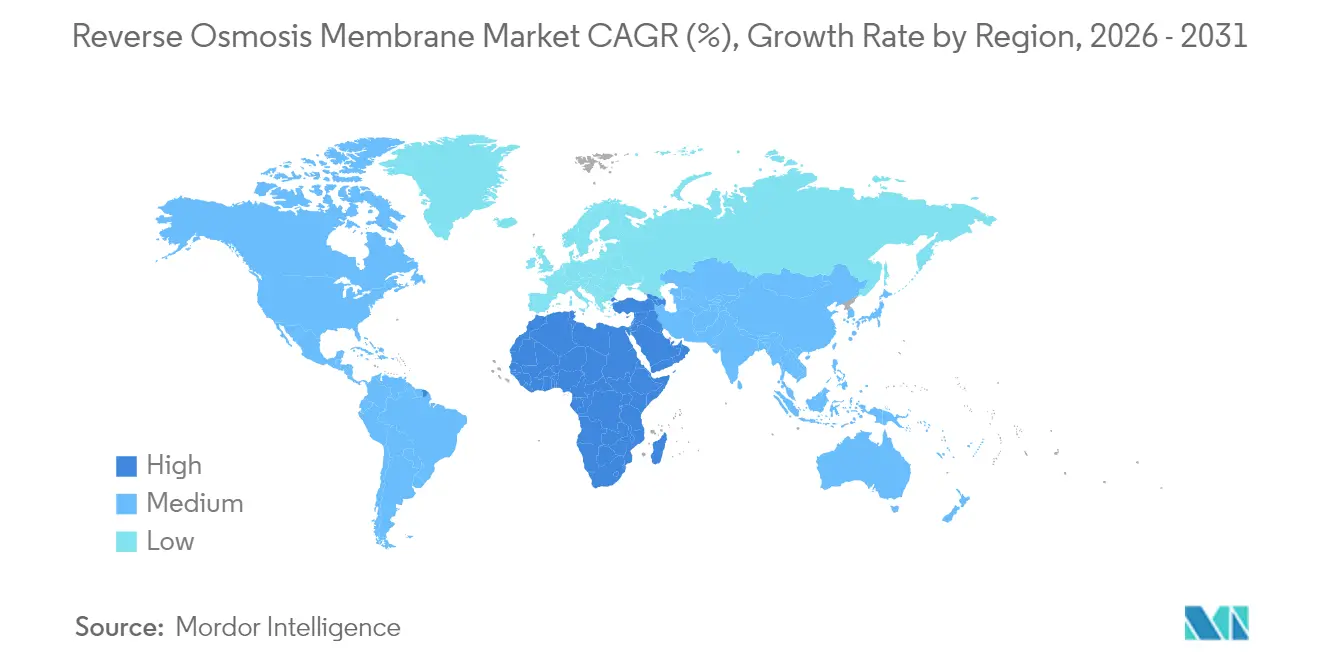
- By geography, Asia-Pacific led with 45.60% revenue share in 2025, while the Middle East and Africa region is forecast to expand at a 8.78% CAGR out to 2031.
Note: Market size and forecast figures in this report are generated using Mordor Intelligence’s proprietary estimation framework, updated with the latest available data and insights as of 2026.
Global Reverse Osmosis Membrane Market Trends and Insights
Driver Impact Analysis*
| Drivers | (~) % Impact on CAGR Forecast | Geographic Relevance | Impact Timeline |
|---|---|---|---|
| Increasing demand for pure and potable water | +2.1% | Global with APAC and MEA focus | Long term (≥ 4 years) |
| Expansion of seawater desalination capacity | +1.8% | Middle East and coastal APAC | Medium term (2-4 years) |
| Stricter industrial-effluent discharge norms | +1.2% | North America and EU; spreading to APAC | Short term (≤ 2 years) |
| Growth in residential POU/POE filtration units | +0.9% | North America, Europe, urban APAC | Medium term (2-4 years) |
| Low-pressure RO membranes enabling off-grid usage | +0.6% | Rural APAC, Sub-Saharan Africa, Latin America | Long term (≥ 4 years) |
| Source: Mordor Intelligence | |||
Increasing Demand for Pure and Potable Water
Climate change intensifies water stress for 40% of the global population, amplifying the appeal of membrane purification that can process brackish or contaminated supplies at scale[1]European Environment Agency, “Industrial Emissions Directive 2024 Amendments,” eea.europa.eu. Municipal utilities in India, Vietnam, and Nigeria now budget reverse osmosis upgrades into five-year capital plans because operating costs have fallen 25% since 2020 thanks to higher-flux TFC sheets. Urban growth compounds this pressure as megacities must secure new potable sources without increasing treatment footprints. Plasma-enhanced surface modification further cuts biofouling episodes, allowing longer run times between clean-in-place cycles. Declining module prices therefore align with public-sector objectives to achieve Sustainable Development Goal 6 targets by 2030.
Expansion of Seawater Desalination Capacity
Saudi Arabia’s NEOM utility alone will demand membranes equal to 15% of current annual global production, accelerating pre-order activity for high-flux, low-pressure sheets. Morocco’s Agadir expansion and Jordan’s Red Sea Project similarly tighten supply, prompting Asian producers in South Korea and China to plan line expansions by 2026. Scaling efficiencies at mega-plants now cut levelized water costs below USD 0.50 per cubic meter, reinforcing RO as the default technology for new capacity. These trends reinforce long-term demand visibility for reverse osmosis membrane market participants.
Stricter Industrial-Effluent Discharge Norms
The European Union slashed permitted pharmaceutical and chemical discharges by 30% in 2024, compelling upgrades that only membrane filtration can reliably meet[2]World Health Organization, “Global Water Security Report 2024,” who.int . China followed with textile and petrochemical thresholds that effectively mandate zero-liquid-discharge systems using multi-stage RO plus crystallizers. U.S. state regulators, meanwhile, target PFAS below four parts per trillion, a level unattainable with conventional adsorptive or biological schemes.
Growth in Residential POU/POE Filtration Units
Residential installations climbed 35% across North America and Europe in 2024 as consumers reacted to media coverage of PFAS, nitrates, and endocrine disruptors. Miniaturized thin-film modules now retail under USD 100 for point-of-use systems, while smart-home integration delivers real-time sensor alarms when rejection declines. Subscription-based filter-replacement models further improve affordability by spreading costs over three-year contracts. In Japan and South Korea, apartment developers install centralized point-of-entry systems to raise property value, widening the installed base for aftermarket membrane sales. Vendors leverage e-commerce channels to reach middle-income consumers in Indonesia and Mexico, delivering double-digit shipment growth since 2023.
Restraint Impact Analysis*
| Restraints | (~) % Impact on CAGR Forecast | Geographic Relevance | Impact Timeline |
|---|---|---|---|
| High acquisition and replacement cost of membranes | -1.4% | Global, particularly acute in developing markets | Short term (≤ 2 years) |
| Persistent fouling and scaling issues | -0.8% | Industrial applications globally, hot climate regions | Medium term (2-4 years) |
| Supply-chain risk for specialty polyamide feedstocks | -0.5% | Global, concentrated in Asia-Pacific manufacturing hubs | Short term (≤ 2 years) |
| Source: Mordor Intelligence | |||
High Acquisition and Replacement Cost of Membranes
Membrane elements often represent 35-45% of total operating expenditure, and price volatility in polyamide feedstocks can push unit costs to USD 300 per 8-inch spiral, deterring adoption in cost-sensitive markets. Smaller municipal operators in Southeast Asia sometimes extend element lifetimes beyond manufacturer guidelines, trading higher energy usage for lower near-term capital outlay. Financing institutions now request five-year replacement reserve accounts in project models, raising up-front cash requirements and elongating payback. Component reuse and recycling remain limited, though pilot programs in Spain and Singapore show promise for reclaiming polypropylene housings. Until secondary markets or recycling streams mature, replacement expense will curb installation growth among budget-constrained buyers.
Persistent Fouling and Scaling Issues
RO plants lose 15–25% flux annually from biofouling and mineral scaling, necessitating chemical cleans every 4–6 weeks that increase downtime and operating costs. Biofilm growth can occur within weeks when nutrient levels are elevated, particularly in food-processing effluents. Scaling from calcium carbonate or silica accelerates under high-recovery designs pursued for brine minimization, forcing operators to accept lower recoveries or install costly antiscalant dosing systems. Though surface-grafted zwitterionic coatings and graphene oxide interlayers show early success in lab trials, commercial proof of durability beyond three-year cycles remains limited. These operational headaches can cause some industrial users to defer RO adoption in favor of less efficient but better-understood treatment routes.
*Our forecasts treat driver/restraint impacts as directional, not additive. The impact forecasts reflect baseline growth, mix effects, and variable interactions.
Segment Analysis
By Membrane Type: Thin-Film Composite Dominance Drives Innovation
Thin-film composite sheets captured an 81.90% reverse osmosis membrane market share in 2025, benefitting from 99.5% salt rejection and broad chemical stability. Robust investment in automated coating lines now yields consistent roll-to-roll throughput above 10,000 m² per day, lowering costs while improving quality. Cellulose-based alternatives retain footholds in beverage and dairy clarification where biodegradability and chlorine tolerance matter more than rejection efficiency. Nonetheless, the performance gap widens each year as solvent-free interfacial polymerization creates ultra-thin barrier layers under 50 nm, reducing pump energy by 10–15%.
Across 2026–2031, TFC demand will rise at an 8.49% CAGR as desalination mega-plants specify higher-flux, low-pressure variants to hit sub-3 kWh/m³ energy targets. The reverse osmosis membrane market size for cellulose acetate products is set to shrink to less than USD 145 million by 2031 as regulation favors longer-life, lower-waste solutions. Sustainability narratives could revive interest in bio-derived membranes, yet recycling schemes for TFC elements are advancing faster, dulling that advantage. Suppliers now trial per- and polyfluoroalkyl-free synthesis routes to anticipate future environmental scrutiny without sacrificing performance.


By Configuration: Spiral-Wound Leadership Faces Hollow-Fiber Challenge
Spiral-wound elements held 69.60% of the reverse osmosis membrane market size in 2025 thanks to well-established supply chains and straightforward retrofit compatibility. High-pressure vessels, cartridge housing standards, and cleaner logistics all favor the incumbent format. Yet hollow-fiber modules are projected to post an 8.55% CAGR, outpacing every other configuration through 2031.
Higher packing density lets hollow-fiber systems deliver the same permeate flow in housings 40% shorter, a decisive benefit where plant footprints command premium value, such as offshore oil platforms and dense urban districts. Backwash capability, absent in spiral elements, further extends operational uptime in particulate-rich waters and aligns with reduced chemical clean objectives. Manufacturing defects once plagued fiber integrity, but laser-monitored spinning lines now push burst pressures above 100 bar, clearing reliability hurdles. Investment in dedicated hollow-fiber plants by Japanese and Korean majors signals confidence that demand will scale fast enough to justify capacity expansions.
By End-use Industry: Healthcare Precision Drives Fastest Growth
Municipal and desalination utilities dominated in 2025, accounting for 37.85% of the reverse osmosis membrane market size as drought-stricken regions doubled down on long-life TFC investments. However, healthcare and pharmaceuticals will lead growth with a 8.92% CAGR out to 2031, fueled by rising biologics output in India and Brazil plus stricter USP water specifications.
Drug makers require multi-pass RO-EDI (electrodeionization) trains validated under Good Manufacturing Practice, elevating membrane performance and traceability demands. Suppliers differentiate on leachables profiles, endotoxin retention, and electronic batch-record platforms that streamline FDA audits. The reverse osmosis membrane market now attracts specialty polymer firms aiming to supply ultra-clean feedstocks, mitigating risk of extractable organics that could compromise drug purity. This premium niche delivers margins up to 25% higher than municipal tenders, incentivizing continuous research and development.

Geography Analysis
Asia-Pacific accounted for 45.60% of reverse osmosis membrane market revenue in 2025 on the back of China’s zero-liquid-discharge drive and India’s Smart Cities rollouts. Chinese textile, electronics, and petrochemical facilities together consumed over 30% of global membrane output as of 2024. Domestic producers scale quickly in Jiangsu and Zhejiang provinces, shortening lead times and lowering landed cost versus imported sheets. India’s National Water Mission mandates 20% recycling by 2030, prompting state utilities to integrate RO as the backbone of new water reuse projects across Pune, Surat, and Chennai.
Middle East and Africa will register the fastest regional growth at 8.78% CAGR through 2031, driven by USD 20 billion in desalination spending under Saudi Arabia’s Vision 2030 and multiple public–private partnerships in the UAE, Qatar, and Oman. African states such as Kenya and Ghana pilot solar-powered RO units for rural communities where grid ties are unavailable, signaling a decentralized trajectory distinct from Gulf mega-projects.
North America and Europe remain mature yet lucrative as replacement business and regulatory compliance underpin steady sales. The European Commission’s Industrial Emissions Directive now forces chemical producers to retrofit multi-barrier systems, often selecting hollow-fiber pre-filters followed by TFC spirals to hit discharge thresholds.

Competitive Landscape
The reverse osmosis membrane industry exhibits moderate fragmentation. DuPont, Toray Industries, and LG Chem leverage proprietary thin-film chemistries, backward integration into polyamide, and fully automated coating lines that elevate yields above 98%. Competitive intensity has shifted toward fouling-mitigation innovations. Toray’s hydrophilic nanolayer extends clean-in-place intervals by 20%, while DuPont commercialized a chlorine-tolerant sheet targeting reuse schemes with variable pretreatment. Intellectual-property filings exceeded 200 in 2024, concentrated on surface-layer grafting and solvent-free interfacial polymerization methods that reduce greenhouse-gas intensity.
Reverse Osmosis Membrane Industry Leaders
TORAY INDUSTRIES, INC.
NITTO DENKO CORPORATION
LG Chem
Koch Membrane Systems, Inc
DuPont
- *Disclaimer: Major Players sorted in no particular order

Recent Industry Developments
- July 2025: Toray Industries supplied RO membranes to the 600,000 m³ /day Shuaibah 3 IWP desalination plant in Saudi Arabia through subsidiary Toray Membrane Middle East LLC.
- September 2023: LG Chem invested in its Cheongju facility to add 400,000 spiral modules per year, translating to 4.32 million m³ /day desalination capacity when fully online.


Global Reverse Osmosis Membrane Market Report Scope
Reverse osmosis involves passing water through a semi-permeable membrane by applying pressure. The semi-permeable membrane allows the water to pass through while trapping all the contaminants and other dissolved solids, generally reducing the total dissolved solids in the water. The reverse osmosis membrane market is segmented by membrane type and application. By membrane type, the market is segmented into thin film composite and cellulose-based. By application, the market is segmented into residential, commercial, municipal, industrial, and other applications. The report covers market sizes and forecasts for 15 regional countries. For each segment, market sizing and forecasts have been done based on value (USD million).
| Thin-Film Composite (TFC) |
| Cellulose-Based (CA and CTA) |
| Spiral-Wound |
| Hollow-Fiber |
| Plate and Frame |
| Tubular |
| Residential |
| Commercial and Institutional |
| Municipal and Desalination Utilities |
| Industrial Process Water |
| Power Generation |
| Food and Beverage |
| Healthcare and Pharmaceuticals |
| Asia-Pacific | China |
| India | |
| Japan | |
| South Korea | |
| Rest of Asia-Pacific | |
| North America | United States |
| Canada | |
| Mexico | |
| Europe | Germany |
| United Kingdom | |
| France | |
| Italy | |
| Rest of Europe | |
| South America | Brazil |
| Argentina | |
| Rest of South America | |
| Middle-East and Africa | Saudi Arabia |
| South Africa | |
| Rest of Middle-East and Africa |
| By Membrane Type | Thin-Film Composite (TFC) | |
| Cellulose-Based (CA and CTA) | ||
| By Configuration | Spiral-Wound | |
| Hollow-Fiber | ||
| Plate and Frame | ||
| Tubular | ||
| By End-use Industry | Residential | |
| Commercial and Institutional | ||
| Municipal and Desalination Utilities | ||
| Industrial Process Water | ||
| Power Generation | ||
| Food and Beverage | ||
| Healthcare and Pharmaceuticals | ||
| By Geography | Asia-Pacific | China |
| India | ||
| Japan | ||
| South Korea | ||
| Rest of Asia-Pacific | ||
| North America | United States | |
| Canada | ||
| Mexico | ||
| Europe | Germany | |
| United Kingdom | ||
| France | ||
| Italy | ||
| Rest of Europe | ||
| South America | Brazil | |
| Argentina | ||
| Rest of South America | ||
| Middle-East and Africa | Saudi Arabia | |
| South Africa | ||
| Rest of Middle-East and Africa | ||


Key Questions Answered in the Report
How large is the reverse osmosis membrane market in 2026?
The reverse osmosis membrane market size stands at USD 5.66 billion in 2026.
What is the forecast CAGR for reverse osmosis membranes to 2031?
Industry revenues are projected to grow at an 8.18% CAGR through 2031.
Which region represents the largest demand?
Asia-Pacific leads with 45.60% share due to industrial and municipal project pipelines.
Which end-use segment is expanding fastest?
Healthcare and pharmaceuticals is forecast to grow at 8.92% CAGR as USP water standards tighten.
What configuration is gaining ground against spiral-wound elements?
Hollow-fiber modules are projected to advance at an 8.55% CAGR through 2031.
What factor most constrains wider adoption?
High membrane replacement costs, representing up to 45% of operating expenses, remain the chief barrier.
Page last updated on:


