
Market Overview
| Study Period | 2021 - 2031 |
|---|---|
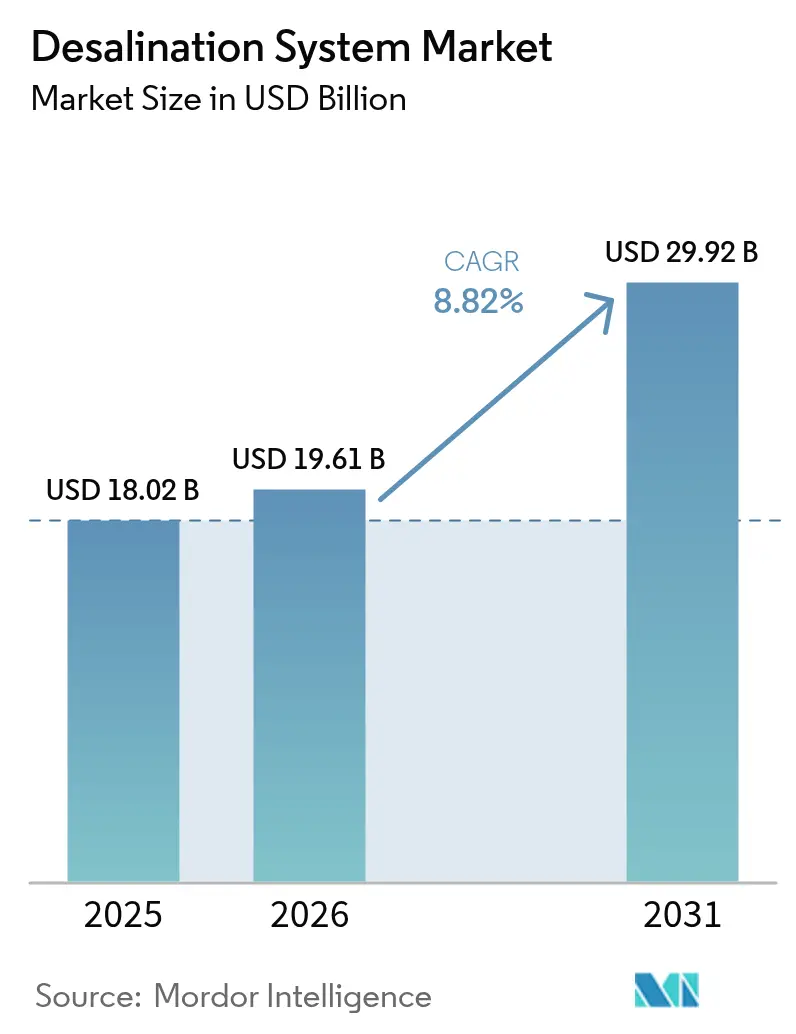
| Market Size (2026) | USD 19.61 Billion |
| Market Size (2031) | USD 29.92 Billion |
| Growth Rate (2026 - 2031) | 8.82 % |
| Fastest Growing Market | Middle East and Africa |
| Largest Market | Middle East and Africa |
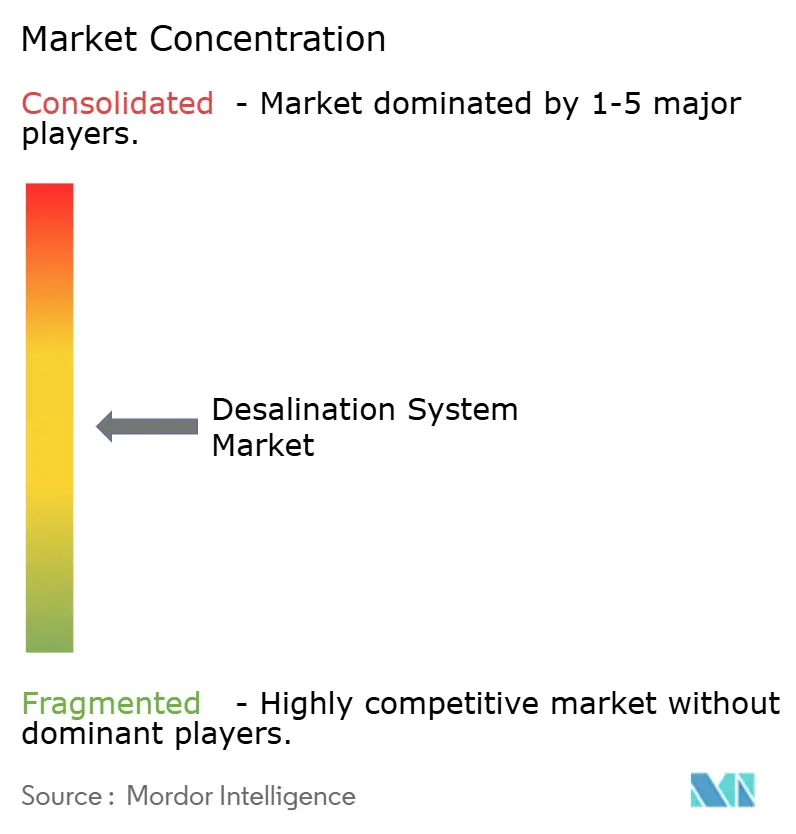
| Market Concentration | Medium |
Major Players *Disclaimer: Major Players sorted in no particular order Image © Mordor Intelligence. Reuse requires attribution under CC BY 4.0. | |
Desalination System Market Analysis by Mordor Intelligence
The Desalination System Market size is projected to expand from USD 18.02 billion in 2025 and USD 19.61 billion in 2026 to USD 29.92 billion by 2031, registering a CAGR of 8.82% between 2026 to 2031. The upward trajectory reflects policy choices that frame desalination as core infrastructure for national water security rather than an emergency measure. Sovereign water-security funds are underwriting multibillion-dollar public-private partnerships, semiconductor foundries and green-hydrogen developers are building on-site plants to avert supply interruptions, and reverse-osmosis (RO) energy-recovery costs keep falling in real terms. Industrial reuse mandates in Asia-Pacific accelerate technology adoption, while hybrid RO-electrodialysis units open inland mining opportunities. Against this backdrop, turnkey EPC bidding wars are giving way to technology licensing deals that monetize proprietary membranes, pressure-exchanger devices, and modular containerized units.
Key Report Takeaways
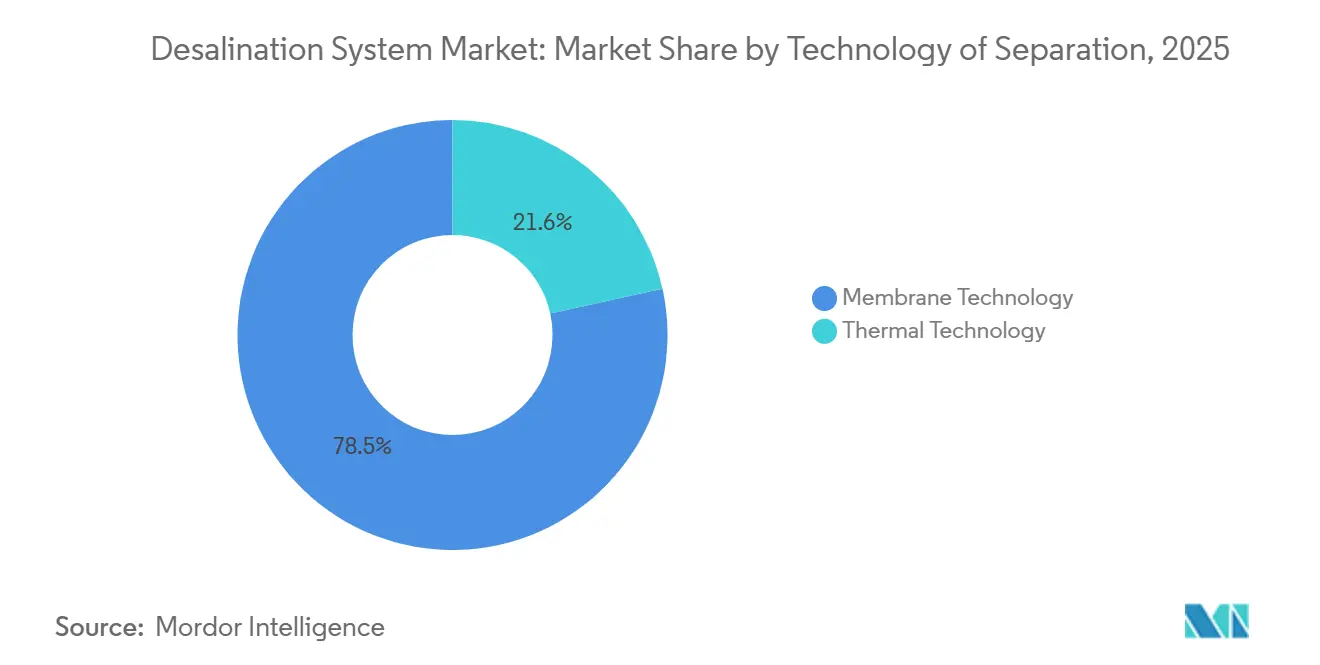
- By technology, membrane processes led with 78.45% of desalination system market share in 2025; the same segment is forecast to expand at a 10.55% CAGR through 2031.
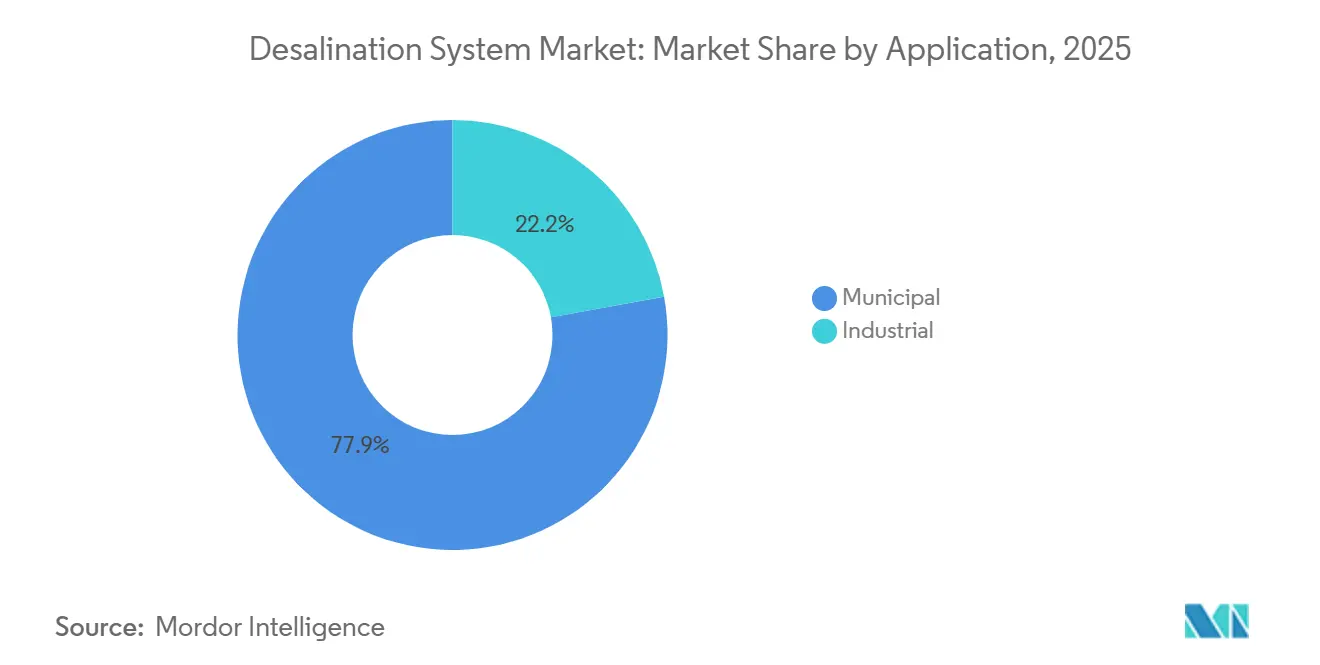
- By application, municipal accounted for 77.85% of the desalination system market size in 2025, while the industrial segment is advancing at a 10.28% CAGR through 2031.
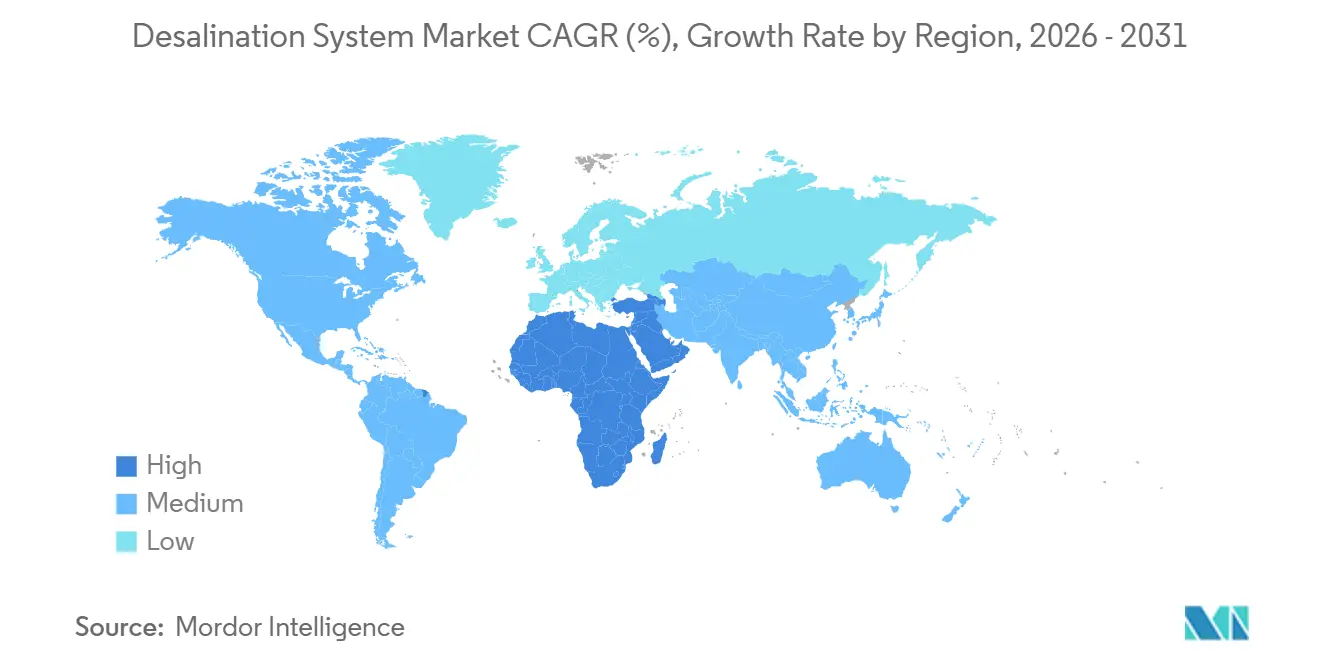
- By geography, Middle-East and Africa dominated with 52.70% share of the desalination system market size in 2025 and is expanding at a 10.46% CAGR to 2031.
Note: Market size and forecast figures in this report are generated using Mordor Intelligence’s proprietary estimation framework, updated with the latest available data and insights as of 2026.
Market Trends and Insights
Drivers Impact Analysis of Desalination System Market*
| Driver | (~) % Impact on CAGR Forecast | Geographic Relevance | Impact Timeline |
|---|---|---|---|
| Rapid Municipal Water Demand in MENA Region | +2.1% | Middle-East and Africa, with spillover to North Africa coastal cities | Medium term (2-4 years) |
| Industrial Reuse Mandates (Semiconductor, Pharma) | +1.8% | Asia-Pacific core (Taiwan, South Korea, India), secondary in North America | Short term (≤ 2 years) |
| Falling RO Capex and Energy-Recovery Costs | +1.5% | Global, with fastest adoption in cost-sensitive emerging markets | Long term (≥ 4 years) |
| Green-Hydrogen Cluster Demand (Coastal Deserts) | +1.3% | Middle-East (Saudi Arabia, UAE, Oman), Australia, Chile | Medium term (2-4 years) |
| Sovereign Water-Security Funds Underwriting PPPs | +1.2% | Middle-East and Africa, selective Asia-Pacific (Singapore, Indonesia) | Long term (≥ 4 years) |
| Source: Mordor Intelligence | |||


Rapid Municipal Water Demand in MENA Region
Per-capita renewable freshwater in Gulf Cooperation Council states fell below 100 m³ per year, less than 10% of the global scarcity benchmark. Saudi Arabia targets 8.5 million m³ /day of new RO capacity by 2030, a 60% jump over 2025 output. Egypt let contracts for three plants totaling 1.5 million m³ /day in 2025 to secure Suez Canal corridor growth. Algeria budgeted USD 4.2 billion for coastal desalination through 2028 to offset 40% distribution losses. Commissioning ramps in 2026-2027, adding 2.1 percentage points to baseline CAGR as network effects spur follow-on phases.
Industrial Reuse Mandates (Semiconductor, Pharma)
Zero-liquid-discharge rules require fabs to recycle at least 90% of process water in Taiwan and 95% in India. Taiwan’s 2024 rule changes accelerated on-site RO retrofits that now treat brackish groundwater and reclaimed effluent. South Korea subsidizes up to 40% of desalination capex for industrial plants above 5,000 m³ /day, boosting pharma API adoption. Compliance deadlines cluster in 2026-2027, lifting CAGR by 1.8 points.
Falling RO CAPEX and Energy-Recovery Costs
Membrane commoditization cut installed costs 18% between 2020 and 2025, while pressure-exchanger efficiency climbed to 98.5%, pushing specific energy to 2.2 kWh /m³. DuPont’s 2024 membranes deliver 15% higher flux, trimming pressure-vessel counts. Toray’s longer-life fibers lower annual replacement costs 25%[1]Toray Industries, “2024 Technical Bulletin on Biofouling,” toray.com . Lower capex unlocks projects across Sub-Saharan Africa and Southeast Asia, adding 1.5 points to long-run CAGR.
Green-Hydrogen Cluster Demand (Coastal Deserts)
Electrolyzers need 9-12 L of ultrapure water per kilogram of hydrogen, integrating desalination into project blueprints. NEOM’s 650 t /day hydrogen hub pairs a 300,000 m³ /day RO facility with renewable power. Oman, Australia, and Chile issued tenders in 2025 that tie water supply to offtake contracts, moving from engineering to construction and contributing 1.3 CAGR points.
Restraints Impact Analysis of Desalination System Market*
| Restraint | (~) % Impact on CAGR Forecast | Geographic Relevance | Impact Timeline |
|---|---|---|---|
| RO Membrane Fouling and Scaling | -0.9% | Global, acute in tropical and subtropical coastal zones with high algal activity | Short term (≤ 2 years) |
| Environmental Impact of Brine Discharge | -0.7% | North America (California, Texas), Europe (Spain, Greece), selective Asia-Pacific (Australia) | Medium term (2-4 years) |
| High Project Capex Sensitivity to Energy Prices | -1.1% | Middle-East and Africa (subsidy-dependent markets), South America | Short term (≤ 2 years) |
| Source: Mordor Intelligence | |||
RO Membrane Fouling and Scaling
Organic fouling cuts permeate flux up to 35% within 18 months at high-throughput Gulf plants. Rising sea-surface temperatures extend algal bloom seasons by 6-8 weeks, raising total organic carbon 25%. Biofilm-forming microbes resist chlorine pretreatment; incidents rose 22% year-on-year. Scaling in high-recovery systems shortens membrane life to 4.5 years. Countermeasures add USD 0.12-0.20 /m³ to opex, shaving 0.9 points off CAGR until fouling-resistant membranes commercialize.
Environmental Impact of Brine Discharge
California’s 2025 Ocean Plan limits salinity deviation to 2 ppt within 100 m of outfall, forcing co-location or expensive diffusers. Spain imposed a Mediterranean permit moratorium pending zero-impact solutions. Australia’s Great Barrier Reef rules demand 15:1 dilution, lifting capex by USD 0.22-0.30 /m³. Compliance costs suppress CAGR by 0.7 points until pilot-scale brine concentrators mature.
*Our forecasts treat driver/restraint impacts as directional, not additive. The impact forecasts reflect baseline growth, mix effects, and variable interactions.
Desalination System Market Segment Analysis
By Technology of Separation:
Membrane Dominance Driven by Efficiency GainsMembrane processes captured 78.45% of desalination system market share in 2025 and are projected to grow at a 10.55% CAGR through 2031. The desalination system market size for membrane technologies is set to outpace thermal methods as RO energy intensity falls below 2.5 kWh /m³ and energy-recovery devices approach 98% efficiency. Electrodialysis reversal (EDR) is gaining ground in inland brackish-water applications where total dissolved solids remain under 5,000 mg/L, cutting energy consumption compared with high-pressure RO. Hybrid MED-RO plants handle RO reject streams, pushing overall recovery above 70% while holding costs within 8% of pure RO configurations. Thermal multi-stage flash and multi-effect distillation decline except where power-plant waste heat is free, yet selective Gulf projects still move forward under co-generation economics.
Thermal technologies, although losing share, remain vital in Kuwait and UAE where existing infrastructure and fuel subsidies offset higher energy intensity. Vapor-compression units persist on offshore platforms that prize compactness over cost. Nanofiltration, ultrafiltration, and microfiltration increasingly serve as pretreatment buffers that extend RO membrane life by up to 35% in turbid waters such as the Yangtze Delta. Component partnerships dominate procurement strategy: membrane suppliers license chemistry to regional fabricators, while energy-recovery OEMs sign performance-based contracts indexed to kWh/m³ metrics, embedding devices into competitor plants.

By Application:
Industrial Segment Accelerates on Compliance PressureMunicipal held 77.85% of the desalination system market size in 2025, anchored by megacity investments from Singapore to Los Angeles. Singapore’s PUB sourced 30% of national demand from five plants in 2025 and is building a sixth for 137,000 m³ /day by 2027. Cape Town awarded a 300,000 m³ /day concession in 2024 after its 2018 water crisis. The desalination system market size for municipal projects grows steadily as climate-induced droughts intensify.
Industrial demand is the fastest-growing slice, expanding at a 10.28% CAGR as manufacturers internalize water risk. TSMC’s Fab 18 integrated a 50,000 m³ /day RO facility that recycles 92% of process water. Pfizer’s Kalamazoo expansion added a 15,000 m³ /day EDR line delivering 0.1 µS/cm ultrapure output. Data centers in Arizona use 8,000 m³ /day of desalinated groundwater for cooling, lowering municipal draws by 35%. Mining companies in Chile and Australia pipe coastal RO water 50 km inland, meeting corporate pledges to cut freshwater extraction 30% by 2030. Industrial appetite positions the segment as the primary volume driver through 2031.
Geography Analysis
MEA Desalination System Market
The Middle-East and Africa commanded 52.70% of the desalination system market share in 2025 and is projected to grow at a 10.46% CAGR to 2031, buoyed by Saudi Arabia’s USD 200 billion National Water Strategy and Egypt’s Suez Canal corridor build-out. ACWA Power’s 2.4 million m³ /day Yanbu plant, scheduled for 2028 at USD 0.42 /m³ tariff, illustrates economies of scale. UAE’s Taweelah complex reached 909,000 m³ /day in 2025 and plans another 200,000 m³ /day by 2027. Algeria’s ADE financed 450,000 m³ /day through the African Development Bank, underscoring MDB-sovereign collaboration.
APAC Desalination System Market
In Asia-Pacific, India cleared five projects totaling 600,000 m³ /day in Gujarat alone during 2025 to meet zero-discharge mandates for electronics hubs. China’s Tianjin complex scales to 500,000 m³ /day by 2026 to backstop groundwater deficits in the North China Plain. Japan invests USD 450 million in volcanic-heat MED pilots across Okinawa and Kyushu. The desalination system market size in Asia-Pacific benefits from industrial clusters tethered to coastal corridors.
The Americas and Europe Desalination System Market
North America and Europe move cautiously under stricter environmental scrutiny. California’s Huntington Beach plant gained conditional clearance in 2025 after a USD 120 million marine-habitat package. Spain’s 200,000 m³ /day Almería plant embeds zero-liquid-discharge brine concentrators. South America’s growth centers on Chile’s mining belt, where 400,000 m³ /day of incremental capacity cuts Andean aquifer withdrawals 30% by 2031. Brazil’s Fortaleza feasibility study targets 150,000 m³ /day by 2028 to hedge multi-year droughts.

Value Chain Analysis
The value chain begins with raw materials and consumables, including polyamide membrane chemistry, fiberglass pressure vessels, pumps, valves, and instrumentation, and it moves into pretreatment and process chemicals such as coagulants, antiscalants, biocides, and cleaning agents that influence uptime and specific energy. Technology suppliers including DuPont and Toray (membranes) and Energy Recovery Inc. (pressure-exchange devices, protected by a large patent portfolio) capture outsized value because their components largely determine kWh/m3 and replacement cycles, while thermal OEMs (MSF/MED) remain relevant in markets with legacy infrastructure and cogeneration economics.
On the downstream side, EPC and system integrators bundle intake and outfall engineering, civil works, and commissioning into turnkey delivery, but margins face pressure from competitive bidding for municipal mega-projects under IWP/PPP frameworks. Long-term operations and maintenance, membrane replacement programs, and performance-linked service contracts form the main annuity pools, particularly where availability-based tariffs are in place. Delivery and operations also rely on specialist niches such as fouling control, corrosion-resistant materials, and brine management, which become more consequential as discharge limits tighten and as high-recovery RO designs increase scaling risk.
Competitive Landscape
The top five EPC contractors controlled roughly 53% of global contract value in 2025, placing the desalination system market at a moderate concentration level. Yet technology vendors wield pricing power through patented membranes and pressure-exchanger devices that define plant efficiency. ACWA Power operates 78% of its portfolio under 25-year IWPs with availability-based tariffs, reducing exposure to commodity energy swings[2]ACWA Power, “2024 Annual Report,” acwapower.com . Veolia licenses modular RO skids to emerging-market utilities, collecting annuity-style revenue from membrane replacements.
Hybrid inland systems remain a white-space segment. Fluence’s NIROBOX snagged 12 contracts across Latin American lithium projects and Australian cattle stations during 2024-2025. Nanostone Water’s capacitive deionization pilots in California treat ag-drainage water at 30% lower energy intensity than RO. Energy Recovery Inc. protects its 187-patent pressure-exchange moat, sustaining gross margins above 60% and forcing rivals to license technology.
Desalination System Industry Leaders
Veolia
Doosan Enerbility
Toray Industries, Inc.
IDE Technologies
ACCIONA
- *Disclaimer: Major Players sorted in no particular order
Desalination System Market Companies Covered in this Report
- ACCIONA
- Aquatech
- Biwater Holdings Limited
- Doosan Enerbility
- DuPont
- Energy Recovery Inc.
- Fisia Italimpianti
- Fluence Corporation Limited
- IDE Technologies
- Kanadevia Corporation
- Metito Utilities
- Ocean Oasis
- Toray Industries, Inc.
- Veolia
- Wabag
- Xylem

Market Opportunities and Future Outlook
Active municipal and industrial project pipelines continue to support whitespace for high-recovery RO designs, brackish groundwater desalination, and modular systems that can reduce construction time and help de-risk permitting. In June 2026, the Water Replenishment District of Southern California broke ground on the USD 166.5 million Torrance Groundwater Desalter Expansion Project, reinforcing continued investment in inland and brackish RO capacity as a drought-resilience tool. In the Middle East, procurement through IWP/PPP structures is moving forward, including Kuwait awarding a USD 372 million contract (June 2026) for the 60 MIGD Doha SWRO plant (Stage II), and Etihad Water and Electricity signing an EPC agreement (May 2026) for the 60 MIGD Fujairah I IWP, which underscores the contracting scale for SWRO packages, intake and outfall engineering, and long-duration O&M.
Technology and services opportunities are tied to lifecycle cost reduction under tighter environmental constraints, particularly advanced pretreatment and monitoring to reduce fouling-driven downtime, energy-recovery integration to keep specific energy near leading benchmarks, and brine-management solutions that meet discharge requirements in sensitive coastlines. Programs such as the National Alliance for Water Innovation (NAWI) point to modular and electrified desalination systems with reduced dependence on chemical resupply, supporting more autonomous containerized solutions for remote industrial users, including mining, data centers, and hydrogen-linked developments. As operators pursue higher recovery ratios, demand increases for specialty dosing, cleaning regimes, and membrane upgrades that help protect performance within brine and intake constraints.
Recent Industry Developments in Desalination System Market
- June 2026: IDE Technologies was selected by the Nueces River Authority to develop the Harbor Island seawater desalination facility in South Texas, designed for 100 MGD. The award signals continued scaling of large SWRO projects in North America and expands the addressable market for long-term O&M and membrane and energy-recovery retrofits tied to performance guarantees.
- April 2026: IDE Technologies and US Desalination LLC announced the formation of RGV-Desal, LLC, a joint venture to develop a 50 MGD marine desalination facility for the Texas Rio Grande Valley. The structure highlights how developers use partnership models to combine development, delivery, and operating capabilities, which can shorten procurement cycles for utilities seeking new supply sources.
- September 2025: Researchers at the Indian Institute of Science (IISc) reported a siphon-powered thermal desalination approach using a composite siphon (fabric wick and grooved metal surface) to sustain flow and limit salt crystallization. The work supports continued R&D into lower-complexity desalination configurations, creating a pathway for niche deployments where grid power and maintenance resources are constrained.


Desalination System Market Report Scope and Research Methodology
Market Definition and Coverage
This market is defined as the revenues generated from systems and equipment used to remove salts and dissolved solids from seawater or brackish water to produce usable water for municipal and industrial uses.
Scope exclusions: We exclude downstream distribution networks and general wastewater treatment that does not involve desalination.
Segments Covered in This Report
- By Technology of Separation
- Membrane Technology
- Electrodialysis (ED)
- Electrodialysis Reversal (EDR)
- Reverse Osmosis (RO)
- Other Membrane Technologies (Nanofiltration, Ultrafiltration, Microfiltration)
- Thermal Technology
- Multi-stage Flash Distillation (MSF)
- Multi-effect Distillation (MED)
- Vapor Compression Distillation
- Membrane Technology
- By Application
- Municipal
- Industrial
- By Geography
- Asia-Pacific
- China
- India
- Japan
- Rest of Asia-Pacific
- North America
- United States
- Canada
- Mexico
- Europe
- Germany
- United Kingdom
- Spain
- Rest of Europe
- South America
- Brazil
- Chile
- Rest of South America
- Middle-East and Africa
- Saudi Arabia
- United Arab Emirates
- Algeria
- Egypt
- Rest of Middle-East and Africa
- Asia-Pacific
Data Sources, Market Sizing, and Validation
Desk Research
Desk work started with anchoring the demand context for desalination using public water stress and supply indicators, then mapping technology and project signals into a consistent value view. Sources used for this include, such as, UN Water publications, World Bank water datasets, FAO AQUASTAT, IEA water and energy notes, and USGS water data, which help validate where capacity additions are most likely to occur.
To translate these signals into market inputs, we also reviewed customs and trade statistics for relevant equipment categories, publicly available tender portals, permitting and environmental disclosures, and press releases from project owners and EPCs. When company disclosures were available, we used annual reports and investor presentations to sanity check revenue mix and regional exposure, and we used a paid subscription for company financials and news selectively to reduce gaps in privately held coverage. The sources listed here are illustrative only, and many other public documents and datasets were also referenced for collection, validation, and clarification.
Primary Interviews and Surveys
Primary work focused on confirming what gets counted as a desalination system sale versus adjacent water treatment equipment, and validating the pace of new project awards and upgrades. We spoke with a mix of technology suppliers, project contractors, operators, and large water buyers across key demand regions. Their input helped us pressure test secondary assumptions and narrow down pricing and utilization ranges.
Distribution of primary research fieldwork respondents
| Company type | Respondent position | Region |
|---|---|---|
| Top tier: 34% | CXOs: 14% | APAC: 41% |
| Mid tier: 52% | Functional/Unit leaders: 32% | EMEA: 36% |
| Smaller Players: 14% | Managers: 54% | Americas: 23% |
Market-Sizing & Forecasting
Sizing was built using a top-down approach where installed desalination capacity additions and project pipeline signals were reconstructed by region, and then converted to value using technology mix and typical system pricing ranges. Those totals were then checked using selective bottom-up approximations, such as sampling announced plant capacities, applying observed price per cubic meter per day ranges, and cross-checking with supplier revenue exposure to desalination.
A few practical inputs carried the model, such as new awarded capacity (m3/day), the split between seawater and brackish intake, reverse osmosis versus thermal share, energy cost sensitivity in large plants, and retrofit versus newbuild share. When project-level information was incomplete, gaps were handled by using region-specific averages derived from comparable plants and then adjusted based on interview feedback. Forecasting relied mainly on scenario analysis guided by policy-backed water security plans, expected municipal demand growth, industrial water reuse pressure, and the timing of major tenders. Scenario weights were refined through expert consensus from primary calls.
Data Validation & Update Cycle
Outputs were triangulated against independent signals like announced desalination capacity additions, tender activity, and regional desalinated water demand trends, then reviewed for outliers in pricing and implied cost per unit capacity. Where unusual jumps appeared, assumptions were rechecked and respondents were re-contacted to confirm whether the driver was a one-time megaproject, a technology mix shift, or a timing issue.
Before sign-off, the model goes through multi-step analyst review so unit conversions, currency treatment, and input ranges are consistent across regions. Reports are refreshed annually, and interim updates are triggered when material events occur (for example, large award announcements or sharp energy price moves). A final pre-delivery pass is completed so clients receive the most current view available.
Mordor Intelligence's Desalination System Market Size Compared With Other Published Estimates
Different published market sizes for desalination systems often diverge because the cutoffs around what counts as system revenue, the year used for currency translation, and the timing of price updates are not the same. On top of that, some estimates lean more on long-range pipeline optimism, while others stick to near-term awarded projects and observable commissioning timelines.
In our work, the biggest gap drivers are usually how membrane and thermal equipment bundles are priced, whether aftermarket services and plant upgrades are included, and how multi-year EPC contracts are recognized across the project cycle. More recent refreshes also matter because price per unit capacity shifts with energy costs, membrane replacement cycles, and regional procurement patterns, which is why the currency timing and ASP update checks are handled tightly in Mordor Intelligence.
Benchmark comparison
| Source | Market Size | Gaps in Research Methodology |
|---|---|---|
| Mordor Intelligence | USD 19.61 B (2026) | |
| Industry Research Publisher A | USD 28.54 B (2025) | Uses an earlier base year and a broader system boundary that can fold in pumps and adjacent equipment, which lifts the total when priced as full plant packages. |
| Industry Research Publisher B | USD 28.00 B (2025) | Longer forecast horizon framing and a different base year can amplify the assumed project pipeline conversion, and pricing may reflect blended multi-year contract values rather than delivered system revenue. |
Taken together, the spread is mainly explained by scope edges and timing choices, not by a disagreement on where desalination demand is rising. By keeping pricing logic tied to observable capacity additions and by applying consistent year-based currency conversion, the estimate stays traceable to clear inputs that can be rechecked as new projects get awarded.


Key Questions Answered in the Report
How large will global desalination capacity become by 2031?
Installed capacity underpinning the desalination system market is projected to support USD 29.92 billion in annual revenues by 2031, reflecting an 8.82% CAGR from 2026 to 2031.
Which technology will dominate new plant orders over the next five years?
Membrane-based reverse osmosis is expected to remain predominant, expanding at a 10.55% CAGR as energy-recovery devices push specific consumption toward 2 kWh /m³.
Why are industrial users accelerating adoption?
Semiconductor, pharmaceutical, data-center, and mining operators must meet zero-liquid-discharge or high-recycle mandates, driving the industrial application segment at a 10.28% CAGR through 2031.
How sensitive are project economics to energy prices?
Energy comprises up to 50% of RO operating costs; a sustained USD 10 per-barrel oil increase can add USD 0.08-0.12 /m³ to levelized water cost, threatening subsidy-dependent plants.
Page last updated on:


 Your data is secure and never sold or shared.


