
Tubular Membrane Market Size and Share
Market Overview
| Study Period | 2020 - 2031 |
|---|---|
| Market Size (2026) | USD 1.5 Billion |
| Market Size (2031) | USD 1.94 Billion |
| Growth Rate (2026 - 2031) | 5.31 % |
| Fastest Growing Market | Asia Pacific |
| Largest Market | Asia Pacific |
| Market Concentration | Medium |
Major Players *Disclaimer: Major Players sorted in no particular order Image © Mordor Intelligence. Reuse requires attribution under CC BY 4.0. | |
Tubular Membrane Market Analysis by Mordor Intelligence
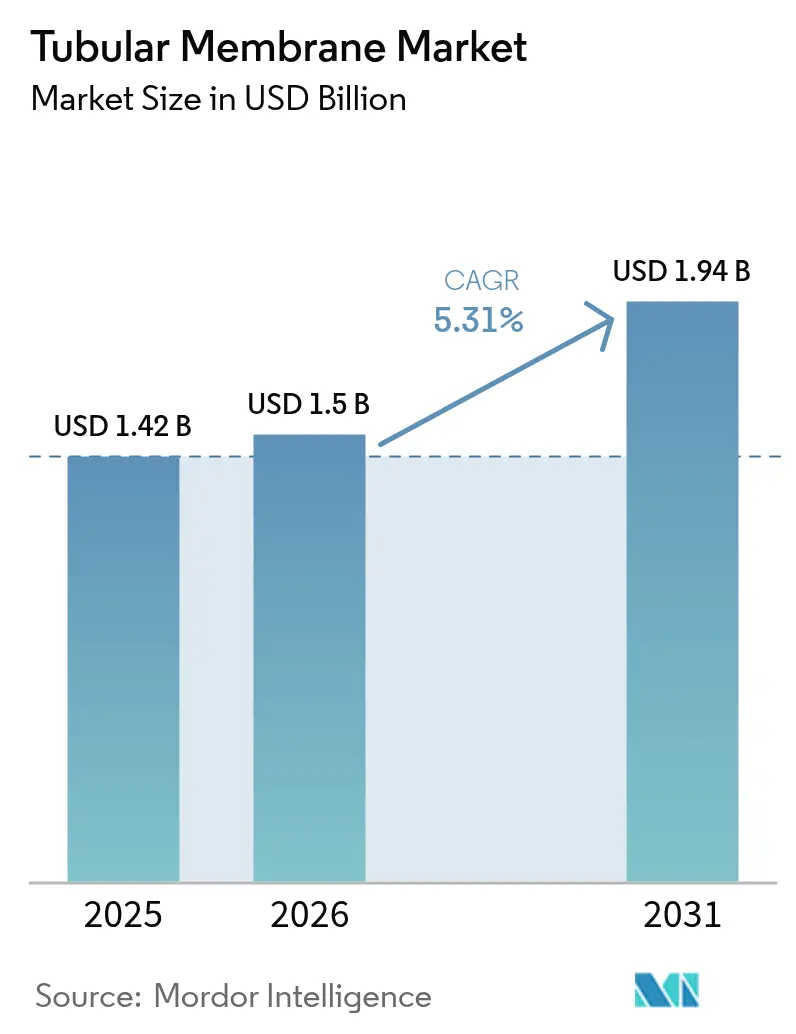
Tubular Membrane Market size in 2026 is estimated at USD 1.5 billion, growing from 2025 value of USD 1.42 billion with 2031 projections showing USD 1.94 billion, growing at 5.31% CAGR over 2026-2031. A convergence of stricter discharge rules, rising industrial water-recycling targets and the proven resilience of tubular designs under high-solids loading drives near-term demand. Municipal utilities account for the largest installed base because membrane bioreactors (MBRs) combine biological treatment and microfiltration in one compact train, helping utilities meet emerging potable-reuse regulations while optimizing energy use. Industrial operators, led by the chemical and petrochemical sectors, are upgrading legacy plants to comply with tougher chemical oxygen demand (COD) and emerging contaminant limits, a trend reinforced by the technology’s strong fouling resistance in oily, saline and abrasive streams. Material science advances—especially nanocomposite PVDF and rapidly maturing ceramic modules—reduce lifecycle costs and widen the operating envelope, while forward-osmosis pilots reveal a pathway toward low-pressure, resource-recovery schemes. At the same time, global equipment suppliers accelerate merger activity to gain scale, geographic reach and integrated services capabilities that de-risk adoption for end users.
Key Report Takeaways
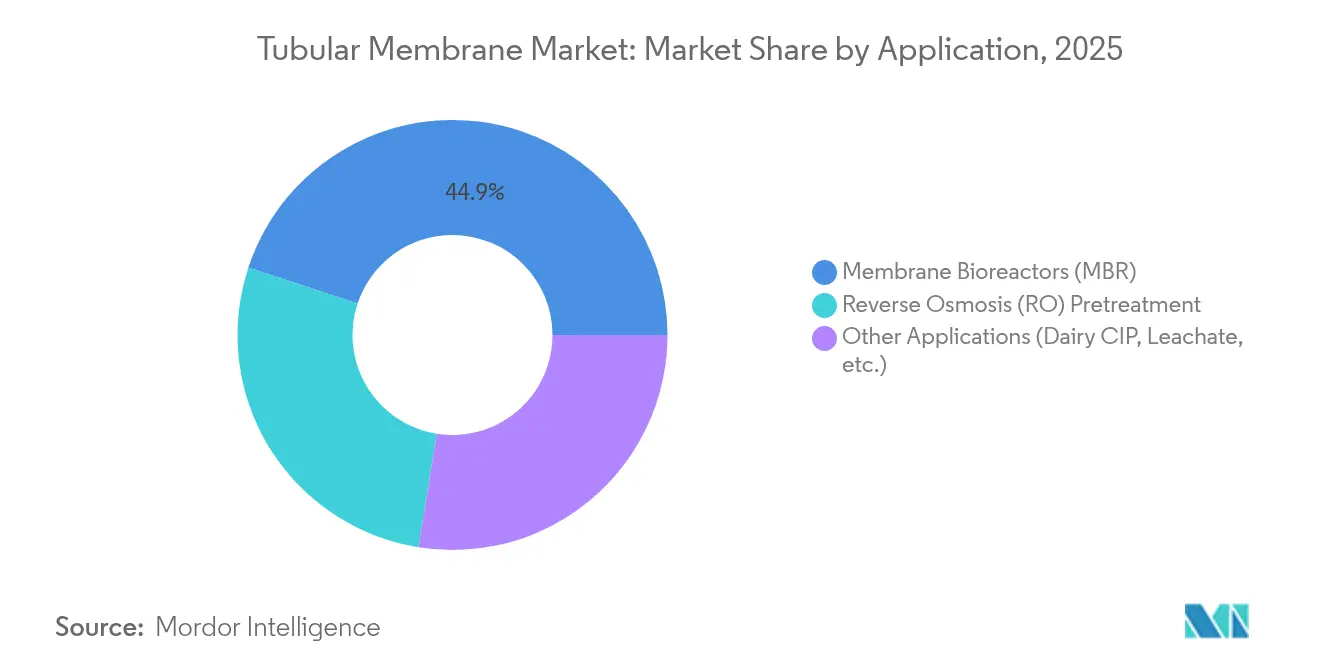
- By application, membrane bioreactors held 44.92% of the tubular membrane market share in 2025, whereas reverse-osmosis pretreatment is projected to advance at a 5.82% CAGR through 2031.
- By membrane material, PVDF modules accounted for 50.35% of the tubular membrane market size in 2025 and ceramic units are poised to expand at a 5.69% CAGR between 2026-2031.
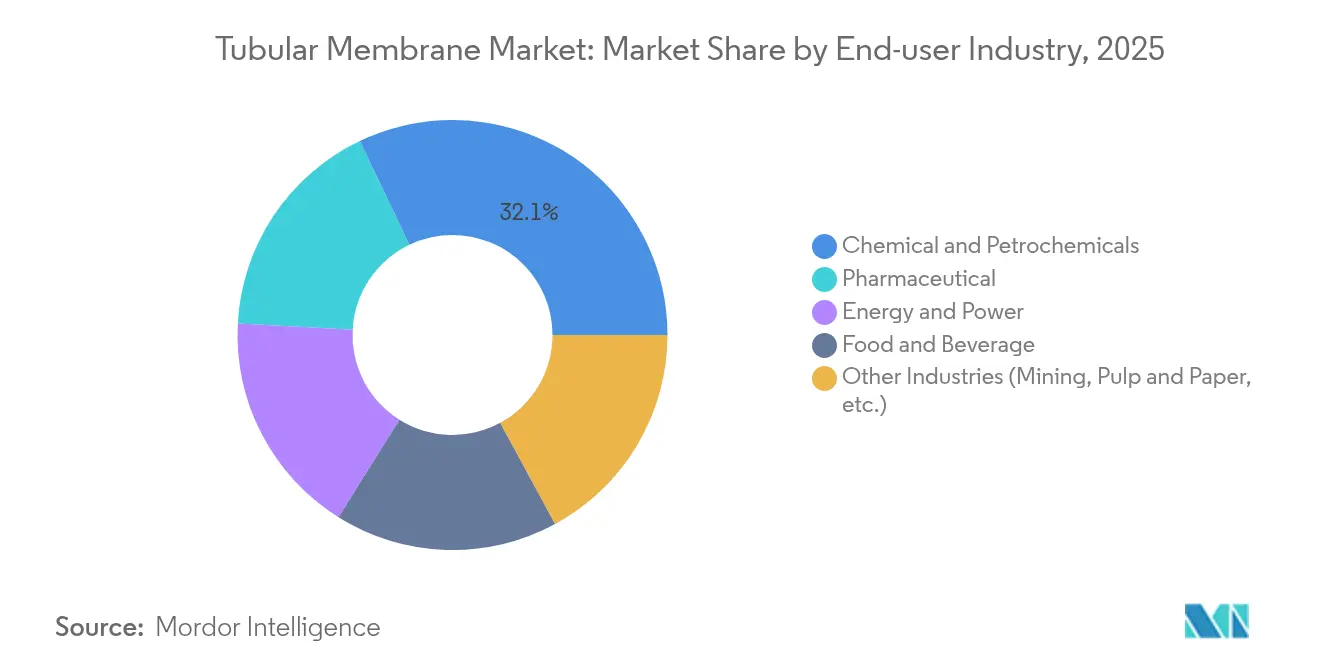
- By end-user industry, chemical and petrochemical plants captured 32.10% of the tubular membrane market size in 2025, while pharmaceutical facilities are forecast to grow fastest at a 5.78% CAGR to 2031.
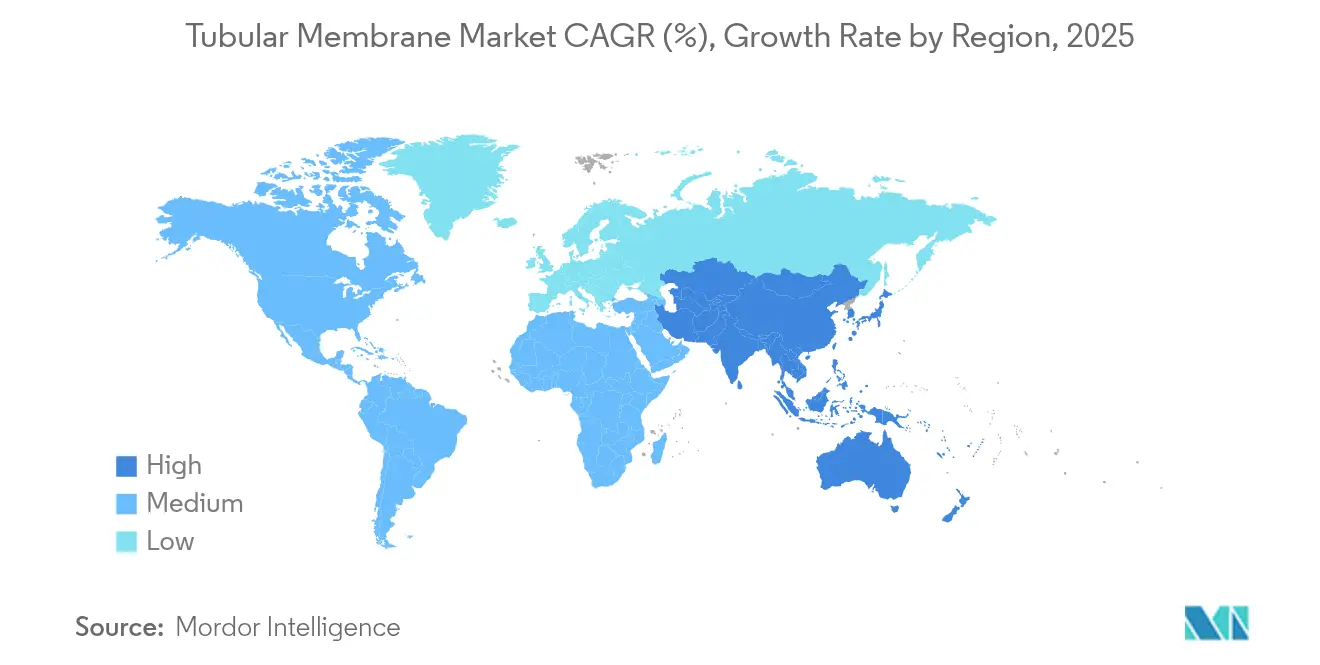
- By geography, Asia-Pacific commanded 42.60% of the tubular membrane market share in 2025, outpacing all regions with a 5.72% CAGR forecast to 2031.
Note: Market size and forecast figures in this report are generated using Mordor Intelligence’s proprietary estimation framework, updated with the latest available data and insights as of 2026.
Market Trends and Insights
Drivers Impact Analysis of Tubular Membrane Market*
| Driver | (~) % Impact on CAGR Forecast | Geographic Relevance | Impact Timeline |
|---|---|---|---|
| Rising adoption of membrane bioreactors | +1.2% | APAC, North America, Europe | Medium term (2-4 years) |
| Industrial demand for high-strength treatment | +0.9% | APAC core; spill-over to MEA and Latin America | Long term (≥ 4 years) |
| Stricter global discharge and reuse regulations | +0.8% | EU and North America most stringent | Short term (≤ 2 years) |
| Tubular forward-osmosis, low-energy modules | +0.4% | North America and EU; early APAC adoption | Long term (≥ 4 years) |
| Biomimetic aquaporin-based separations | +0.3% | North America and EU | Long term (≥ 4 years) |
| Source: Mordor Intelligence | |||
Rising Adoption of Membrane Bioreactors
Cities increasingly view MBRs as a dual answer to regulatory compliance and potable-reuse ambitions. California’s net-energy-positive staged anaerobic fluidized bed-MBR at Silicon Valley Clean Water cuts biosolids production by 90% and demonstrates energy self-sufficiency, anchoring procurement decisions among U.S. utilities. Similar pilots in Singapore, Beijing and Milan validate robust pathogen removal under high mixed-liquor suspended solids, underpinning global uptake. The compact footprint eases siting in dense metros, while high solids tolerance allows treatment plants to intensify capacity without land expansion. Consequently, capital programs in North America and East Asia now incorporate tubular MBRs as default for new works or major retrofits, reinforcing growth in the tubular membrane market.
Industrial Demand for High-Strength Effluent Treatment
Chemical facilities moving toward circular-water strategies favor tubular membranes because they withstand solvent spikes, high salinity and abrasive particulates better than flat-sheet or hollow-fiber analogs. Recent 20 g/L-salinity MBR trials reported 97% COD abatement and near-complete BOD removal, validating performance in brine and produced-water settings[1]MDPI, “High-Salinity MBR Performance,” mdpi.com. Pharmaceutical formulators shifting to continuous processing generate concentrated wastes that demand mechanically robust modules capable of 24/7 operation at elevated trans-membrane pressures. In mining, ceramic tubular units deliver long runtimes in acid mine drainage service, cutting chemical dosing and downtime. These industrial use cases collectively fuel incremental consumption within the tubular membrane market.
Stricter Global Discharge and Water-Reuse Regulations
Policy tightening is immediate. The EU’s Regulation 2020/741 sets recycled-water quality thresholds and signals future vertical reuse mandates. India’s draft Liquid Waste Management Rules compel zero-liquid-discharge technology adoption by October 2025, effectively mandating advanced membranes for major water-using industries. Japan’s 2025 PFAS cap of 50 ng/L triggers industrial retrofits to meet new ambient standards. The U.S. EPA is finalizing effluent limitation guidelines that tighten nutrient and micro-pollutant thresholds through 2030 EPA.GOV. Tubular systems, proven to deliver sub-ppm effluent under variable loading, emerge as reliable compliance solutions, strengthening adoption across the tubular membrane market.
Tubular Forward-Osmosis Modules Enable Low-Energy Concentration
Forward-osmosis (FO) arrangements using thin-film nanocomposite active layers reach 24.5 L/m²·h flux with minimal reverse solute leakage, shaving energy use by up to 50% versus reverse osmosis in high-salinity concentration duty. Tubular housings simplify cleaning and handle higher suspended solids than spiral-wound FO designs, broadening applicability to food-waste valorization, lithium brine concentration and refinery blow-down minimization. Early adopters in North America pilot hybrid FO-MBR flowsheets that combine energy savings with organics recovery, a trend expected to migrate into mainstream projects over the decade.
Restraints Impact Analysis of Tubular Membrane Market*
| Restraint | (~) % Impact on CAGR Forecast | Geographic Relevance | Impact Timeline |
|---|---|---|---|
| Competition from hollow-fiber and flat-sheet types | –0.7% | Global; strongest in cost-sensitive projects | Medium term (2-4 years) |
| High CAPEX for small and decentralized facilities | –0.5% | Emerging markets and rural applications worldwide | Long term (≥ 4 years) |
| PVDF restrictions linked to PFAS legislation | –0.4% | EU and North America; potential global knock-on | Short term (≤ 2 years) |
| Source: Mordor Intelligence | |||
Competition from Hollow-Fiber, Flat-Sheet and Other Alternatives
Hollow-fiber MBRs deliver higher packing density and lower installed costs per square meter, steering price-sensitive municipal tenders toward these designs in regions with ample land. Flat-sheet cassettes provide easy access for visual inspection, a key benefit for operators lacking advanced maintenance tooling. Graphene-oxide laminates boasting 6–66 L cm-² MPa-¹ water permeability threaten to leapfrog all polymeric systems on energy performance[2]Nature, “Graphene-Oxide Membranes for High-Flux Filtration,” nature.com. Meanwhile, photocatalytic self-cleaning coatings under development could narrow the fouling-resistance advantage historically enjoyed by tubular modules. These headwinds temper adoption in segments where high-solids resilience is not critical.
High CAPEX for Small and Decentralized Facilities
Thicker walls, specialty connectors and rugged housings make tubular units more expensive on a per-volume basis than hollow fibers, limiting feasibility in rural municipalities or mobile emergency units. Ceramic tubes in particular carry premium front-end costs even though they offer long service life. Portable recycling systems such as Japan’s WOTA BOX reclaim more than 98% of waste water at lower upfront budgets, underscoring the price gap facing tubular suppliers. Limited access to skilled technicians in remote settings raises the cost barrier further, prolonging payback periods and impeding penetration into the lowest-income regions of the tubular membrane market.
*Our forecasts treat driver/restraint impacts as directional, not additive. The impact forecasts reflect baseline growth, mix effects, and variable interactions.
Tubular Membrane Market Segment Analysis
By Application:
MBR Systems Drive Market LeadershipMembrane bioreactors controlled 44.92% of the tubular membrane market in 2025, underpinned by their capacity to treat high mixed-liquor concentrations without secondary clarification. This dominance reflects the integration benefits of merging biological oxidation with physical separation, lowering overall plant footprints and enabling fast retrofits within existing clarifier basins. The segment leverages modular skid layouts that simplify expansion as flows rise, a consideration for utilities facing population growth and industrial-park hookups. Energy intensity continues to decline as fine-bubble aeration and intermittent operation routines gain traction, further cementing the business case for MBR installations across the tubular membrane market.
Reverse-osmosis pretreatment, while smaller, is projected to post a 5.82% CAGR to 2031 as desalination operators adopt multi-barrier flowsheets to protect high-pressure RO stages from fouling. Tubular membranes’ ability to handle turbid feed waters laced with oil, grease and biopolymers that overwhelm micro-sand filters positions them as a resilient first-stage screen. Dairy clean-in-place recovery, leachate polishing and landfill condensate management remain niche but steady outlets, benefitting from the tubes’ mechanical strength and ease of chemical cleaning. Together, these diversified applications broaden revenue streams and mitigate cyclicality within the tubular membrane market.



By Membrane Material:
PVDF Dominance Faces Regulatory ChallengesPolyvinylidene fluoride maintained 50.35% control of the tubular membrane market in 2025 because it offers an advantageous mix of chemical resistance, weldability and mature supply chains. However, the European Chemicals Agency’s planned PFAS restrictions, set to limit PVDF deployment in potable-water systems beginning 2026, spark portfolio reassessments among equipment makers. Some utilities have already shifted specifications toward polyethersulfone and reinforced polypropylene to pre-empt compliance risks.
Ceramic tubes, although more capital intensive, are forecast to rise at a 5.69% CAGR thanks to virtually unlimited pH tolerance and lifetimes exceeding 10 years. Producers exploit economies of scale and 3D-printing methods to drive unit-cost reductions, pulling ceramics into mid-size plant bids where they were once deemed uneconomic. Polytetrafluoroethylene and expanded PTFE membranes occupy niche segments in semiconductor ultrapure washes and aggressive pharma solvents. Nanocomposite PVDF loaded with titanium-dioxide or zinc-oxide nano-fillers enhances anti-fouling characteristics, extending clean-in-place intervals. Emergent biomimetic materials embedding aquaporin proteins promise quantum leaps in flux but remain at prototype stage, leaving the mainstream tubular membrane market anchored to PVDF and ceramic chemistries for most of the outlook period.
By End-User Industry:
Chemical Sector Leads Amid Pharmaceutical GrowthChemical and petrochemical plants represented 32.10% of the tubular membrane market in 2025, reflecting entrenched use in treating solvent-laden effluents, polymerization wash waters and cooling-tower blow-down. Operators appreciate tubes’ tolerance to temperature swings and aggressive acids, traits that reduce downtime relative to thin-film configurations. The sector’s capex cycle aligns with tightening discharge permits and greenhouse-gas-driven water-reuse incentives, sustaining replacement demand.
Pharmaceutical and biotech sites, though smaller in installed capacity, are expected to log a 5.78% CAGR through 2031— the fastest among end users. Continuous manufacturing lines generate highly concentrated streams, and the need for water-for-injection quality drives adoption of tight-pore tubular ultrafiltration and nanofiltration units. Food and beverage processors deploy tubes for whey clarification and sugar deashing, leveraging hygienic welds and predictable clean-in-place protocols. Energy and power producers, especially combined-cycle gas plants, favor tubular ceramic variants for treating high-temperature cooling loops. Mining operators turn to tubes for acid mine drainage neutralization, citing robust acid-resistance and long membrane lifespans. This broadening demand foundation keeps revenue growth resilient across the tubular membrane industry.
Geography Analysis
APAC Tubular Membrane Market
Asia-Pacific dominated the tubular membrane market with 42.60% revenue share in 2025, buoyed by large-scale municipal rollouts in China and India’s zero-liquid-discharge mandates for bulk chemicals and textiles. China’s Yangtze River protection law pushes advanced treatment retrofits at thousands of industrial clusters, while provincial subsidies accelerate capital recovery for MBR retrofits. India’s 2025 reuse targets compel overnight adoption of integrated membrane trains that guarantee consistent permeate below 10 mg/L BOD. Japanese vendors leverage decades of Johkasou decentralized expertise to export containerized tubular packages across Southeast Asia, and South Korean pharma expansions add demand for ultrapure-water systems.
North America Tubular Membrane Market
North America forms the second-largest regional bloc, underpinned by mature replacement cycles and regulatory tightening. The U.S. Infrastructure Investment and Jobs Act allocates billions for lead-service-line replacements and advanced treatment upgrades, and many utilities piggy-back these programs with MBR conversions to meet nutrient caps. Canadian provinces channel climate-resilience funds toward decentralized schemes in indigenous territories, favoring small MBRs and tubular fouling-resistant skids. Mexico’s industrial corridor along the Gulf coast embraces tubular pretreatment to minimize downstream RO fouling at its rapidly expanding petrochemical complexes.
Europe Tubular Membrane Market
Europe faces a pivotal material-compliance shift. PFAS curbs under REACH accelerate ceramic adoption and favor sulfone, polyetherimide and modified PP chemistries in new bids. Germany’s carbon-neutral-water initiative funds pilot hybrid membrane-ozone plants, while Iberia channels drought-mitigation money toward water-reuse schemes anchored by tubular ultrafiltration. Nordic utilities pioneer low-energy FO-MBR hybrids supported by green-hydrogen producers, illustrating how cross-sector integration underpins incremental demand in the regional tubular membrane market.

Regulatory Landscape
Regulation continues to tighten around municipal discharge and water reuse, drawing advanced filtration and MBR upgrades into permit compliance pathways. In the European Union, Directive (EU) 2024/3019 updates urban wastewater treatment requirements with obligations applying from 2027, reinforcing demand for higher-performance treatment trains where membranes are used to meet stricter effluent quality targets.
For industrial users, technology-based standards and best-available-technique frameworks keep membranes on the approved shortlist. The European Commission Implementing Decision (EU) 2016/902 (BAT conclusions for the chemical sector) recognizes membrane bioreactors and microfiltration/ultrafiltration as established techniques for solids separation and nitrogen removal, supporting adoption in chemical and petrochemical effluent upgrades. In the United States, EPA effluent limitation guidelines development and supporting tools such as the Industrial Wastewater Treatment Technology (IWTT) database are used to characterize membrane treatment performance across industrial point source categories (including steam electric), reinforcing membranes as a documented compliance option as limits tighten over the coming years.
Value Chain Analysis
The tubular membrane value chain starts upstream with polymer resins (notably PVDF and PES/PSU) and ceramic feedstocks (e.g., alumina or silicon carbide powders), followed by specialized module manufacturing. Production routes include polymer tube formation and coating, as well as ceramic shaping and sintering (typically about 1,300 to 1,800 degrees C), before assembly into housings with connectors, seals, and supports designed for high-pressure, high-solids operation. With PFAS scrutiny rising, material qualification and documentation for fluorine-containing chemistries has become a more visible step for suppliers serving potable reuse and sensitive industrial applications.
Midstream, OEMs and system integrators package tubes into skids for MBRs, RO pretreatment, and industrial wastewater reuse. Sales flow through direct contracting for large municipal and industrial projects and via distributors for smaller or standardized systems. Lead times tend to concentrate around specialty or custom modules (often cited at roughly 12 to 20 weeks), so dual-sourcing, inventory planning, and aftermarket support matter for EPCs and end users. Downstream, operations and aftermarket services (cleaning, reconditioning, and performance monitoring) are expanding alongside digital optimization of aeration and cleaning cycles, and buyers increasingly procure membranes through multi-year service agreements rather than as one-off component purchases.
Competitive Landscape
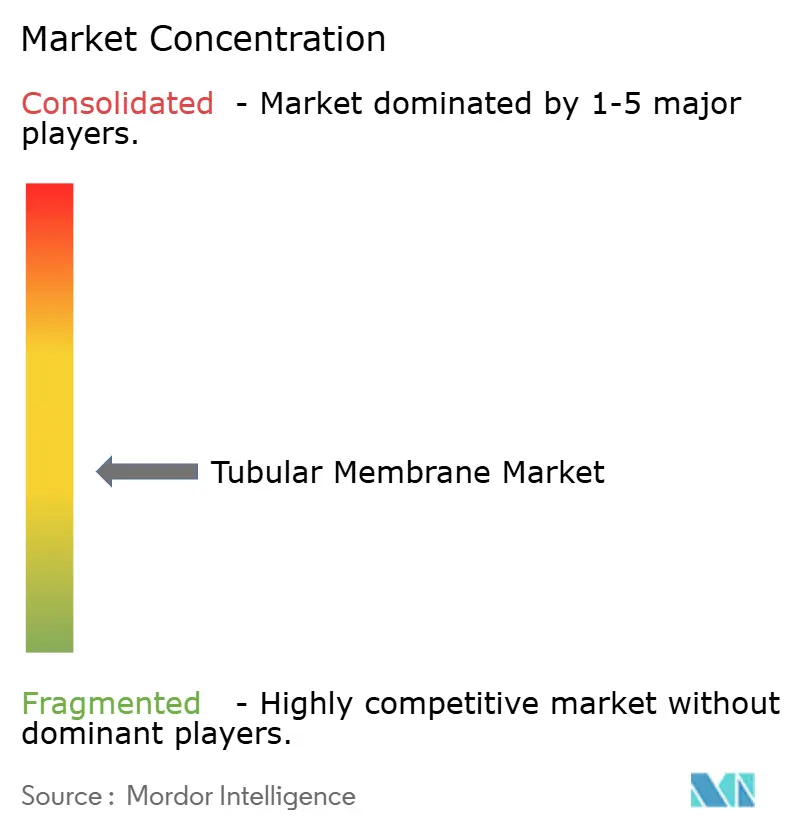
The tubular membrane market remains moderately fragmented; the top five suppliers collectively account for roughly 40% of global installed capacity, leaving regional specialists ample room to thrive. Larger vendors emphasize turnkey project delivery, integrating process design, financing packages and long-term service agreements to lock-in annuity revenue. Veolia’s full acquisition of Water Technologies & Solutions exemplifies this strategy, delivering projected EUR 90 million cost synergies and bolstering its North American manufacturing base.
Product differentiation increasingly hinges on proprietary surface modifications that delay biofouling and on digital twins that optimize air-scour regimes in real time. DuPont’s FilmTec™ LiNE-XD elements, for example, target lithium brine pretreatment and showcase how niche, high-margin applications can defend pricing power. Meanwhile, Asian entrants engage in price-competitive bids, leveraging subsidized finance and low production overheads, particularly for stainless-steel and ceramic housings.
Strategic alliances proliferate. Memsift Innovations partnered with Murugappa Group to commercialize the GOSEP™ chemically resistant tube, combining material know-how with local fabrication and after-sales networks. Several European OEMs license aquaporin channels under co-development agreements, positioning themselves early in a potential materials shift. Consolidation is expected to continue as mid-tier firms lacking global footprints seek exit routes, heightening the importance of R&D depth and service breadth in sustaining share within the tubular membrane industry.
Tubular Membrane Industry Leaders
Kovalus Separation Solutions
Pentair
Porex
PCI Membranes
Berghof Membrane Technology GmbH
- *Disclaimer: Major Players sorted in no particular order
Tubular Membrane Market Companies Covered in this Report
- Applied membranes, inc.
- Berghof Membrane Technology GmbH (BMT)
- Duraflow LLC
- Dynatec Systems Inc.
- Graver Technologies
- Kovalus Separation Solutions
- Kubota Corporation
- Lenntech B.V.
- Memsift Innovations
- PCI Membranes
- Pentair
- Porex
- Sihyflux
- SpinTek
- TORAY INDUSTRIES, INC.

Market Opportunities and Future Outlook
A near-term opportunity is emerging in PFAS-driven material substitution across tubular portfolios and procurement specifications, especially where PVDF faces scrutiny. Pentair X-Flow publicly positioned a transition of its tubular membrane portfolio from PVDF to PFAS-free polyethersulfone (PES) in May 2026, underscoring ongoing product-line re-engineering that can influence replacement cycles and open bids that require PFAS-free declarations. This also creates a clearer opening for sulfone-based and ceramic tubular suppliers in potable reuse, municipal retrofits, and industrial compliance projects, where long-life materials and verified chemical compatibility can reduce lifecycle risk.
Application-specific buildout is also extending beyond conventional municipal wastewater into reuse and high-purity industrial segments. In April 2026, Toray announced the F-HFUG Series ultrafiltration module positioned for wastewater reuse with a 0.005 micrometer nominal pore size and lower-biofouling performance, which aligns with end-user pressure to reduce cleaning frequency and stabilize permeate quality. On the demand side, India-specific electronics and semiconductor water infrastructure is becoming a named investment theme: in June 2026, Kurita Water Industries and Membrane Group India formed Kurita Membrane India to target water and wastewater solutions for semiconductor and electronics manufacturing, supporting pull-through for robust pretreatment and reclamation membranes where tubular configurations compete on durability and cleanability in challenging streams.
Recent Industry Developments in Tubular Membrane Market
- May 2026: Pentair X-Flow announced a transition of its tubular membrane portfolio from PVDF to PFAS-free polyethersulfone (PES). The move directly addresses emerging PFAS constraints in material selection and shifts competitive differentiation toward performance and lifecycle cost in non-fluorinated chemistries for water reuse and industrial wastewater applications.
- June 2025: Kovalus Separation Solutions opened a new Technology Centre in Aachen, Germany, focused on developing customized membrane filtration solutions for municipal and industrial water and wastewater treatment. This strengthens regional application engineering and accelerates project-specific design support, which is critical for tubular deployments in high-solids and variable-load environments.
- June 2024: Kovalus Separation Solutions announced an investment of more than USD 20 million in a new 140,000 sq-ft facility in Mexico to expand spiral membrane production capacity by 50%. The added manufacturing footprint improves supply resilience and lead-time performance for membrane projects that depend on reliable module availability and standardized assembly capacity.


Tubular Membrane Market Report Scope and Research Methodology
Market Definition and Coverage
For this study, the tubular membrane market is counted as revenues generated from tubular-configured membrane modules and elements used to separate, filter, or concentrate fluids in industrial and municipal process streams, across common pressure-driven filtration uses.
Scope exclusions: We exclude broader water treatment plant EPC, pumps, piping, tanks, and general O&M services that are not priced as tubular membrane products.
Segments Covered in This Report
- By Application
- Membrane Bioreactors (MBR)
- Reverse Osmosis (RO) Pretreatment
- Other Applications (Dairy CIP, Leachate, etc.)
- By Membrane Material
- Polyvinylidene Fluoride (PVDF)
- Sulfone-based (Polyether sulfone (PES) / Polysulfone (PSU))
- Polytetrafluoroethylene (PTFE) / Expanded PTFE
- Polypropylene
- Ceramic
- Other Membrane Materials (Polyacrylonitrile (PAN), etc.)
- By End-user Industry
- Food and Beverage
- Chemical and Petrochemicals
- Pharmaceutical
- Energy and Power
- Other Industries (Mining, Pulp and Paper, etc.)
- By Geography
- Asia-Pacific
- China
- Japan
- India
- South Korea
- ASEAN Countries
- Rest of Asia-Pacific
- North America
- United States
- Canada
- Mexico
- Europe
- Germany
- United Kingdom
- France
- Italy
- Spain
- Russia
- NORDIC Countries
- Rest of Europe
- South America
- Brazil
- Argentina
- Rest of South America
- Middle East and Africa
- Saudi Arabia
- South Africa
- Rest of Middle East and Africa
- Asia-Pacific
Data Sources, Market Sizing, and Validation
Desk Research
Desk research was used to set the factual backbone for the model and to avoid building assumptions in a vacuum. We reviewed public water and wastewater statistics, including national environment agency releases and municipal utility disclosures, and then paired those indicators with industrial output signals relevant to heavy users of tubular systems.
On the technical side, information was cross-checked using sources such as the US EPA, Eurostat, UN Comtrade for trade patterns of filtration-related equipment, peer-reviewed journals on membrane performance and fouling behavior, and patent databases for material and module design trends. We also used company filings, investor presentations, and credible industry press to confirm product positioning and application focus, including MBR, RO pretreatment, and other process uses, as well as to track general pricing movement. For certain companies where public disclosure is limited, we referenced a paid subscription for company financials and intelligence to sanity-check scale and regional exposure. These desk sources are illustrative and not exhaustive, and many other public documents were also used for validation and clarification.
Primary Interviews and Surveys
Primary work was done to translate technical adoption into a realistic spending pool, and then to test if the model assumptions matched how projects are specified and purchased. We spoke with stakeholders across module suppliers, system integrators, industrial plant teams, and engineering consultants. The respondent mix was balanced across APAC, EMEA, and the Americas so regional differences in regulation and capex cycles were not averaged out.
Distribution of primary research fieldwork respondents
| Company type | Respondent position | Region |
|---|---|---|
| Top tier: 35% | CXOs: 12% | APAC: 37% |
| Mid tier: 50% | Functional/Unit leaders: 28% | EMEA: 37% |
| Smaller Players: 15% | Managers: 60% | Americas: 26% |
Market-Sizing & Forecasting
Sizing started with a top-down build that reconstructs the addressable demand pool from water and wastewater treatment activity and industrial processing needs, then filters it for cases where tubular configurations are technically preferred. To keep the math explainable, the model uses a limited set of inputs such as wastewater treatment capacity additions and upgrades, MBR and high-solids treatment adoption, industrial capex activity in food and beverage and chemicals, replacement cycles for membrane elements, and average selling price bands by material (polymeric versus ceramic).
After the total pool was formed, we corroborated it with selective bottom-up checks, including sampled ASP times volume by application and channel checks on typical module counts per project type. Where gaps existed in public volume data, ratios were derived from interview feedback and then tested against trade flow direction and company revenue mix disclosures. Forecasting relied on scenario analysis supported by expert consensus on regulatory tightening for effluent quality, industrial reuse targets, and expected pricing movement, and then conservative, base, and higher uptake paths were used before the final forecast was set.
Data Validation & Update Cycle
Model outputs were validated through triangulation across independent signals, including capacity additions, replacement demand logic, and observed adoption by end use. If a country or end use produced an outlier result, the assumptions were rechecked for unit conversion, currency timing, and double counting across applications, and then the data was routed through a second analyst review before sign-off.
The report is refreshed annually, and interim updates are triggered when material events occur, such as regulatory changes, large project announcements, or step-changes in input costs that influence membrane pricing. Before delivery, we complete a fresh pass on key inputs and rerun variance checks so clients receive the latest updated view.
Mordor Intelligence's Tubular Membrane Market Sizing Compared With Other Published Estimates
Published market sizes for tubular membranes often do not match because different studies draw the line around what is being counted, and they also choose different base years, pricing logic, and currency timing. Some figures emphasize only the most visible applications, while others also include adjacent equipment or services that sit around a membrane installation.
A common gap driver is scope expansion into full filtration systems, plant-level spending, or aftermarket services, which lifts the headline number even if membrane element volumes are unchanged. Another driver is how pricing is trended forward, since ceramic and polymeric ASPs can move differently, and not every publisher applies the same replacement-cycle assumptions. Some estimates also do not state how regional adoption was validated, so the same penetration rate can get applied too broadly.
Benchmark comparison
| Source | Market Size | Gaps in Research Methodology |
|---|---|---|
| Mordor Intelligence | USD 1.50 B (2026) | |
| Global Consultancy A | USD 0.98 B (2024) | Uses a different base year and a narrower spending lens that leans on selected applications, so replacement demand and non-water industrial use can be under-represented. |
| Industry Publisher B | USD 0.85 B (2024) | Primarily splits the market by organic versus inorganic and a few applications, which can miss end-use driven adoption differences and price dispersion by material and region. |
The spread in the table is mostly explained by year choice and what gets counted beyond the membrane product itself. Some published figures stop at a smaller application set, and some do not show how replacement cycles and material-based pricing were cross-checked. Mordor Intelligence counts tubular membrane revenue across the stated applications and end-user industries without rolling in broader plant EPC or unrelated service spend, which keeps the result traceable to clear demand and pricing inputs.


Key Questions Answered in the Report
What is the current size of the tubular membrane market?
The tubular membrane market size stood at USD 1.5 billion in 2026.
Which application segment dominates demand?
Membrane bioreactors lead with 44.92% market share because their compact layouts meet stringent municipal effluent standards.
Why are ceramics gaining traction despite higher cost?
Ceramic tubes offer exceptional chemical resistance and decade-long lifespans, making them attractive for harsh industrial effluents facing tighter PFAS and salinity regulations.
How will PFAS legislation affect PVDF modules?
EU REACH proposals targeting PFAS may restrict PVDF use in potable-water projects after 2026, prompting utilities to consider sulfone or ceramic alternatives.
Which region is growing fastest?
Asia-Pacific commands the largest share and the highest forecast CAGR at 5.72% due to China’s industrial policies and India’s imminent zero-liquid-discharge rules.
Page last updated on:


 Your data is secure and never sold or shared.


