Medical Component Manufacturing Market Size and Share
Market Overview
| Study Period | 2020 - 2031 |
|---|---|
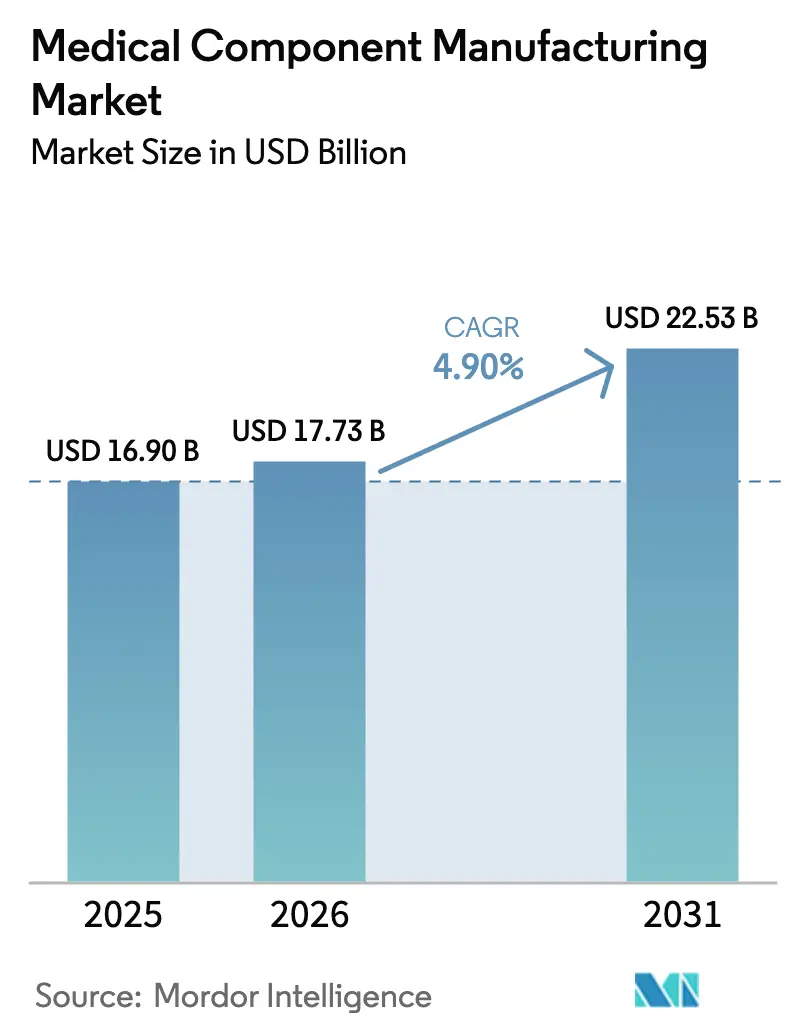
| Market Size (2026) | USD 17.73 Billion |
| Market Size (2031) | USD 22.53 Billion |
| Growth Rate (2026 - 2031) | 4.90% CAGR |
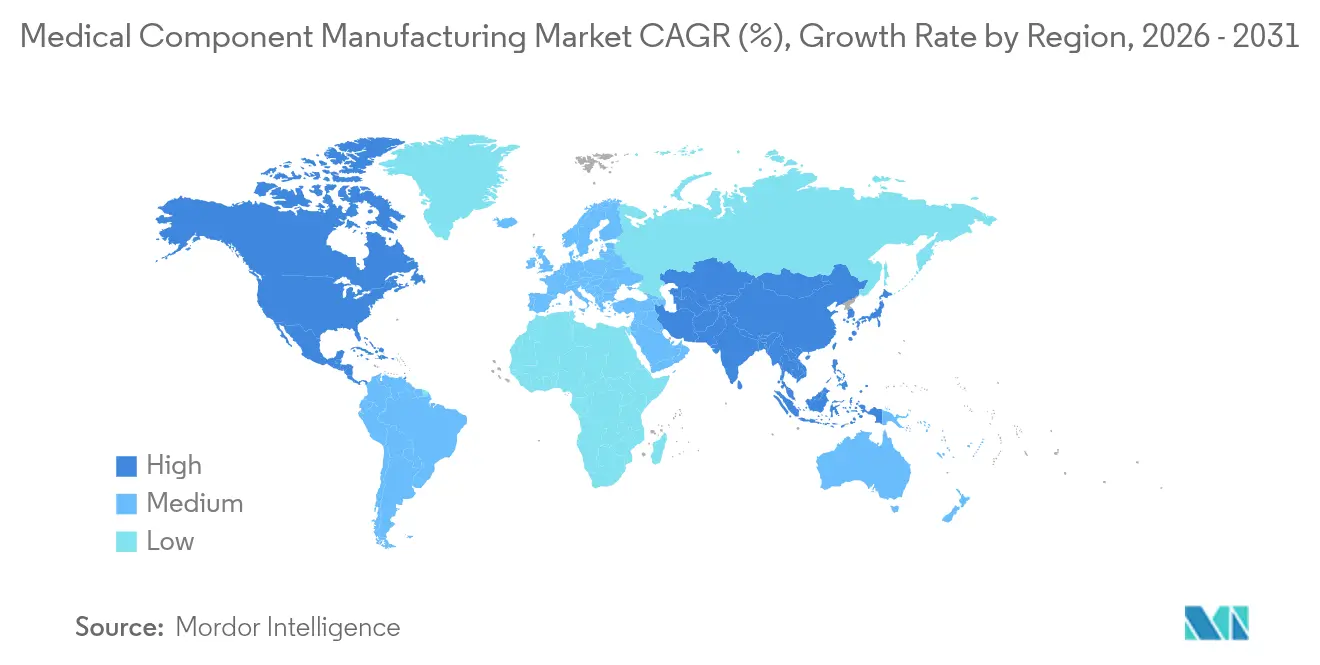
| Fastest Growing Market | Asia Pacific |
| Largest Market | North America |
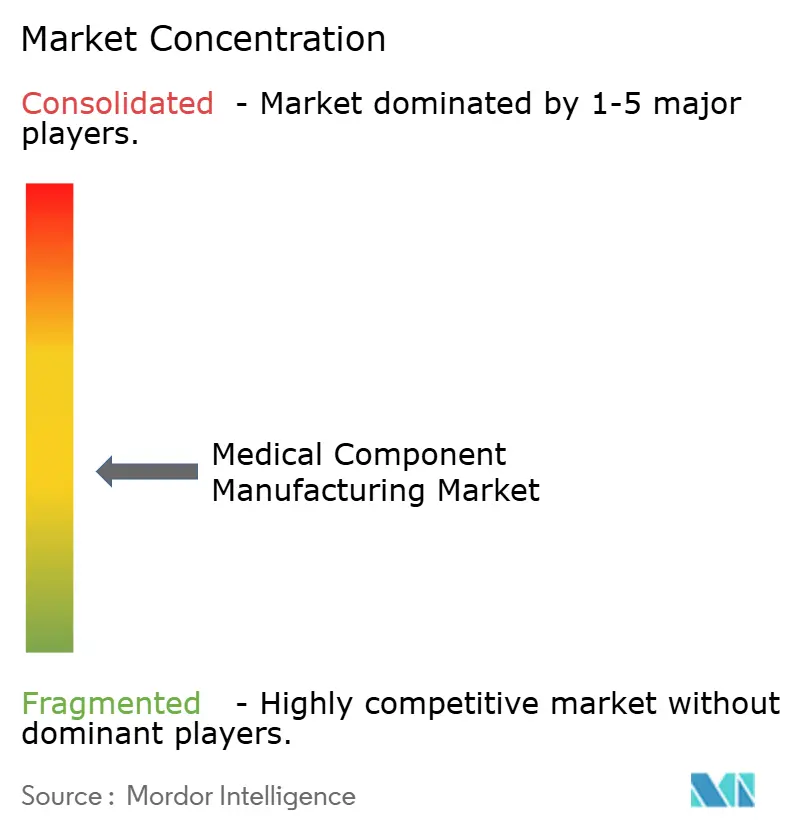
| Market Concentration | Medium |
Major Players *Disclaimer: Major Players sorted in no particular order Image © Mordor Intelligence. Reuse requires attribution under CC BY 4.0. | |
Medical Component Manufacturing Market Analysis by Mordor Intelligence
The medical component manufacturing market size is expected to grow from USD 16.90 billion in 2025 to USD 17.73 billion in 2026 and is forecast to reach USD 22.53 billion by 2031 at 4.90% CAGR over 2026-2031. Growth rests on steady healthcare spending, rapid innovation cycles, and rising demand for precision-engineered components that comply with tightening quality rules. Advances in additive manufacturing, data-driven process control, and smart factory systems are improving yields, cutting waste, and shortening lead times. Larger original-equipment makers (OEMs) are outsourcing more complex work to contract manufacturing organizations (CMOs) that maintain ISO 13485-certified clean-room capacity and advanced multi-axis machining lines. Materials science breakthroughs—especially in high-strength titanium alloys—enable lighter implants that last longer and integrate better with bone, while improved polymer blends support single-use devices that minimize infection risk. Geopolitical shocks and natural disasters continue to test supply chains, but diversified sourcing strategies and localized production nodes have preserved the medical component manufacturing market’s resilience [1]U.S. Census Bureau, “Annual Capital Expenditures Survey,” census.gov.
Key Report Takeaways
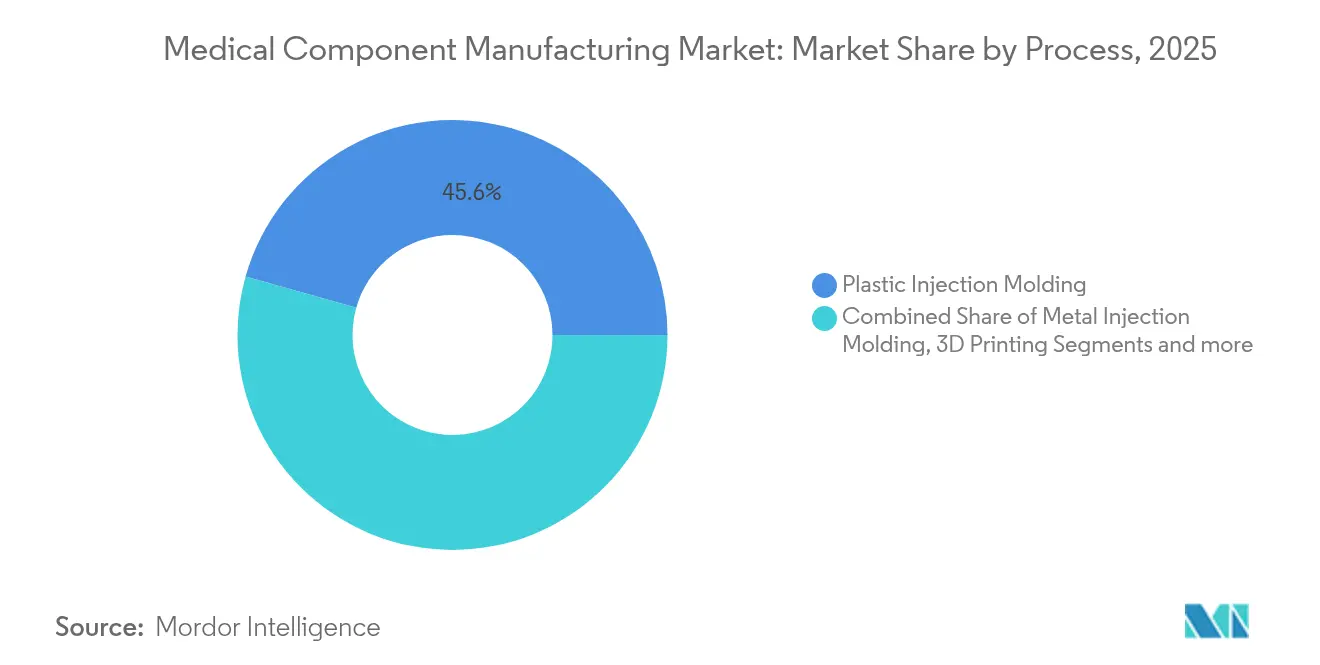
- By process, plastic injection molding led with 45.62% of medical component manufacturing market share in 2025; 3D printing is projected to climb at 5.75% CAGR through 2031.
- By component type, diagnostic parts held 39.25% revenue share in 2025, while surgical components are expected to log the fastest 5.72% CAGR to 2031.
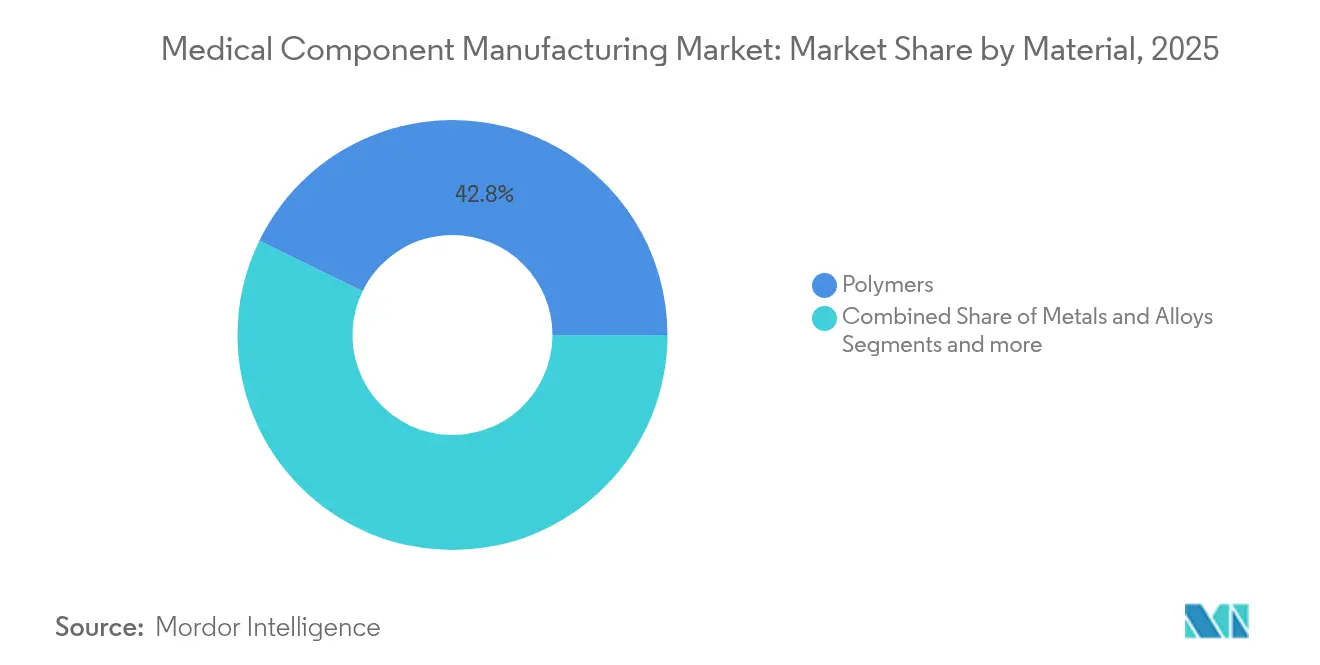
- By material, polymers accounted for 42.78% share of the medical component manufacturing market size in 2025; metals and alloys are set to grow at 5.83% CAGR during the outlook period.
- By application, orthopedic and spine products represented 39.42% of total 2025 revenue, whereas cardiovascular and vascular access items are forecast to expand at a 5.88% CAGR to 2031.
- By geography, North America dominated with 37.88% market share in 2025; Asia-Pacific is anticipated to register the quickest 5.92% CAGR through 2031.
Note: Market size and forecast figures in this report are generated using Mordor Intelligence’s proprietary estimation framework, updated with the latest available data and insights as of 2026.
Global Medical Component Manufacturing Market Trends and Insights
Drivers Impact Analysis*
| Driver | (~) % Impact on CAGR Forecast | Geographic Relevance | Impact Timeline |
|---|---|---|---|
| Rising burden of chronic & lifestyle diseases | +1.2% | Global, with concentration in North America & Europe | Long term (≥ 4 years) |
| Expansion of R&D and rapid tech innovation cycles | +0.9% | North America & EU core, spill-over to APAC | Medium term (2-4 years) |
| OEM shift toward outsourcing complex components | +0.8% | Global, with early gains in APAC manufacturing hubs | Medium term (2-4 years) |
| Global regulatory push for higher device quality & traceability | +0.7% | Global, with EU MDR and FDA QSR driving standards | Long term (≥ 4 years) |
| Demand for infection-control single-use components | +0.6% | Global, with hospital-dense regions prioritizing safety | Short term (≤ 2 years) |
| Industry 4.0 "digital thread" enabling mass-custom micro-batches | +0.5% | North America & EU leading, APAC following | Long term (≥ 4 years) |
| Source: Mordor Intelligence | |||
Rising burden of chronic & lifestyle diseases
Worldwide, cardiovascular disorders affect more than 655 million people, while 537 million live with diabetes as of 2024. Hospitals therefore demand glucose sensors, cardiac rhythm modules, and robust vascular access sets that enable continuous monitoring and outpatient management. Component makers now miniaturize circuits, cut power draw, and embed wireless chips so patients and clinicians can share real-time data. Long-life batteries and biocompatible housings allow wearables to operate safely for months between exchanges. Because most chronic-condition devices require scheduled replacement, the medical component manufacturing market enjoys predictable revenue streams across multi-year treatment plans.
Expansion of R&D and rapid tech innovation cycles
Digital design suites and additive prototyping have reduced development lifecycles from seven years to nearer three [2]MIT Open Learning, “Additive Manufacturing Materials & Design,” openlearning.mit.edu . Engineers iterate on virtual twins, print functional samples overnight, and feed performance data back into generative algorithms that refine geometries without manual redrafting. The FDA breakthrough-device pathway accelerates market entry for components that address unmet clinical needs, rewarding firms that invest in high-risk, high-impact ideas. Companies able to scale from lab to low-volume production using the same 3D-printing platforms capture margins while gathering field evidence that supports wider indications.
OEM shift toward outsourcing complex components
Many brand-name device makers now outsource up to 60% of intricate part production to CMOs with multi-axis CNC, laser welding, and automated assembly capacity. The model frees OEM capital for research and commercialization while giving CMOs steady demand for high-precision runs. Volume transfers are most pronounced in Asia-Pacific, where skilled technicians, competitive labor costs, and expanding regulatory expertise let partners hit price targets without compromising ISO 13485 standards. Regional CMOs often maintain vertically integrated raw-material sourcing and finishing services, shortening lead times and simplifying audit trails.
Global regulatory push for higher device quality & traceability
The FDA Quality Management System Regulation that aligns with ISO 13485, effective February 2026, compels deeper documentation and serial-level traceability [3]U.S. Food and Drug Administration, “Quality Management System Regulation Final Rule,” fda.gov . Europe’s Medical Device Regulation adds post-market surveillance duties and broader unique-device-identifier (UDI) labeling, forcing suppliers to integrate serialization printers and data-capture software into every line. Investments in electronic batch records and real-time statistical-process-control dashboards streamline audit readiness and lower recall risk. Larger firms absorb compliance costs more easily, prompting consolidation as smaller shops exit or merge.
Restraints Impact Analysis*
| Restraint | (~) % Impact on CAGR Forecast | Geographic Relevance | Impact Timeline |
|---|---|---|---|
| High capital cost of advanced manufacturing equipment | -0.8% | Global, with higher impact in emerging markets | Medium term (2-4 years) |
| Volatile polymer & metal prices disrupting margins | -0.6% | Global, with manufacturing-intensive regions most affected | Short term (≤ 2 years) |
| Escalating compliance burden across multi-region audits | -0.5% | Global, with EU MDR and FDA QSR creating highest burden | Medium term (2-4 years) |
| Sustainability pressure on legacy plastics & PFAS use | -0.4% | North America & EU leading, global adoption following | Long term (≥ 4 years) |
| Source: Mordor Intelligence | |||
High capital cost of advanced manufacturing equipment
Five-axis CNC mills often cost USD 500,000–USD 2 million each, while ISO 7 clean-room construction can exceed USD 10 million per line. Robotic pick-and-place cells, vision systems, and in-line metrology add another USD 1 million–USD 5 million, pushing breakeven points further out when interest rates rise. Smaller firms struggle to secure financing, nudging the industry toward larger players that can spread depreciation over broader order books. Continuous tech refresh cycles compound the burden because obsolescence arrives faster when software and sensor suites advance every two to three years.
Volatile polymer & metal prices disrupting margins
Medical-grade polycarbonate and polyethylene prices swung 15–25% in 2024 on energy-cost shocks, while nickel-based stainless steel surcharges fluctuated in step with geopolitical unrest. Titanium alloys used in hip and knee implants rose 20–30% as aerospace programs booked future capacity. CMOs locked into multi-year agreements absorb spikes rather than pass them to OEM customers focused on value-based procurement. To hedge risk, many manufacturers carry extra inventory, tying up working capital and enlarging exposure when spot rates retreat.
*Our forecasts treat driver/restraint impacts as directional, not additive. The impact forecasts reflect baseline growth, mix effects, and variable interactions.
Segment Analysis
By Process: Hybrid additive pathways raise efficiency
Plastic injection molding held 45.62% of the medical component manufacturing market in 2025, favored for cost-effective, high-volume runs of tubing hubs, syringe bodies, and device housings. However, 3D printing posted a 5.75% CAGR and is capturing applications that benefit from internal lattice structures, bespoke geometries, and shorter production windows. The medical component manufacturing market size for additive processes is expanding as selective-laser-sintered titanium parts gain FDA clearances for spinal cages and cranial plates. At the same time, tool-less polymer printers allow rapid bridge production while steel molds are still in fabrication. CMOs now integrate co-molding and post-print machining, producing hybrid assemblies where a printed lattice core mates with a molded over-shell. This convergence balances unit-cost economics with functional performance and speeds validation runs because only the additively manufactured subsection undergoes design changes.
Regulators have responded with guidance on powder reuse limits and lot-to-lot traceability, reducing uncertainty and enabling larger orders. Leading service bureaus embed real-time melt-pool monitoring and AI-driven defect prediction, letting them certify near-net-shape implants without extensive destructive testing. As printer build-volume increases and per-layer rates quicken, the medical component manufacturing market expects additive workflows to move beyond niche orthopedics into mid-volume cardiovascular and neurovascular devices.


By Component Type: Operating-room precision drives growth
Diagnostic parts such as glucose meter electrodes, imaging collimators, and microfluidic cartridges accounted for 39.25% of 2025 revenue owing to chronic disease screening programs. Yet surgical components are tracking a 5.72% CAGR as hospitals adopt robotic systems and minimally invasive techniques that require high-precision, single-use tools.
The medical component manufacturing market share for reusable laparoscopic instruments is stable, but growth stems from disposable trocars, staple cartridges, and energy-delivery tips that safeguard against cross-contamination. CMOs leverage multi-axis lathes to maintain sub-10-micron tolerances on shaft assemblies, while vision-system inspections verify edge integrity. Digital integration—such as RFID tags molded into handles—feeds usage data back to inventory systems, reducing operating theatre delays. Manufacturers also co-develop custom tool sets with robotics firms to ensure instrument kinematics match wrist-action profiles. Because surgical systems bundle instruments with service contracts, hospitals accept higher per-case costs in exchange for shorter procedures and fewer complications. This alignment sustains above-average margins across the surgical segment.
By Material: Metallic implants gain acceptance
Polymers retained 42.78% of 2025 revenue due to their versatility in fluid-management disposables and wearable sensors. Metals and alloys, however, are set to grow at 5.83% CAGR as titanium, cobalt-chrome, and specialty stainless steels support load-bearing applications.
The medical component manufacturing market size for titanium alloys rises as surgeons seek lightweight hips that imitate bone elasticity and resist corrosion. Grade 23 (Ti-6Al-4V ELI) now anchors spinal rods and maxillofacial plates, while nitinol stents exploit super-elastic properties to conform to vessel walls. Hybrid metal-polymer catheter shafts marry torque response with kink resistance, extending device reach into peripheral vessels.
Powder-bed-fused cobalt-chrome crowns enable same-day dental restoration, illustrating how additive techniques unlock material performance without subtractive waste. Meanwhile, supply-chain initiatives focus on recycling off-cuts and reclaiming support material to cut carbon footprints. Forward-looking CMOs investigate magnesium alloys that resorb after tissue healing, aiming to eliminate removal procedures and reduce total care costs.
By Application: Cardiology products outpace overall market
Orthopedic and spine devices represented 39.42% of 2025 spending, driven by active lifestyles and longer life expectancy. Cardiovascular and vascular access components, though, will deliver the fastest 5.88% CAGR through 2031 as interventional cardiology shifts further toward catheter-based repairs.
The medical component manufacturing market share assigned to drug-eluting stents is rising thanks to thinner struts that improve healing. Drug-coated balloons require micro-porous polymer films that release antiproliferative agents evenly, a feat achieved via precise extrusion and plasma-coating lines. Structural-heart interventions create demand for nitinol frames with complex nitrocellulose sealing skirts, produced via laser-cut tubing followed by shape-setting heat cycles.
Remote hemodynamic monitoring systems blend MEMS pressure sensors with hermetically sealed housings, enabling outpatient heart-failure surveillance. CMOs that pair sensor die-attachment expertise with low-void soldering capture business from OEMs expanding digital therapeutic portfolios. These breakthroughs push device ASPs upward, amplifying revenue even if unit volumes grow at single-digit rates.
Geography Analysis
North America accounted for 37.88% of 2025 revenue because of its dense network of OEM design centers, established FDA pathways, and sustained hospital capital budgets. Many CMOs added contiguous sterile-packaging suites to shorten distribution cycles for U.S. customers. States such as Minnesota and Massachusetts fund workforce up-skilling to keep pace with robot-ready production lines, while reshoring grants support new facility builds in Ohio and Texas. Cloud-linked production dashboards let domestic managers audit suppliers remotely, improving compliance efficiency.
Asia-Pacific recorded the steadiest acceleration at 5.92% CAGR and will likely approach one-third of global output by 2031. Vietnam, Malaysia, and Thailand court investments with tax holidays and rapid customs clearance, while Singapore offers automatic IR-stamp duty relief on additive manufacturing imports. Chinese CMOs pair domestic raw-material smelters with vertically integrated finishing lines, closing the loop on supply-chain risk. Regional regulators harmonize dossier formats under the ASEAN Medical Device Directive, sparing exporters multiple translations and duplicated stability studies. Growing middle-class demand for implants fuels local adoption, ensuring installed capacity serves domestic and export channels alike.
Europe retains strong engineering credentials, with Germany specializing in high-precision machining and Italy leading catheter extrusion. The consolidated Medical Device Regulation framework raises cost barriers, prompting smaller machine shops to affiliate with notified-body-approved consortiums that share quality resources. Sustainability mandates drive producers to switch to renewable energy tariffs and pilot closed-loop polymer recycling. Post-Brexit, UK firms now manage dual conformity schemes, but mutual-recognition discussions aim to ease duplicate audits. Overall, Europe’s moderate growth rests on replacing legacy implants in aging populations and upgrading hospital inventories to single-use surgical tools that pass strict infection-control protocols.

Competitive Landscape
The sector remains moderately fragmented, with market leaders seldom exceeding 5% global share in any one sub-category. Top CMOs extend vertically from raw-material procurement to sterile packaging, offering OEM clients single-invoice convenience. Mid-tier specialists carve niches in neurovascular coils, ophthalmic lenses, or high-volume lancet caps, competing on process know-how rather than scale. Contract signings increasingly bundle design-for-manufacture assistance and regulatory dossier preparation to shorten time-to-clinic.
Automation defines the current competitive race. Firms outfitted with vision-guided robots achieve near-zero defect rates and repeatability below 3 microns, satisfying Class III implant tolerances. Machine-learning algorithms digest SPC data across shifts, triggering proactive tool changes that guard against drift. Early adopters of closed-loop systems report 20% lower scrap and 15% higher OEE, widening cost gaps over manual rivals. Patent filings for powder-bed fusion scan strategies and micro-molding process windows grew 15% in 2024, underlining persistent innovation focus.
Strategic moves illustrate consolidation. Teleflex agreed to acquire BIOTRONIK’s vascular unit for EUR 760 million in July 2025, positioning itself strongly in drug-coated balloon catheters. In April 2024, Haemonetics bought Attune Medical, gaining the ensoETM esophageal cooling system for cardiac ablation support. Medtronic secured exclusive U.S. rights to the Neuroguard IEP combined carotid stent and filter in January 2025, broadening its neuro-endovascular portfolio. NAMSA and Terumo launched a regulatory-services partnership in October 2024, illustrating OEM reliance on expert CROs for faster approvals. Such deals underscore the premium placed on technology access, channel reach, and clinical evidence.
Medical Component Manufacturing Industry Leaders
SeaskyMedical
Heraeus Group
3D Systems, Inc.
Jabil Inc.
TE Connectivity
- *Disclaimer: Major Players sorted in no particular order

Recent Industry Developments
- July 2025: Teleflex completed acquisition of BIOTRONIK’s Vascular Intervention business for EUR 760 million (USD 825 million).
- January 2025: Medtronic entered an exclusive U.S. distribution agreement with Contego Medical for the Neuroguard IEP System, reporting zero major strokes in trials.
- October 2024: NAMSA and Terumo announced a strategic outsourcing partnership to accelerate regulatory approvals for Terumo’s pipeline.
- April 2024: Haemonetics Corporation acquired Attune Medical and its ensoETM esophageal cooling device used in more than 50,000 cardiac procedures.


Global Medical Component Manufacturing Market Report Scope
The report's scope covers medical component manufacturing, which comprises various sectors ranging from diagnostic and surgical devices to therapeutic devices such as cardiovascular and diabetes care. Every industry is responsible for manufacturing equipment, tools, and devices vital to healthcare.
The medical component manufacturing market is segmented into process, component type, and geography. By process, the market is segmented into plastic injection molding, metal injection molding, ceramic injection molding, 3D printing, forging, and others. The other processes include nanotechnology, investment casting, and many more. The market is segmented by component type into diagnostic, therapeutic, surgical, and others. The other components include consumables and accessories. By geography, the market is segmented into North America, Europe, Asia-Pacific, the Middle East and Africa, and South America. The report also offers the market size and forecasts for 17 countries across the region. The market sizing and forecasts are made for each segment based on value (USD).
| Plastic Injection Molding |
| Metal Injection Molding |
| Ceramic Injection Molding |
| 3D Printing |
| Forging |
| Extrusion |
| Others |
| Diagnostic Components |
| Therapeutic Components |
| Surgical Components |
| Others |
| Polymers |
| Metals and Alloys |
| Ceramics & Glass |
| Others |
| Orthopedic and Spine |
| Cardiovascular and Vascular Access |
| Neurology |
| Others |
| North America | United States |
| Canada | |
| Mexico | |
| Europe | Germany |
| United Kingdom | |
| France | |
| Italy | |
| Spain | |
| Rest of Europe | |
| Asia-Pacific | China |
| Japan | |
| India | |
| Australia | |
| South Korea | |
| Rest of Asia-Pacific | |
| Middle East and Africa | GCC |
| South Africa | |
| Rest of Middle East and Africa | |
| South America | Brazil |
| Argentina | |
| Rest of South America |
| By Process | Plastic Injection Molding | |
| Metal Injection Molding | ||
| Ceramic Injection Molding | ||
| 3D Printing | ||
| Forging | ||
| Extrusion | ||
| Others | ||
| By Component Type | Diagnostic Components | |
| Therapeutic Components | ||
| Surgical Components | ||
| Others | ||
| By Material | Polymers | |
| Metals and Alloys | ||
| Ceramics & Glass | ||
| Others | ||
| By Application | Orthopedic and Spine | |
| Cardiovascular and Vascular Access | ||
| Neurology | ||
| Others | ||
| By Geography | North America | United States |
| Canada | ||
| Mexico | ||
| Europe | Germany | |
| United Kingdom | ||
| France | ||
| Italy | ||
| Spain | ||
| Rest of Europe | ||
| Asia-Pacific | China | |
| Japan | ||
| India | ||
| Australia | ||
| South Korea | ||
| Rest of Asia-Pacific | ||
| Middle East and Africa | GCC | |
| South Africa | ||
| Rest of Middle East and Africa | ||
| South America | Brazil | |
| Argentina | ||
| Rest of South America | ||


Key Questions Answered in the Report
What is the current medical component manufacturing market size?
The market reached USD 17.73 billion in 2026 and is projected to hit USD 22.53 billion by 2031.
Which process segment is growing the fastest?
3D printing is expanding at a 5.75% CAGR thanks to demand for patient-specific implants and rapid prototyping.
Why are metals gaining share in component materials?
Titanium and specialty stainless steels offer superior biocompatibility and mechanical strength, driving a 5.83% CAGR for metal components.
Which region shows the highest growth outlook?
Asia-Pacific leads with a projected 5.92% CAGR due to cost-competitive manufacturing and rising healthcare access.
What are the main restraints on market growth?
High capital costs for advanced equipment and volatile raw-material prices pressure margins and slow capacity expansion.
Page last updated on:


