Market Overview
| Study Period | 2019 - 2031 |
|---|---|
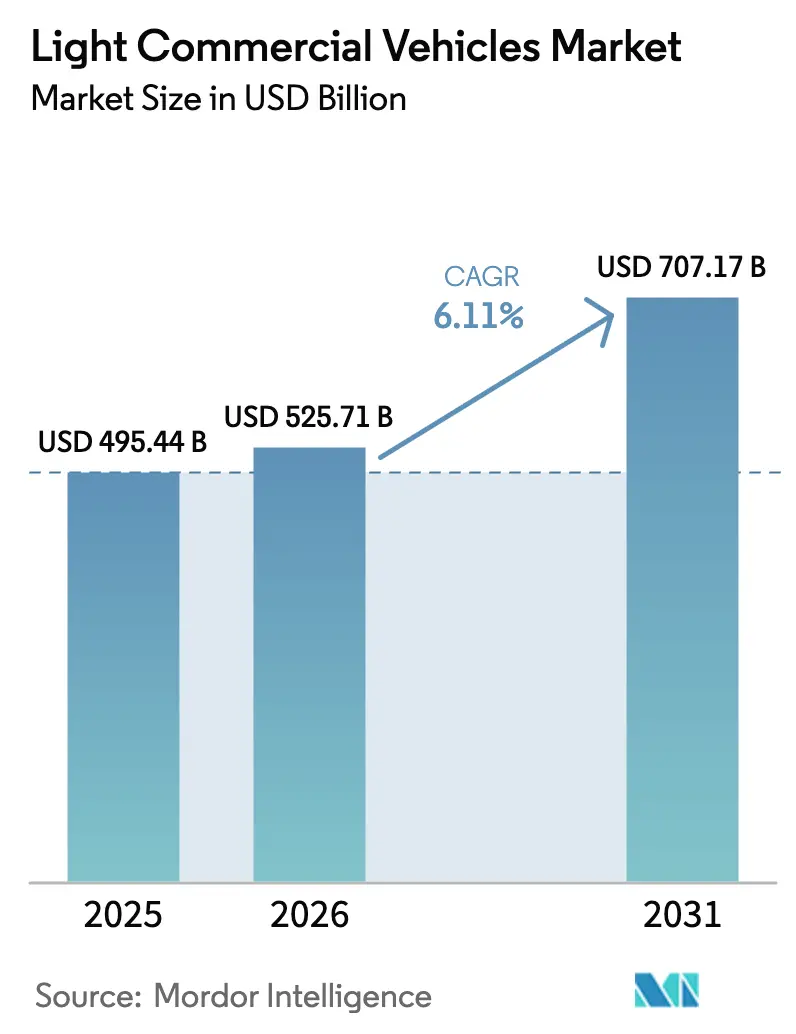
| Market Size (2026) | USD 525.71 Billion |
| Market Size (2031) | USD 707.17 Billion |
| Growth Rate (2026 - 2031) | 6.11% CAGR |
| Fastest Growing Market | Asia Pacific |
| Largest Market | Asia Pacific |
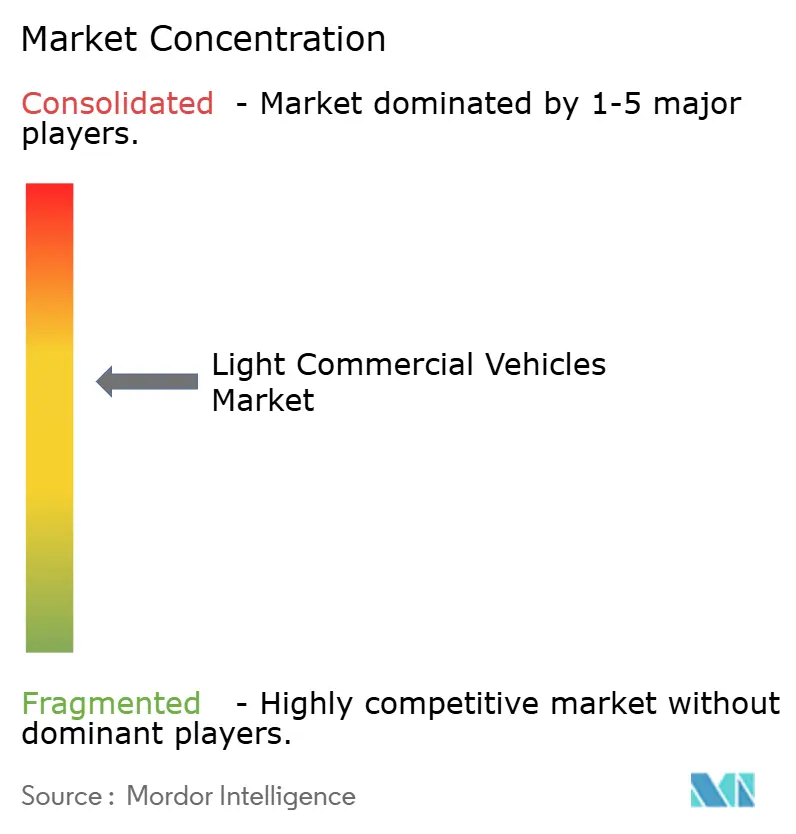
| Market Concentration | Medium |
Major Players*Disclaimer: Major Players sorted in no particular order Image © Mordor Intelligence. Reuse requires attribution under CC BY 4.0. | |
Light Commercial Vehicles Market Analysis by Mordor Intelligence
The light commercial vehicles market size is expected to grow from USD 495.44 billion in 2025 to USD 525.71 billion in 2026 and is forecast to reach USD 707.17 billion by 2031 at a 6.11% CAGR over 2026–2031. In developed economies, e-commerce orders now represent a significant portion of retail sales. This shift has led parcel and grocery operators to phase out their old diesel fleets. Instead, they're opting for specialized vans and pickups that comply with stringent urban access regulations. In Europe, the push is further fueled by the upcoming implementation of stricter real-world NOx limits. Meanwhile, in the U.S., recent legislative measures are significantly reducing the cost gap for electric vans. Battery costs are on a rapid decline, with projections indicating further reductions in the near future. This trend is narrowing the cost disparity between electric and traditional internal-combustion drivetrains. As Chinese players like BYD ramp up overseas production, competition intensifies. At the same time, established players are consolidating platforms to safeguard their foothold in the light commercial vehicle market.
Key Report Takeaways
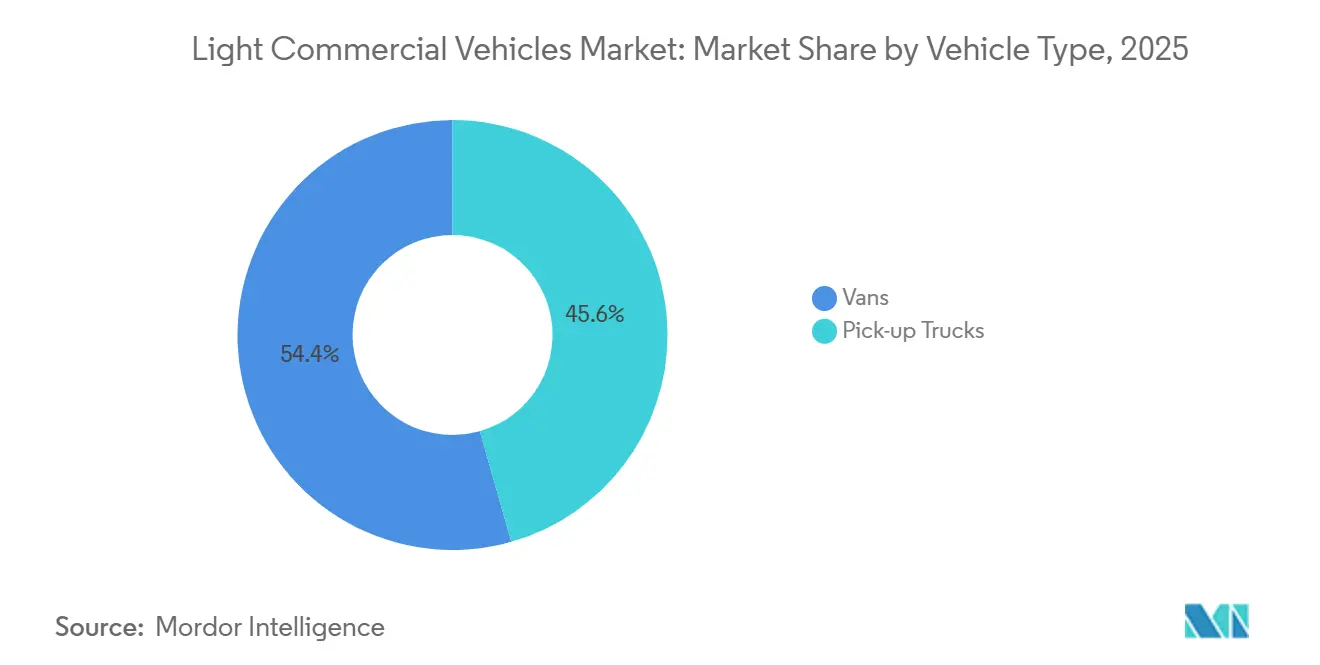
- By vehicle type, pick-up trucks controlled 45.57% of the light commercial vehicle market share in 2025, whereas vans are set to expand at a 6.15% CAGR through 2031.
- By propulsion, internal-combustion units held 77.81% share in 2025, but electric variants show the highest 6.22% CAGR to 2031.
- By application, commercial delivery accounted for 57.81% of the light commercial vehicle market size in 2025 and advances at a 6.16% CAGR.
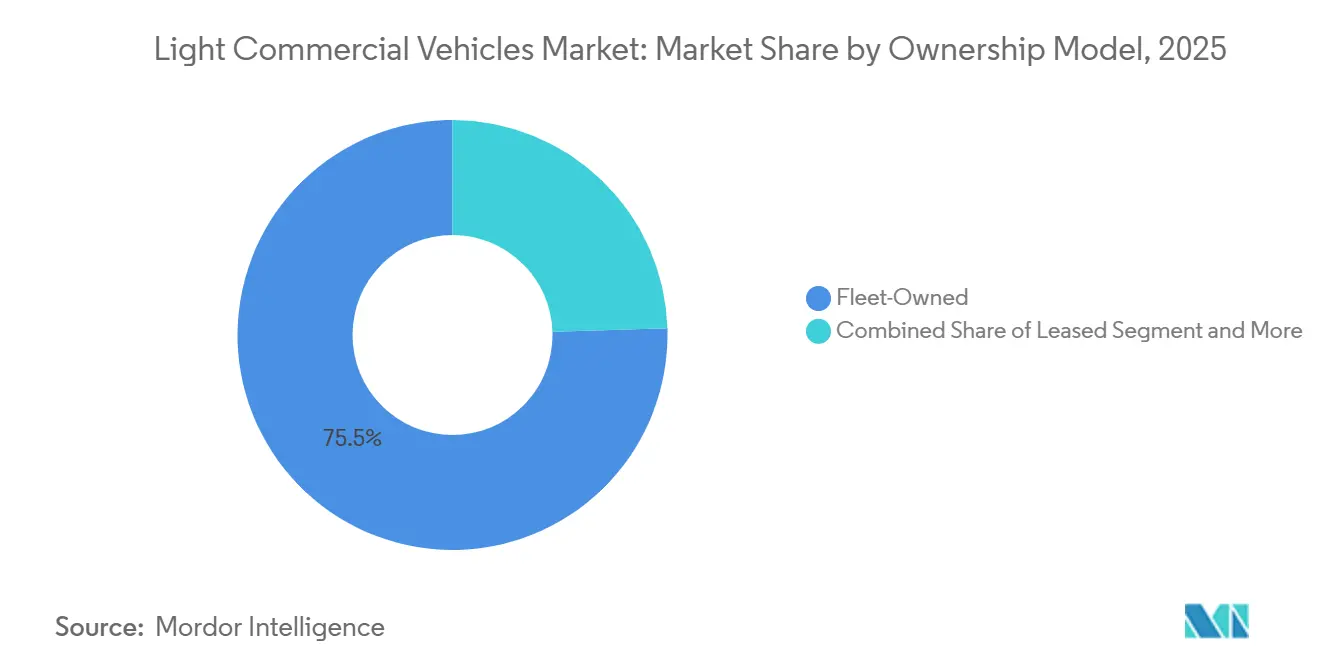
- By ownership model, fleet-owned assets represented a 75.53% share in 2025, while subscription grew at a 6.26% CAGR through 2031.
- By payload class, 2.6–3.5-ton vehicles captured 68.83% share in 2025; sub-2.5-ton models record the fastest 6.28% CAGR.
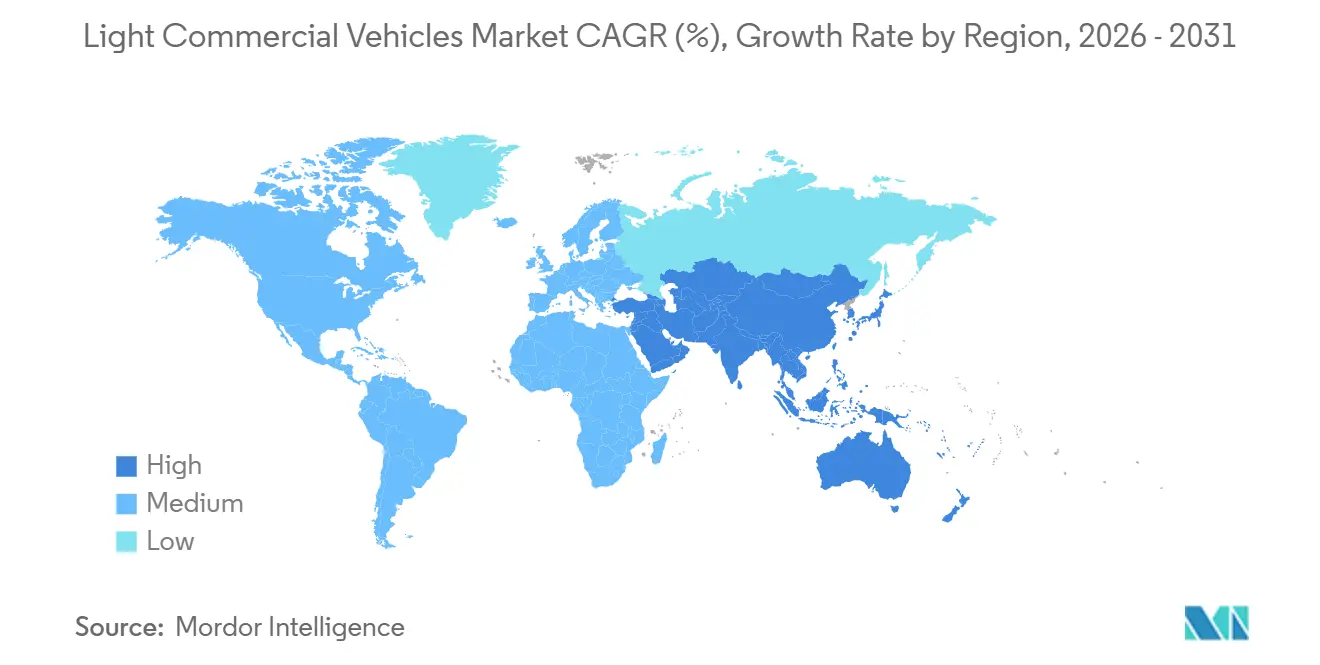
- By geography, Asia Pacific held 38.62% of the light commercial vehicle market in 2025 and maintains a 6.18% CAGR to 2031.
Note: Market size and forecast figures in this report are generated using Mordor Intelligence’s proprietary estimation framework, updated with the latest available data and insights as of January 2026.
Global Light Commercial Vehicles Market Trends and Insights
Drivers Impact Analysis*
| Driver | (~) % Impact on CAGR Forecast | Geographic Relevance | Impact Timeline |
|---|---|---|---|
| Stringent Global CO₂ & NOx Standards | +1.2% | Europe (Euro 7), North America (EPA Clean Truck Rule), China (China VI), India (Bharat Stage VI) | Medium term (2-4 years) |
| Exploding Last-Mile E-Commerce Demand | +0.9% | Global, with concentration in North America, Europe, China, and urban India | Short term (≤ 2 years) |
| Rapid Battery-Cost Decline | +0.8% | Global, with early adoption in China, Europe, and North America | Medium term (2-4 years) |
| Fleet Telematics Lowering TCO | +0.6% | North America, Europe, and Asia Pacific commercial hubs | Long term (≥ 4 years) |
| Modular Upfitting Ecosystems Shortening Delivery Lead-Time | +0.5% | North America and Europe, with emerging adoption in Asia Pacific | Medium term (2-4 years) |
| Subscription-Based VaaS Models | +0.4% | North America and Europe, pilot programs in Asia Pacific | Long term (≥ 4 years) |
| Source: Mordor Intelligence | |||


Stringent Global CO₂ & NOx Standards with Fiscal Incentives
Starting mid-2025, Euro 7 mandates a significant reduction in real-world NOx emissions, requiring levels much lower than the previous Euro 6d-TEMP standards. This change is expected to substantially increase diesel after-treatment costs, thereby reducing the price difference between diesel vehicles and battery-electric vans [1]“Euro 7: New Emission Norms for Cars, Vans, and Trucks,” European Commission, presscorner.ec.europa.eu . In China, the dual-credit system encourages manufacturers by offering additional credits for each zero-emission light commercial vehicle sold, driving an increase in new-energy vehicle production. The EPA's Phase 3 greenhouse-gas rule, applicable to future model years, sets ambitious CO₂ reduction targets for light trucks, indirectly promoting a notable share of electric vehicles [2]“Proposed Greenhouse Gas Standards for Heavy-Duty Vehicles,” U.S. Environmental Protection Agency, epa.gov . Similarly, India's Bharat Stage VI Phase 2 enforces stricter particulate emission limits and requires on-board diagnostics, accelerating the phase-out of older fleets that align with Euro 4 standards.
Exploding Last-Mile E-Commerce Demand
In 2024, e-commerce transactions in the U.S. reached a significant milestone, accounting for a substantial portion of total retail sales. Notably, even a small increase in this penetration translates to a considerable demand for additional vans or pickups. Fleet operators are now prioritizing features such as low cargo floors for easier loading, side doors for convenient curbside access, and sufficient real-world range to support their duty cycles. By mid-2024, Amazon had deployed a large number of electric delivery vans from Rivian, realizing notable reductions in operating costs per mile compared to retrofitted diesel counterparts, due to diminished brake and transmission wear. As vehicle utilization in bustling cities continues to rise, replacement cycles have shortened significantly. This accelerated churn in the light commercial vehicle market is leading to growing order backlogs at major OEMs.
Rapid Battery-Cost Decline Below USD 100/kWh
In recent years, average lithium-ion pack prices have been declining and are expected to drop significantly in the near future. This reduction is primarily driven by the scaled production of lithium-iron-phosphate chemistry, which is now widely used in many Chinese vans. As a result, the cost of these battery packs is anticipated to decrease substantially by the end of the decade. This trend is likely to make electric vehicles more cost-effective, even for users with lower annual mileage. Ford’s E-Transit has already achieved total cost of ownership (TCO) parity at a moderate annual mileage in 2024. Once battery prices reach the anticipated milestone, the TCO advantage will extend to even lower mileage thresholds. An analysis by ICCT predicts that cost parity for medium-sized vans will be achieved within the next few years.
Fleet Telematics Lowering TCO & Accelerating Renewal Cycles
In 2024, a significant majority of fleets in North America and Europe adopted telematics. This move led to a notable reduction in fuel consumption through optimized routing and a considerable decrease in unplanned downtime due to early warnings from predictive maintenance on potential component failures. Fleet managers now act on real-time health data, opting for disposals when annual repair costs become disproportionately high compared to a vehicle's replacement value. This shift has noticeably shortened average holding periods. Additionally, Mercedes-Benz's eSprinter benefits from over-the-air updates, optimizing charging windows and extending battery life significantly. This not only boosts the vehicle's residual value but also reduces the perceived risks of electrics on fleet balance sheets.
Restraints Impact Analysis*
| Restraint | (~) % Impact on CAGR Forecast | Geographic Relevance | Impact Timeline |
|---|---|---|---|
| High Upfront Cost of ELCVs Despite Falling Battery Prices | -0.7% | Global, with acute impact in price-sensitive markets (India, Latin America, Southeast Asia) | Short term (≤ 2 years) |
| Charging Infrastructure Gaps Outside Depot Environments | -0.5% | North America, Europe, and Asia Pacific (excluding China) | Medium term (2-4 years) |
| Payload Penalties from Heavy Battery Packs | -0.4% | Europe and Asia Pacific, where GVW regulations are strictly enforced | Medium term (2-4 years) |
| Tax-Policy Uncertainty on Double-Cab Pickups | -0.3% | United Kingdom, Australia, and select European markets | Short term (≤ 2 years) |
| Source: Mordor Intelligence | |||
High Upfront Cost of ELCVs Despite Falling Battery Prices
Electric vans carry a significant premium over their diesel counterparts, primarily due to development costs being distributed across a smaller volume and elevated warranty reserves. In 2024, Ford's base E-Transit was priced notably higher than its diesel Transit counterpart. This substantial price difference poses challenges for operators with constrained capital budgets. In India, even after accounting for subsidies, Tata's Ace EV was priced at a considerably higher premium compared to the traditional internal-combustion Ace, a disparity further exacerbated by the additional expense of required chargers. In Europe, weak prices for used electric vehicles (EVs) experienced a notable decline in 2024, dampening lease residuals and tightening credit availability.
Charging Infrastructure Gaps Outside Depot Environments
While depot charging caters to most parcel operations, field service fleets grapple with limited access to public fast-charge networks. In 2024, the U.S. had a significantly low number of DC fast-charge sites, resulting in a charger-to-vehicle ratio far below the ideal benchmark. Europe, with its fast chargers concentrated in a few countries like Germany and the Netherlands, leaves Southern and Eastern corridors underserved. Each 30-minute charging stop can cost fleets a considerable amount in lost productivity, jeopardizing the economics of routes with high utilization.
*Our forecasts treat driver/restraint impacts as directional, not additive. The impact forecasts reflect baseline growth, mix effects, and variable interactions.
Segment Analysis
By Vehicle Type: Vans Gain on Pickup Dominance
Pick-up trucks captured 45.57% of the light commercial vehicle market share in 2025. Vans, however, are forecast to expand at a 6.15% CAGR through 2031 as ultra-low-emission zones encourage compact, aerodynamic bodies that slip into tight curb spaces. The light commercial vehicle market size for vans is projected to grow faster than any other vehicle class, reinforced by battery-electric variants that now meet 150–200-mile duty cycles.
Ford’s F-150 Lightning shows pickups are diversifying roles with on-site power export, yet parcel giants favor high-cube vans that maximize cargo per square meter. In Europe, compact models such as Stellantis e-Berlingo thrive inside city walls, while medium vans dominate perishables and parcel segments. Crew-cab vans that seat technicians plus tools blur category lines, underscoring converging use cases in the light commercial vehicle market.


By Propulsion Type: Electric Gains Amid ICE Dominance
Internal-combustion units still supplied 77.81% of 2025 production, supported by existing service networks and long-range flexibility. Electric alternatives nevertheless post a 6.22% CAGR through 2031 as Section 45W and Euro 7 pressure tip total cost calculations. Rivian’s EDV validated battery economics on 120-mile urban loops, while hybrid vans struggle to meet zero-emission mandates and lose ground.
Fuel-cell volumes remain marginal, constrained by 59 hydrogen stations in the United States during 2024, though Japan and South Korea pilot corridors for routes beyond 200 miles. As battery costs decline, the light commercial vehicle market size attached to electric drivetrains widens, capturing incremental share in dense city zones despite payload trade-offs.
By Application: Commercial Delivery Leads Diversification
Commercial delivery commanded 57.81% of the light commercial vehicle market in 2025 and will log a 6.16% CAGR through 2031. Amazon’s order pipeline of 100,000 Rivian vans and FedEx commitments to electrify 50% of pickup-and-delivery assets by 2030 anchor a secular shift toward emissions-free last-mile fleets.
Construction and industrial support retains diesel dominance owing to towing and off-road needs, yet early prototypes from Caterpillar and Komatsu partner OEMs preview electrification at worksites. Municipal fleets adopt electric variants when budget cycles align with climate pledges, but longer procurement horizons slow penetration.
By Ownership Model: Subscription Challenges Fleet Dominance
Fleet ownership held a 75.53% share in 2025 as integrated logistics giants leverage cheap debt and dedicated managers. Subscription grows at 6.26% CAGR to 2031, lifting market flexibility for SMEs that prize low commitment and bundled services.
The light commercial vehicle market size addressed by subscription contracts remains modest today, yet expands rapidly as residual-value transparency strengthens and OEM captives chase recurring revenue streams.
By Payload (GVW Class): Lighter Segments Gain Share
Vehicles rated 2.6–3.5 tons represented 68.83% of 2025 volumes because they balance payload with license thresholds. Sub-2.5-ton vans add a 6.28% CAGR on rising micro-fulfillment demand that favors nimble bodies over bulk capacity.
The light commercial vehicle market share for heavier classes grows slowly due to battery mass penalties, encouraging material light-weighting and adoption of lithium-iron-phosphate packs that trade range for payload.
Geography Analysis
Asia Pacific held 38.62% of the light commercial vehicle market in 2025 and is expected to register a 6.18% CAGR to 2031. In 2024, China's dual-credit rewards and local subsidies significantly boosted sales of commercial new-energy vehicles to substantial levels. Meanwhile, India's production-linked incentives attracted considerable investment commitments. Notably, Tata's Ace EV achieved notable sales, even commanding a significant price premium. Japan is addressing its aging driver demographic by testing autonomous kei trucks. In a strategic move, Thailand introduced an extended tax holiday, successfully attracting a major investment in local assembly [3]“BYD to Build Its First Passenger Car Factory in Europe,” BYD, byd.com .
Europe accounted for a significant share of the 2025 market volumes, supported by numerous zero-emission zones that restrict older vehicle models. With stringent mandates for CO₂ emission reductions by 2030, the continent is driving a substantial shift toward electric vehicles, accelerating the phase-out of diesel. North America captured a comparable market share but adopted a different approach, focusing on subsidies rather than outright bans. For instance, tax credits subsidize a significant portion of the electric premium, and a rebate program in Canada substantially increased light commercial EV registrations in 2024. Furthermore, fleet commitments from major companies like Amazon, FedEx, and Walmart are sustaining order backlogs for several years.
South America, alongside the Middle East & Africa, collectively represents a smaller portion of the global market value. While Brazil's Rota 2030 initiative promotes ethanol-friendly flex-fuel engines, Argentina faces economic challenges that hinder EV investments, despite the nation's abundant lithium resources. South Africa is making progress with grid stabilization and a private charging rollout, signaling a potential shift in the future. However, the country's current EV penetration remains minimal compared to Europe and China.

Competitive Landscape
In 2025, the top five producers—Ford, Stellantis, Mercedes-Benz, Renault, and Toyota—accounted for nearly half of the output, paving the way for emerging contenders. While Stellantis optimizes R&D costs by utilizing its STLA Medium platform across multiple brands, BYD's in-house integration of battery, motor, and software significantly reduces material costs.
BYD's factory in Hungary circumvents tariff hurdles and cuts down freight expenses for European deliveries. Rivian's comprehensive vertical integration allows for swift feature updates, a demand from Amazon, leading to operating costs per mile that are notably lower than those of converted diesel vans.
Patent applications highlight a focus on bi-directional charging, battery thermal management, and predictive maintenance, underscoring the shift towards software differentiation over traditional manufacturing advantages in the light commercial vehicle sector.
Light Commercial Vehicles Industry Leaders
BAIC Motor Corporation Ltd.
Dongfeng Motor Corporation
Ford Motor Company
General Motors Company
Volkswagen AG
- *Disclaimer: Major Players sorted in no particular order

Recent Industry Developments
- April 2025: Isuzu presented the series-production electric D-MAX EV at the Birmingham Commercial Vehicle Show, confirming UK deliveries from Feb 2026 with a 1-ton payload and 3.5-ton towing capability.
- March 2025: Iveco and Stellantis Pro One signed a 10-year supply deal for two new electric vans, to be built at Stellantis plants and marketed under the IVECO badge from mid-2026.


Global Light Commercial Vehicles Market Report Scope
The scope of the report includes Vehicle Type (Pick-Up Trucks and Vans), Propulsion Type (ICE, Hybrid, Battery-Electric, and Fuel-Cell Electric), Application (Commercial Delivery & Logistics and More), Ownership Model (Fleet-Owned and More), Payload (Less Than or Equal To 2. 5t and More), and Geography.
By Vehicle Type
| Pick-up Trucks |
| Vans (Compact, Medium, Heavy) |
By Propulsion Type
| ICE |
| Hybrid |
| Battery-Electric |
| Fuel-Cell Electric |
By Application
| Commercial Delivery & Logistics |
| Industrial / Construction Support |
| Municipal & Public Services |
By Ownership Model
| Fleet-Owned |
| Leased |
| Subscription / VaaS |
By Payload (GVW Class)
| Less than or equal to 2.5 t |
| 2.6 – 3.5 t |
| More than 3.5 t |
By Geography
| North America | United States |
| Canada | |
| Rest of North America | |
| South America | Brazil |
| Argentina | |
| Rest of South America | |
| Europe | Germany |
| France | |
| United Kingdom | |
| Spain | |
| Italy | |
| Russia | |
| Rest of Europe | |
| Asia Pacific | China |
| India | |
| Japan | |
| South Korea | |
| Australia & New Zealand | |
| Rest of Asia Pacific | |
| Middle East and Africa | Saudi Arabia |
| United Arab Emirates | |
| South Africa | |
| Rest of Middle East and Africa |
| By Vehicle Type | Pick-up Trucks | |
| Vans (Compact, Medium, Heavy) | ||
| By Propulsion Type | ICE | |
| Hybrid | ||
| Battery-Electric | ||
| Fuel-Cell Electric | ||
| By Application | Commercial Delivery & Logistics | |
| Industrial / Construction Support | ||
| Municipal & Public Services | ||
| By Ownership Model | Fleet-Owned | |
| Leased | ||
| Subscription / VaaS | ||
| By Payload (GVW Class) | Less than or equal to 2.5 t | |
| 2.6 – 3.5 t | ||
| More than 3.5 t | ||
| By Geography | North America | United States |
| Canada | ||
| Rest of North America | ||
| South America | Brazil | |
| Argentina | ||
| Rest of South America | ||
| Europe | Germany | |
| France | ||
| United Kingdom | ||
| Spain | ||
| Italy | ||
| Russia | ||
| Rest of Europe | ||
| Asia Pacific | China | |
| India | ||
| Japan | ||
| South Korea | ||
| Australia & New Zealand | ||
| Rest of Asia Pacific | ||
| Middle East and Africa | Saudi Arabia | |
| United Arab Emirates | ||
| South Africa | ||
| Rest of Middle East and Africa | ||


Market Definition
- Vehicle Type - The category covers light commercial vehicle.
- Vehicle Body Type - This includes Light Commercial Pick-up Trucks and Light Commercial Vans.
- Fuel Category - The category includes various fuel types such as Gasoline, Diesel, LPG (Liquefied Petroleum Gas), CNG (Compressed Natural Gas), HEV (Hybrid Electric Vehicles), PHEV (Plug-in Hybrid Electric Vehicles), BEV (Battery Electric Vehicles), and FCEV (Fuel Cell Electric Vehicles)
| Keyword | Definition |
|---|---|
| Electric Vehicle (EV) | A vehicle which uses one or more electric motors for propulsion. Includes cars, buses, and trucks. This term includes all-electric vehicles or battery electric vehicles and plug-in hybrid electric vehicles. |
| BEV | A BEV relies completely on a battery and a motor for propulsion. The battery in the vehicle must be charged by plugging it into an outlet or public charging station. BEVs do not have an ICE and hence are pollution-free. They have a low cost of operation and reduced engine noise as compared to conventional fuel engines. However, they have a shorter range and higher prices than their equivalent gasoline models. |
| PEV | A plug-in electric vehicle is an electric vehicle that can be externally charged and generally includes all-electric vehicles as well as plug-in hybrids. |
| Plug-in Hybrid EV | A vehicle that can be powered either by an ICE or an electric motor. In contrast to normal hybrid EVs, they can be charged externally. |
| Internal combustion engine | An engine in which the burning of fuels occurs in a confined space called a combustion chamber. Usually run with gasoline/petrol or diesel. |
| Hybrid EV | A vehicle powered by an ICE in combination with one or more electric motors that use energy stored in batteries. These are continually recharged with power from the ICE and regenerative braking. |
| Commercial Vehicles | Commercial vehicles are motorized road vehicles designed for transporting people or goods. The category includes light commercial vehicles (LCVs) and medium and heavy-duty vehicles (M&HCV). |
| Passenger Vehicles | Passenger cars are electric motor– or engine-driven vehicles with at least four wheels. These vehicles are used for the transport of passengers and comprise no more than eight seats in addition to the driver’s seat. |
| Light Commercial Vehicles | Commercial vehicles that weigh less than 6,000 lb (Class 1) and in the range of 6,001–10,000 lb (Class 2) are covered under this category. |
| M&HDT | Commercial vehicles that weigh in the range of 10,001–14,000 lb (Class 3), 14,001–16,000 lb (Class 4), 16,001–19,500 lb (Class 5), 19,501–26,000 lb (Class 6), 26,001–33,000 lb (Class 7) and above 33,001 lb (Class 8) are covered under this category. |
| Bus | A mode of transportation that typically refers to a large vehicle designed to carry passengers over long distances. This includes transit bus, school bus, shuttle bus, and trolleybuses. |
| Diesel | It includes vehicles that use diesel as their primary fuel. A diesel engine vehicle have a compression-ignited injection system rather than the spark-ignited system used by most gasoline vehicles. In such vehicles, fuel is injected into the combustion chamber and ignited by the high temperature achieved when gas is greatly compressed. |
| Gasoline | It includes vehicles that use gas/petrol as their primary fuel. A gasoline car typically uses a spark-ignited internal combustion engine. In such vehicles, fuel is injected into either the intake manifold or the combustion chamber, where it is combined with air, and the air/fuel mixture is ignited by the spark from a spark plug. |
| LPG | It includes vehicles that use LPG as their primary fuel. Both dedicated and bi-fuel LPG vehicles are considered under the scope of the study. |
| CNG | It includes vehicles that use CNG as their primary fuel. These are vehicles that operate like gasoline-powered vehicles with spark-ignited internal combustion engines. |
| HEV | All the electric vehicles that use batteries and an internal combustion engine (ICE) as their primary source for propulsion are considered under this category. HEVs generally use a diesel-electric powertrain and are also known as hybrid diesel-electric vehicles. An HEV converts the vehicle momentum (kinetic energy) into electricity that recharges the battery when the vehicle slows down or stops. The battery of HEV cannot be charged using plug-in devices. |
| PHEV | PHEVs are powered by a battery as well as an ICE. The battery can be charged through either regenerative breaking using the ICE or by plugging into some external charging source. PHEVs have a better range than BEVs but are comparatively less eco-friendly. |
| Hatchback | These are compact-sized cars with a hatch-type door provided at the rear end. |
| Sedan | These are usually two- or four-door passenger cars, with a separate area provided at the rear end for luggage. |
| SUV | Popularly known as SUVs, these cars come with four-wheel drive, and usually have high ground clearance. These cars can also be used as off-road vehicles. |
| MPV | These are multi-purpose vehicles (also called minivans) designed to carry a larger number of passengers. They carry between five and seven people and have room for luggage too. They are usually taller than the average family saloon car, to provide greater headroom and ease of access, and they are usually front-wheel drive. |


Research Methodology
Mordor Intelligence follows a four-step methodology in all its reports.
- Step-1: Identify Key Variables: To build a robust forecasting methodology, the variables and factors identified in Step-1 are tested against available historical market numbers. Through an iterative process, the variables required for market forecast are set and the model is built based on these variables.
- Step-2: Build a Market Model: Market-size estimations for the historical and forecast years have been provided in revenue and volume terms. Market revenue is calculated by multiplying the sales volume with their respective average selling price (ASP). While estimating ASP factors like average inflation, market demand shift, manufacturing cost, technological advancement, and varying consumer preference, among others have been taken into account.
- Step-3: Validate and Finalize: In this important step, all market numbers, variables, and analyst calls are validated through an extensive network of primary research experts from the market studied. The respondents are selected across levels and functions to generate a holistic picture of the market studied.
- Step-4: Research Outputs: Syndicated Reports, Custom Consulting Assignments, Databases & Subscription Platforms.


