Video-on-Demand Market Size and Share
Market Overview
| Study Period | 2020 - 2031 |
|---|---|
| Market Size (2026) | USD 140.63 Billion |
| Market Size (2031) | USD 242.03 Billion |
| Growth Rate (2026 - 2031) | 11.47% CAGR |
| Fastest Growing Market | Asia Pacific |
| Largest Market | North America |
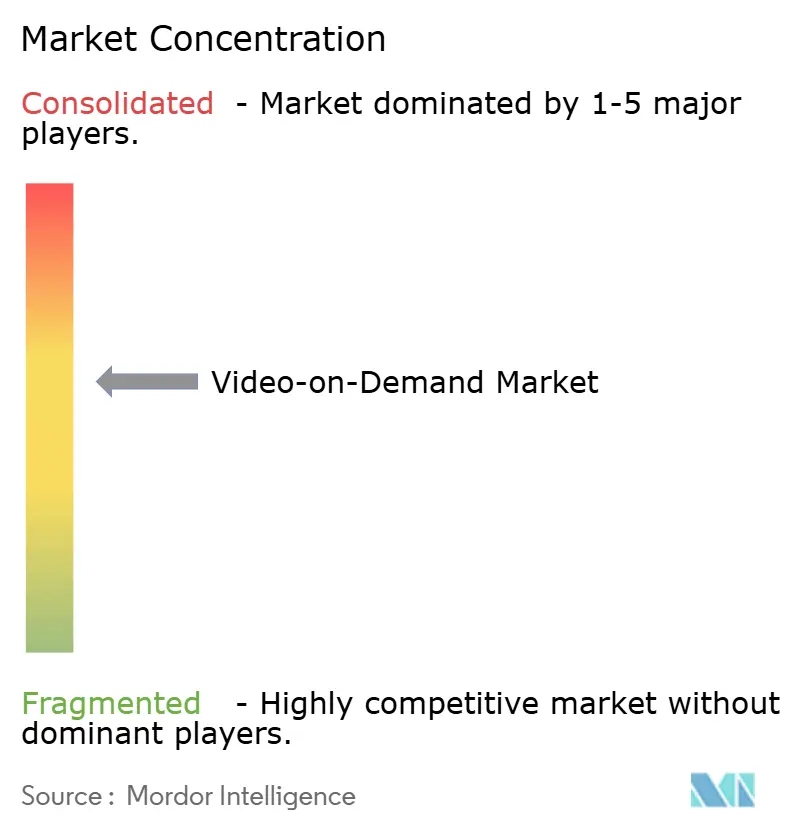
| Market Concentration | Medium |
Major Players *Disclaimer: Major Players sorted in no particular order Image © Mordor Intelligence. Reuse requires attribution under CC BY 4.0. | |

Video-on-Demand Market Analysis by Mordor Intelligence
The video-on-demand market size was valued at USD 126.16 billion in 2025 and estimated to grow from USD 140.63 billion in 2026 to reach USD 242.03 billion by 2031, at a CAGR of 11.47% during the forecast period (2026-2031). Soaring fiber and 5G coverage, rapid roll-outs of advertising-supported tiers, and sustained spending on local-language originals underpin this growth. Platforms are lowering distribution costs through next-generation codecs and edge computing, while live sports rights now rival scripted drama as a subscriber magnet. At the same time, tougher European data-privacy rules and subscription fatigue in North America compel operators to pursue hybrid bundles with telecom and pay-television partners to contain churn.
Key Report Takeaways
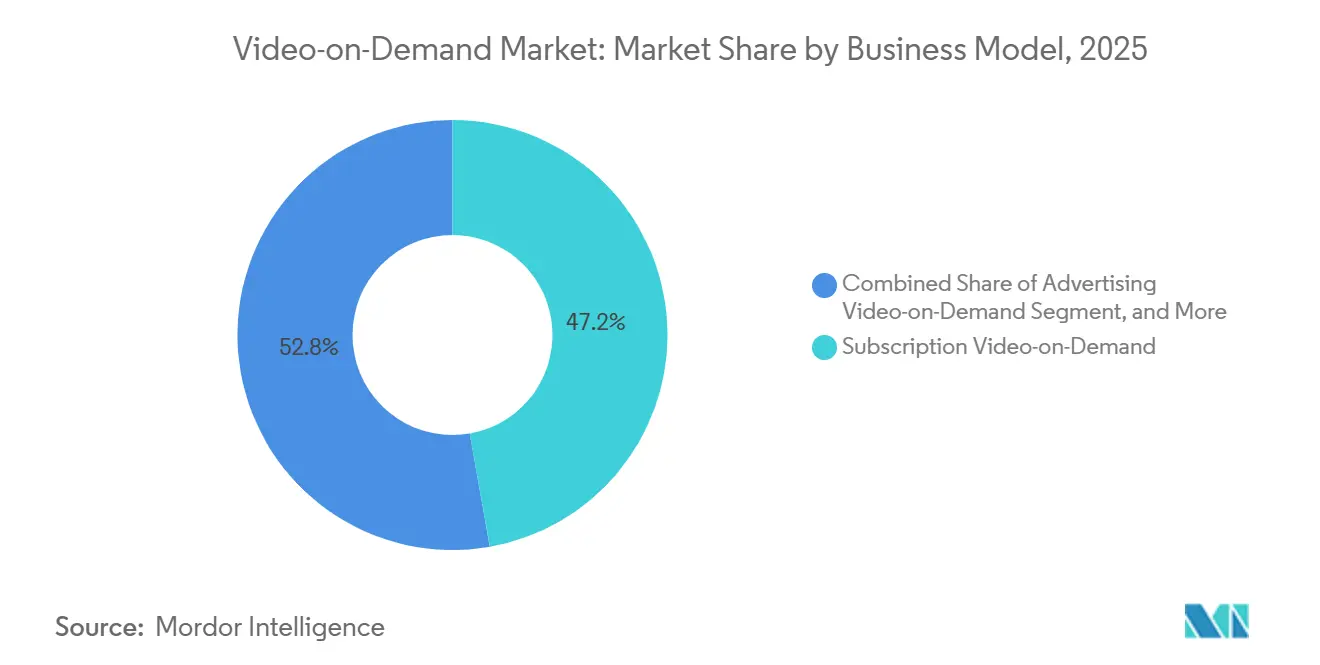
- By business model, subscription video-on-demand accounted for 47.23% of 2025 revenue, whereas advertising video-on-demand is projected to expand at a 12.31% CAGR through 2031.
- By delivery technology, over-the-top streaming held 59.42% of the video-on-demand market share in 2025, and its 12.27% CAGR is the fastest among delivery formats.
- By device type, smart televisions led with 43.87% of 2025 viewing, while connected streaming devices are advancing at a 12.49% CAGR to 2031.
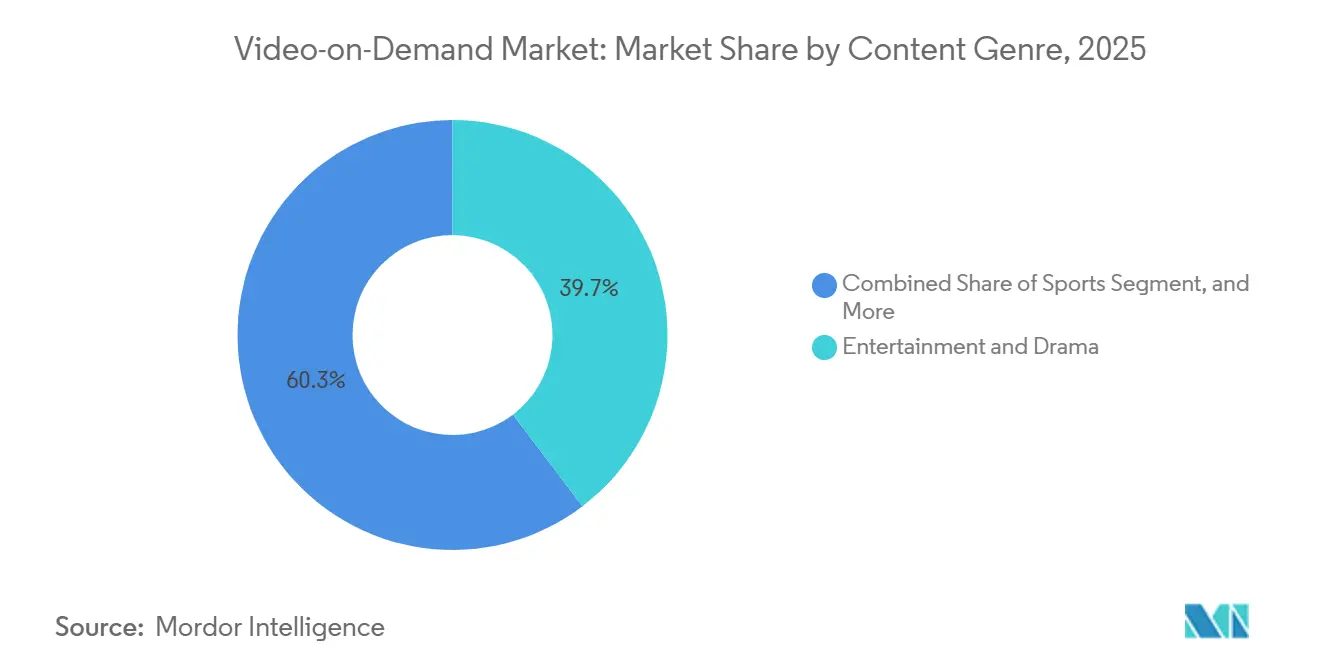
- By content genre, entertainment and drama commanded a 39.67% of the video-on-demand market share in 2025, yet sports streaming is forecast to post the highest 12.46% CAGR through 2031.
- By end user, residential users accounted for 78.17% of 2025 revenue, whereas commercial and enterprise deployments are growing at a 12.23% CAGR to 2031.
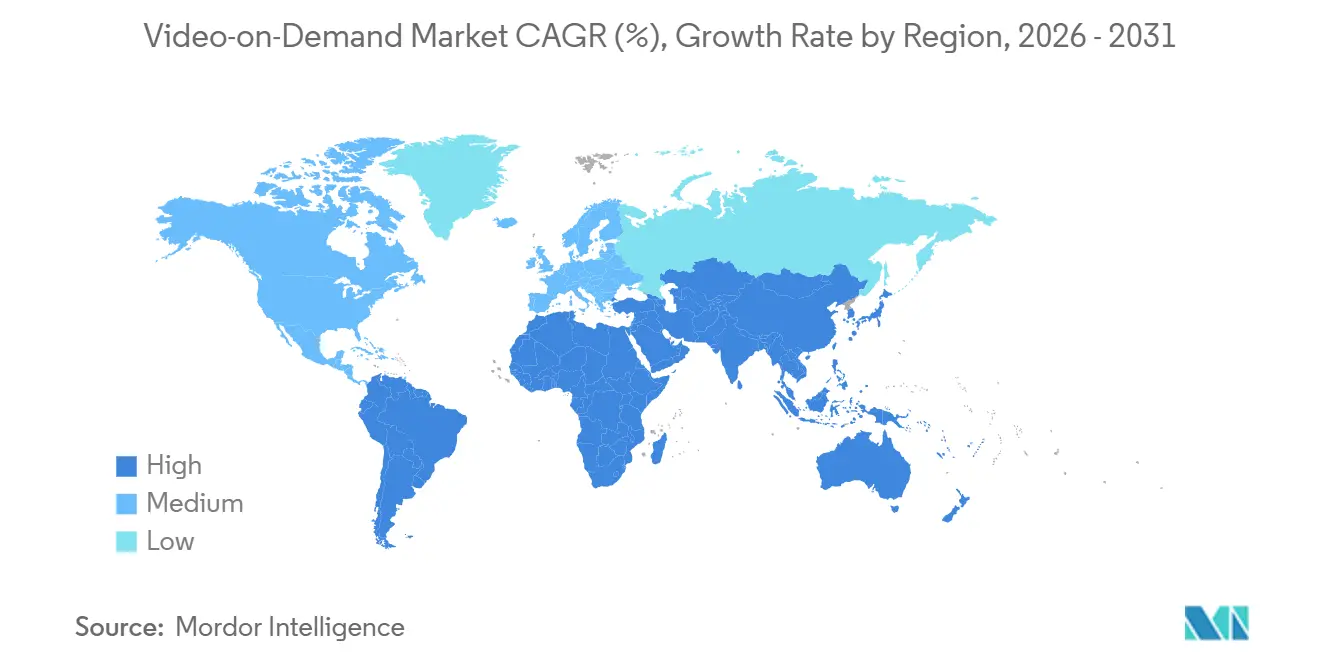
- By geography, North America accounted for 36.38% of global 2025 revenue, but Asia-Pacific is the fastest-growing region, with a 12.42% CAGR to 2031.
Note: Market size and forecast figures in this report are generated using Mordor Intelligence’s proprietary estimation framework, updated with the latest available data and insights as of 2026.
Global Video-on-Demand Market Trends and Insights
Drivers Impact Analysis*
| Driver | (~) % Impact on CAGR Forecast | Geographic Relevance | Impact Timeline |
|---|---|---|---|
| Rapid Adoption of AVOD Platforms in Emerging Asia-Pacific Markets | +1.8% | Asia-Pacific core, spillover to Middle East and Africa | Medium term (2-4 years) |
| Expansion of Ultra-High-Speed Broadband Rollout in North America and Western Europe | +1.5% | North America and Europe | Short term (≤2 years) |
| Increased Content Investments in Local-Language Originals by Global Streamers | +1.3% | Global, early gains in India, Brazil, Southeast Asia | Medium term (2-4 years) |
| Bundling of VoD with Telecom and Pay-TV Subscriptions Driving Uptake in South America | +1.1% | South America, nascent adoption in Africa | Short term (≤2 years) |
| Growing Adoption of Cloud-Native CDN and Edge Compute Lowering VoD Latency | +1.0% | Global | Short term (≤2 years) |
| Integration of Virtual Watch Parties and Social Features Enhancing Engagement | +0.7% | North America, Europe, urban Asia-Pacific | Medium term (2-4 years) |
| Adoption of Next-Gen Video Codecs (AV1, VVC) Lowering Data Costs in Emerging Markets | +0.9% | Global, highest impact in bandwidth-constrained regions | Long term (≥4 years) |
| Source: Mordor Intelligence | |||
Rapid Adoption of AVOD Platforms in Emerging Asia-Pacific Markets
Advertising-supported tiers reached 28% of streaming revenue in Indonesia, the Philippines, Vietnam, and Thailand by late 2025, double the 2023 level.[1]Motion Picture Association, “THEME Report 2025: AVOD Share Doubles in Southeast Asia,” Motion Picture Association, motionpictures.org Low credit card penetration keeps many viewers from paying monthly fees, so carriers and digital wallets now handle most transactions, reducing payment friction by 60%. Falling mobile-data prices in India, where a gigabyte costs less than USD 0.10 in 2025, make high-definition viewing affordable for mass users. Advertisers, facing third-party cookie limits, shift to brand-safe video inventory that offers contextual placement without user tracking. Light ad loads and localized content quotas deepen engagement, so churn remains lower than on pure subscription services.
Expansion of Ultra-High-Speed Broadband Rollout in North America and Western Europe
United States fiber-to-the-home lines topped 50 million in mid-2025, up 22% from 2023, after federal grants encouraged overbuilds.[2]National Cable and Telecommunications Association, “Fiber-to-the-Home Connections Surpass 50 Million U.S. Households in 2025,” NCTA, ncta.com The European Gigabit Infrastructure Act helped lift symmetrical gigabit speeds to 18% of households by early 2026, double the 2024 level. Reliable multi-stream 4K playback cuts buffering complaints, trimming churn for major platforms. Fixed-wireless 5G added 12 million U.S. broadband lines in 2025, closing the rural gap and creating new addressable homes. Streamers now sell plans by resolution instead of geography, unlocking higher revenue from previously underserved clusters.
Increased Content Investments in Local-Language Originals by Global Streamers
Netflix spent about USD 1 billion on Indian productions in 2025, a 40% jump from 2023, covering Hindi, Tamil, Telugu, and Bengali titles. Disney+ Hotstar reported that regional shows accounted for 62% of its Indian viewing hours in 2025, underscoring that local stories drive hours watched. Amazon financed 18 Portuguese-language originals in Brazil to challenge Globoplay’s entrenched position with bigger budgets and global release windows. Local storytelling lowers acquisition costs because culturally resonant plots deliver loyalty without Hollywood-scale spending. European 30% local-content quotas turn minimum mandates into strategic floor targets for green-lighting new series.[3]European Commission, “Gigabit Infrastructure Act Drives Symmetrical Gigabit Speeds to 18% of EU Households,” European Commission, ec.europa.eu
Bundling of VoD with Telecom and Pay-TV Subscriptions Driving Uptake in South America
Brazilian and Argentine telcos embedded streaming apps in mobile and fiber plans, pushing bundled video penetration above 40% of broadband customers by late 2025. Claro Brasil zero-rated Disney+ and Paramount+ traffic, removing data-cap fear and deepening customer lock-in. Movistar Argentina waived HBO Max activation fees for 12-month fiber contracts, boosting broadband take-up in urban markets. Transparent bundle disclosure rules issued in 2024 protect consumers while not hindering multi-service packaging. The shared incentive structure lets telcos raise ARPU while platforms gain low-cost national-scale distribution.
Restraints Impact Analysis*
| Restraint | (~) % Impact on CAGR Forecast | Geographic Relevance | Impact Timeline |
|---|---|---|---|
| Escalating Content Licensing Costs Squeezing Platform Margins | −1.4% | Global | Short term (≤2 years) |
| Intensifying Antitrust Scrutiny over Exclusive Content Deals in EU | −0.9% | Europe, spillover to North America | Medium term (2-4 years) |
| Rising Churn Rates Due to Subscription Fatigue in Matured SVOD Markets | −1.2% | North America, Western Europe, Australia | Short term (≤2 years) |
| Tightening Data Privacy Regulations Restricting Targeted AVOD Monetization | −0.8% | Europe, California, emerging in Asia-Pacific | Medium term (2-4 years) |
| Source: Mordor Intelligence | |||
Escalating Content Licensing Costs Squeezing Platform Margins
Studios and sports leagues exploited bidding wars in 2025, pushing third-party licensing to as high as 45% of mid-tier revenue. Warner Bros. Discovery renewed its HBO Max output deal at a 30% premium, while the USD 76 billion National Basketball Association package forces each streamer to shoulder more than USD 2 billion a year. Rising costs crowd out budgets for technology upgrades and originals, creating smaller catalogs that drive churn. The European Digital Markets Act may eventually curb exclusivity, but enforcement remains uncertain. Until then, only the largest platforms can afford marquee rights without bleeding margins.
Rising Churn Rates Due to Subscription Fatigue in Matured SVOD Markets
U.S. churn hit 47% in late 2025 as households cycled through services to watch single shows before canceling. Antenna found that 38% of new sign-ups left within 90 days in Q3 2025, raising acquisition costs across all major platforms. The typical American subscribed to 4.2 services in 2025, diluting watch time per app and sharpening price sensitivity. Providers counter with annual-payment discounts and cheaper ad tiers that trade margin for retention. Without long-term contracts, constant investment in exclusive content remains the only durable lever to slow customer rotation.
*Our forecasts treat driver/restraint impacts as directional, not additive. The impact forecasts reflect baseline growth, mix effects, and variable interactions.
Segment Analysis
By Business Model: AVOD Narrows the Revenue Gap
Subscription video-on-demand held 47.23% of 2025 revenue, the largest video-on-demand market share at the model level, yet advertising video-on-demand is projected to expand at 12.31% a year through 2031 as advertisers follow audiences into brand-safe streaming environments. That growth is reshaping the video-on-demand market, as AVOD now attracts budgets that were once reserved for display ads reliant on third-party cookies. Transactional pay-per-view maintained an 8% slice of 2025 revenue, driven by high-value live events such as boxing and concerts that justify one-off pricing. Hybrid services combining ads and subscriptions captured 18% of the market in 2025, giving platforms a ladder of price points that cushions churn during economic uncertainty.
The AVOD scale is bolstered by flexible payment options, including carrier billing and e-wallets, which help bypass credit card shortfalls in Southeast Asia. Platforms also use ad-supported tiers to reacquire former subscribers who left due to monthly fees, thereby lowering the average acquisition cost. Meanwhile, SVOD growth is slowing as households juggle multiple services, so many operators repackage flagship catalogs into lower-priced bundles. Pay-per-view remains niche but profitable because sports promoters and artists monetize fans who are willing to pay premium prices for exclusivity. Across models, data-driven ad formats and tiered subscriptions give operators parallel revenue streams that hedge against saturation in any single approach.


By Delivery Technology: OTT Consolidates Dominance
Over-the-top streaming accounted for 59.42% of delivery revenue in 2025, the highest delivery-format video-on-demand market share, and is forecast to rise at a 12.27% CAGR to 2031. Internet protocol television VoD retained a 22% share because incumbent telcos still bundle managed video with broadband, but the gap is widening as cord-cutting accelerates. Pay-TV VoD fell to 12% of 2025 revenue and is declining 3% a year as set-top boxes lose relevance. Hybrid broadcast broadband television closed 2025 with a 7% slice, mostly in Europe, where public broadcasters extend catch-up catalogs without forcing new apps.
Cloud-native content delivery networks trimmed median latency to 180 milliseconds in early 2026, a 40% improvement that enables real-time social features and synchronized watch parties. Edge caching reduced backbone bandwidth by 35%, freeing up capital that operators can redirect to higher bitrates and HDR support. The migration to app-based distribution also lets platforms push updates weekly instead of waiting for firmware cycles tied to legacy hardware. IPTV providers increasingly adopt OTT middleware so their managed networks can interoperate with open internet delivery. These technology shifts collectively enlarge the addressable video-on-demand market size by bringing premium streams to bandwidth-constrained regions.
By Device Type: Connected Streaming Hardware Expands Faster Than Screens
Smart televisions captured 43.87% of 2025 viewing revenue, but connected streaming devices are advancing at a 12.49% CAGR to 2031 as consumers favor platform-agnostic sticks and boxes that receive faster software updates. Smartphones and tablets stabilized at 28% share because mobile-first markets in Asia-Pacific and Africa value portability over screen size. Personal computers and laptops slipped to 15% as younger demographics pivot to mobile and living-room screens, while emerging devices such as VR headsets and in-car systems accounted for 3% and are growing 14% annually.
Roku ended 2025 with 81.6 million active accounts and 4.1 daily streaming hours, demonstrating that a lightweight OS can capture meaningful engagement without owning content. Amazon’s Fire TV surpassed 200 million global activations, leveraging Prime membership and voice control to lock in usage. Smart-TV makers face slower replacement cycles, so many preload freemium channels that monetize through advertising splits. Rising demand for low-latency gaming and watch-party features favors external devices that support quicker codec upgrades. The widening hardware mix keeps the video-on-demand market share of device classes fluid as viewers toggle among screens throughout the day.
By Content Genre: Sports Rights Accelerate Direct-to-Consumer Growth
Entertainment and drama remained the largest genre, accounting for 39.67% of 2025 revenue, yet sports streaming is forecast to post the fastest CAGR of 12.46% through 2031 as leagues monetize direct rights and bypass legacy broadcasters. The USD 76 billion National Basketball Association deal awarded to Amazon, Comcast, and Disney in 2024 highlights how live exclusivity now rivals scripted originals for subscriber appeal. Kids and family content accounted for 18% of total content, thanks to evergreen libraries and parental demand for ad-free environments. Educational and documentary programming contributed 12%, buoyed by corporate training and lifelong-learning portals that embed on-demand modules. The remaining categories, including reality and lifestyle shows, accounted for the final 14%, benefiting from lower production costs and quick turnarounds.
Sports audiences drive record peak concurrency. JioCinema’s free Indian Premier League streams hit 32 million simultaneous viewers in 2025, validating advertising-funded models in price-sensitive markets. Rights holders increasingly package micromoments, such as alternate commentary feeds and behind-the-scenes clips, to extend engagement beyond live windows. In entertainment, global streamers fund local remakes of hit franchises to meet regional content quotas and deepen cultural resonance. Kids' catalogs thrive on merchandising tie-ins that add downstream revenue even when viewership plateaus. Across genres, the mix of live events and serialized storytelling broadens the video-on-demand market size by appealing to both appointment viewers and binge watchers.
By End-User: Enterprise Uptake Converts Video Into a Productivity Tool
Residential users delivered 78.17% of 2025 revenue, but commercial and enterprise deployments are growing at a 12.23% CAGR through 2031, signaling that businesses now regard video platforms as strategic infrastructure rather than amenities. Educational institutions accounted for 6% of revenue as universities archive lectures for flipped-class models, while public-sector entities accounted for 3% amid procurement delays. Cloud-based learning-management systems integrated video modules and captured 40% of corporate training budgets in 2025, up sharply from 2023.
Hospitality operators deployed streaming apps in 62% of hotel rooms, offering personalized recommendations and mobile casting to differentiate guest service. Healthcare systems use HIPAA-compliant platforms for patient education, thereby reducing readmission risk by improving at-home adherence. Enterprise buyers favor solutions with analytics dashboards that track completion rates and provide compliance evidence in regulated fields like finance and pharma. Public agencies experiment with citizen-facing portals that stream town-hall meetings and training content, though tight budgets slow wider rollouts. As hybrid work persists, on-demand video becomes a tool for scalable knowledge transfer, expanding the professional slice of the video-on-demand market share each year.
Geography Analysis
North America retained a 36.38% video-on-demand market share in 2025, but its 9.8% CAGR through 2031 trails the global pace, as household penetration is already high and churn reaches 47% annually. The United States generated 82% of regional revenue, helped by 50 million fiber-to-the-home lines that enable simultaneous 4K streams and reduce buffering-related cancellations. Canada’s 5% domestic-content levy on foreign streamers raises compliance costs but also stimulates local production, which lifts engagement. Mexico expanded 14% in 2025 as América Móvil bundled Claro Video with wireless plans, widening reach in secondary cities. Together, these factors keep the North American video-on-demand market on a mature yet stable growth path.
Asia-Pacific is growing fastest, advancing at a 12.42% CAGR as mobile-first viewing, localized originals, and ad-supported tiers expand the addressable base. India accounts for 28% of regional revenue, with free Indian Premier League streams drawing 32 million peak concurrent viewers and proving that live cricket can anchor an AVOD model where monthly willingness to pay stays below USD 2. China delivers 34% of Asia-Pacific revenue, though data-localization mandates confine foreign entrants, while Tencent Video, iQIYI, and Youku hold 76% of the domestic share by tying drama libraries to super-app ecosystems. Japan and South Korea together account for 17% of regional income, as Netflix and Amazon commission anime and K-dramas that find global audiences, reinforcing a feedback loop that finances more local storytelling.
Europe, South America, and the Middle East and Africa jointly contribute 38% of global revenue, yet display uneven trajectories. Europe’s 24% share grows at 10.5% a year, restrained by antitrust probes into exclusive sports rights and data-privacy limits on targeted ads. South America accounts for 7% of revenue, but telecom bundles push Brazilian and Argentine broadband adoption above 40% among broadband customers and trim standalone churn by roughly 25%. The Middle East and Africa command 5% of revenue yet post a 13.1% CAGR as Arabic dramas and smartphone consumption propel markets in Saudi Arabia, the United Arab Emirates, and South Africa, although low digital-payment penetration still caps monetization potential. Together, these regions diversify the global video-on-demand market size and buffer operators against saturation in any single geography.

Competitive Landscape
The five largest global platforms, Netflix, Amazon Prime Video, Disney+, YouTube, and Apple TV+, captured roughly 58% of 2025 revenue, giving the sector a moderate concentration score and shaping strategic priorities such as codec upgrades and live-sports acquisitions. Netflix’s AV1 rollout across 30% of its catalog cut bandwidth costs by 20% and raised video quality in bandwidth-constrained regions, forcing smaller rivals to weigh similar transitions or risk perception gaps. Amazon’s USD 1.8 billion-per-year UEFA Champions League deal, coupled with existing National Football League rights, underscores how premium sports now rival scripted hits as subscription magnets. Disney melded Hulu into Disney+ in late 2025, offering a USD 12.99 ad-supported bundle that reduces churn by simplifying discovery across its expanded library.
Second-tier challengers gain share through regional specialization and device control. JioCinema streamed the Indian Premier League free to 32 million concurrent viewers, proving that marquee cricket rights can seed a freemium funnel in a low-ARPU market. Roku focuses on the operating system layer rather than content ownership, monetizing ad inventory across 81.6 million active accounts and generating USD 3.5 billion in platform revenue in 2025. Tencent Video’s 2025 expansion into Malaysia, Thailand, and Indonesia leverages Mandarin and local-language interfaces, along with WeChat Pay, to tap the overseas Chinese diaspora and Southeast Asian viewers.
Technology vendors and regulatory forces add further complexity. MainStreaming’s edge-compute CDN cut median latency to 180 milliseconds, enabling synchronized watch parties that heighten engagement for live events. The European Union’s Digital Markets Act labeled several major streamers as gatekeepers, foreshadowing possible limits on exclusive licensing practices that could redistribute bargaining power toward smaller services. Collectively, codec innovation, sports-rights arm races, device-ecosystem plays, and evolving regulation make competitive dynamics fluid, even as incumbents' overall video-on-demand market share remains significant.
Video-on-Demand Industry Leaders
Amazon.com, Inc.
Netflix, Inc.
The Walt Disney Company
Warner Bros. Discovery, Inc.
Apple Inc.
- *Disclaimer: Major Players sorted in no particular order

Recent Industry Developments
- February 2026: Apple expands Apple TV+ availability to Android smartphones and tablets worldwide, aiming to attract an additional 1.2 billion Android users and accelerate subscriber growth beyond the 25 million accounts reported in late 2025.
- January 2026: Netflix commits USD 2.5 billion over three years to create 50 new Korean-language series and films, reinforcing its leadership in South Korea and extending the global appeal of K-dramas.
- December 2025: Amazon secures exclusive global streaming rights to the UEFA Champions League for three seasons starting in 2027, agreeing to pay about USD 1.8 billion annually to bolster Prime Video’s premium sports portfolio.
- November 2025: The Walt Disney Company launches a unified Disney+ and Hulu application in the United States, offering a bundled ad-supported subscription at USD 12.99 per month to simplify user experience and reduce churn.


Global Video-on-Demand Market Report Scope
The Video-on-Demand Market Report is Segmented by Business Model (Subscription Video-on-Demand, Advertising Video-on-Demand, Transactional/Pay-per-View, Hybrid and Other Models), Delivery Technology (Over-the-Top (OTT) Streaming, Internet Protocol Television (IPTV) VoD, Pay-TV VoD, Hybrid Broadcast Broadband TV), Device Type (Smartphones and Tablets, Smart TVs, PCs and Laptops, Connected Streaming Devices, Other Device Types), Content Genre (Entertainment and Drama, Sports, Kids and Family, Educational and Documentary, Other Content Genres), End-User (Residential/Individual, Commercial and Enterprise, Educational Institutions, Public Sector and Government), and Geography (North America, South America, Europe, Asia-Pacific, Middle East and Africa). The Market Forecasts are Provided in Terms of Value (USD).
| Subscription Video-on-Demand |
| Advertising Video-on-Demand |
| Transactional/Pay-per-View |
| Hybrid and Other Models |
| Over-the-Top (OTT) Streaming |
| Internet Protocol Television (IPTV) VoD |
| Pay-TV VoD |
| Hybrid Broadcast Broadband TV |
| Smartphones and Tablets |
| Smart TVs |
| PCs and Laptops |
| Connected Streaming Devices |
| Other Device Types |
| Entertainment and Drama |
| Sports |
| Kids and Family |
| Educational and Documentary |
| Other Content Genres |
| Residential / Individual |
| Commercial and Enterprise |
| Educational Institutions |
| Public Sector and Government |
| North America | United States | |
| Canada | ||
| Mexico | ||
| South America | Brazil | |
| Argentina | ||
| Rest of South America | ||
| Europe | United Kingdom | |
| Germany | ||
| France | ||
| Italy | ||
| Rest of Europe | ||
| Asia Pacific | China | |
| Japan | ||
| India | ||
| South Korea | ||
| Rest of Asia Pacific | ||
| Middle East and Africa | Middle East | United Arab Emirates |
| Saudi Arabia | ||
| Rest of Middle East | ||
| Africa | South Africa | |
| Egypt | ||
| Rest of Africa | ||
| By Business Model | Subscription Video-on-Demand | ||
| Advertising Video-on-Demand | |||
| Transactional/Pay-per-View | |||
| Hybrid and Other Models | |||
| By Delivery Technology | Over-the-Top (OTT) Streaming | ||
| Internet Protocol Television (IPTV) VoD | |||
| Pay-TV VoD | |||
| Hybrid Broadcast Broadband TV | |||
| By Device Type | Smartphones and Tablets | ||
| Smart TVs | |||
| PCs and Laptops | |||
| Connected Streaming Devices | |||
| Other Device Types | |||
| By Content Genre | Entertainment and Drama | ||
| Sports | |||
| Kids and Family | |||
| Educational and Documentary | |||
| Other Content Genres | |||
| By End-User | Residential / Individual | ||
| Commercial and Enterprise | |||
| Educational Institutions | |||
| Public Sector and Government | |||
| By Geography | North America | United States | |
| Canada | |||
| Mexico | |||
| South America | Brazil | ||
| Argentina | |||
| Rest of South America | |||
| Europe | United Kingdom | ||
| Germany | |||
| France | |||
| Italy | |||
| Rest of Europe | |||
| Asia Pacific | China | ||
| Japan | |||
| India | |||
| South Korea | |||
| Rest of Asia Pacific | |||
| Middle East and Africa | Middle East | United Arab Emirates | |
| Saudi Arabia | |||
| Rest of Middle East | |||
| Africa | South Africa | ||
| Egypt | |||
| Rest of Africa | |||


Key Questions Answered in the Report
What is the forecast revenue for global video-on-demand in 2031?
The sector is projected to reach USD 242.03 billion by 2031, growing at an 11.47% CAGR from 2026.
Which geographic region is expected to record the fastest growth through 2031?
Asia-Pacific is set to expand at a 12.42% CAGR, outpacing all other regions on the back of mobile-first viewing and localized content investment.
How are advertising-supported tiers reshaping monetization strategies?
AVOD revenue is advancing at a 12.31% CAGR as brand budgets shift to contextual video placements, enabling platforms to tap users who resist additional subscription fees.
Why have local-language originals become essential for subscriber acquisition?
Series produced in regional languages deliver higher engagement at lower cost per acquisition, helping global platforms win and keep viewers in India, Brazil, and Southeast Asia.
What factor is driving elevated churn in mature North American subscription services?
Subscription fatigue has pushed annual churn to 47%, with many households cycling through platforms to watch single titles before canceling.
How do telecom bundles influence streaming uptake in South America?
Embedding video services in mobile and fiber plans has lifted penetration above 40% in Brazil and Argentina and trimmed standalone churn by roughly 25%.
Page last updated on:


