Voice User Interface Market Size and Share
Market Overview
| Study Period | 2020 - 2031 |
|---|---|
| Market Size (2026) | USD 18.95 Billion |
| Market Size (2031) | USD 52.08 Billion |
| Growth Rate (2026 - 2031) | 22.41% CAGR |
| Fastest Growing Market | Asia Pacific |
| Largest Market | North America |
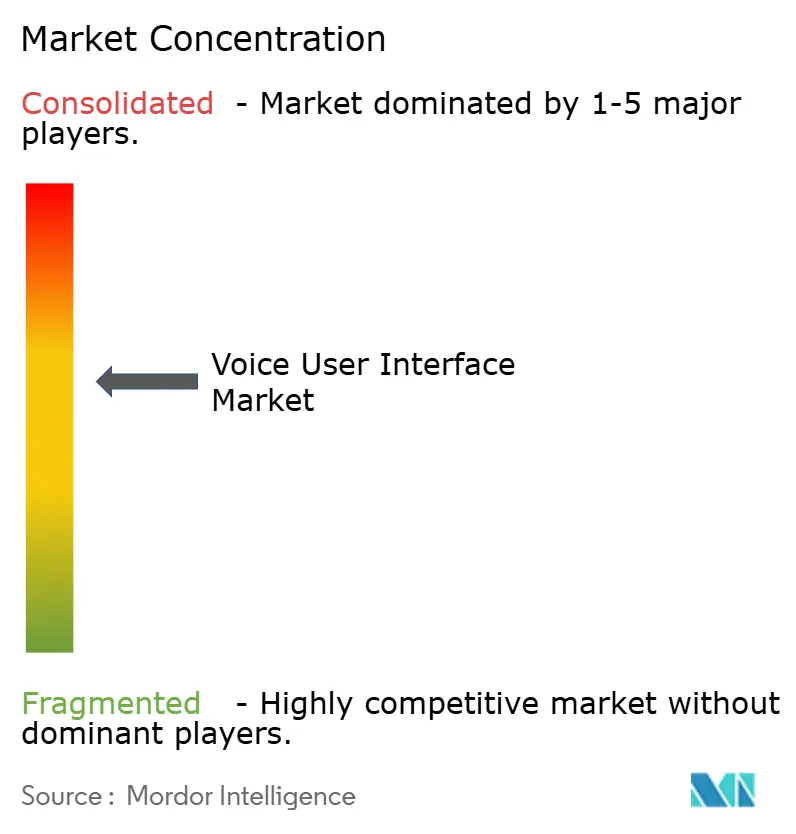
| Market Concentration | Medium |
Major Players *Disclaimer: Major Players sorted in no particular order Image © Mordor Intelligence. Reuse requires attribution under CC BY 4.0. | |

Voice User Interface Market Analysis by Mordor Intelligence
The voice user interface market size was valued at USD 15.48 billion in 2025 and estimated to grow from USD 18.95 billion in 2026 to reach USD 52.08 billion by 2031, at a CAGR of 22.41% during the forecast period (2026-2031). Shifts in technical architecture, from cloud-centric models to hybrid edge-cloud processing, now remove latency bottlenecks and settle long-standing privacy objections. Three inflection points support the growth trajectory: deep-learning speech models that log sub-6% word-error rates in production, edge AI chips that deliver responses in under 200 milliseconds without connectivity, and automotive infotainment platforms that integrate multimodal voice control in 40% of new vehicles. Together, they raise the ceiling for enterprise adoption in regulated sectors, broaden consumer habituation, and unlock new monetization paths for device makers. Competitive intensity is accelerating as hyperscalers commoditize speech-to-text application programming interfaces, forcing differentiation to migrate toward context retention, multimodal fusion, and domain-specific accuracy.
Key Report Takeaways
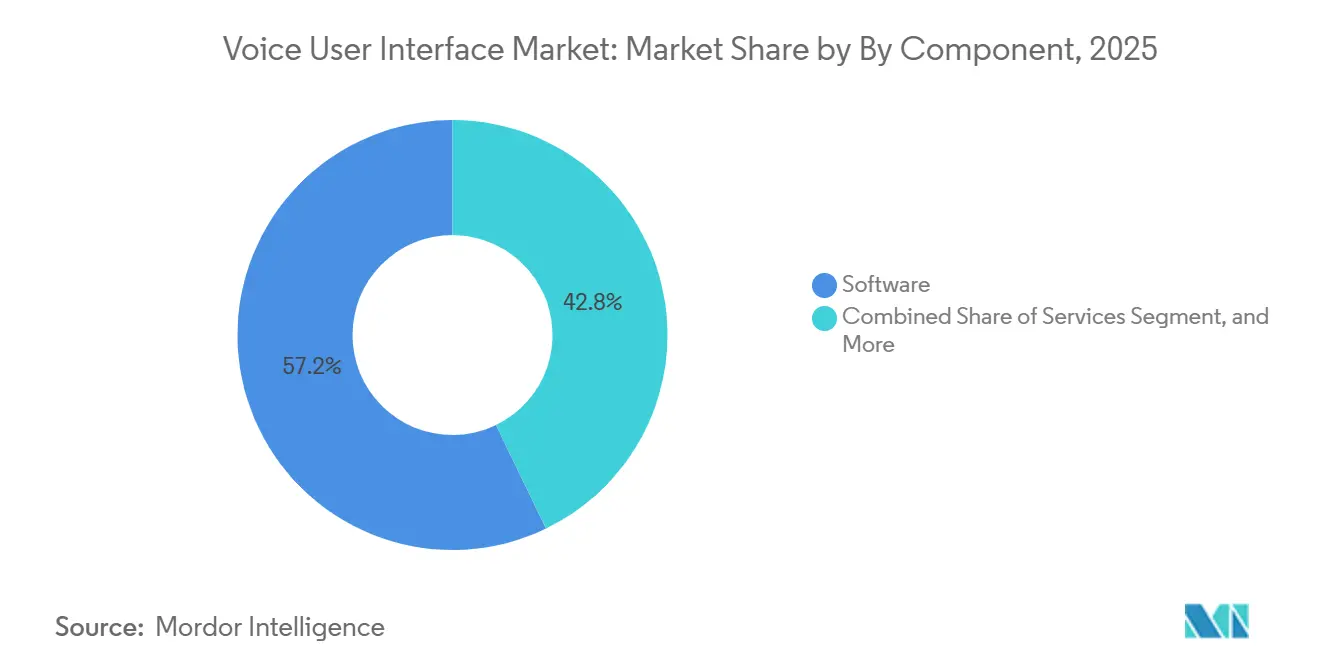
- By component, software held 57.16% revenue share of the Voice User Interface Market in 2025, while services are projected to advance at a 23.18% CAGR through 2031.
- By deployment mode, cloud captured 63.22% of the Voice User Interface Market in 2025 and is forecast to expand at a 24.32% CAGR to 2031.
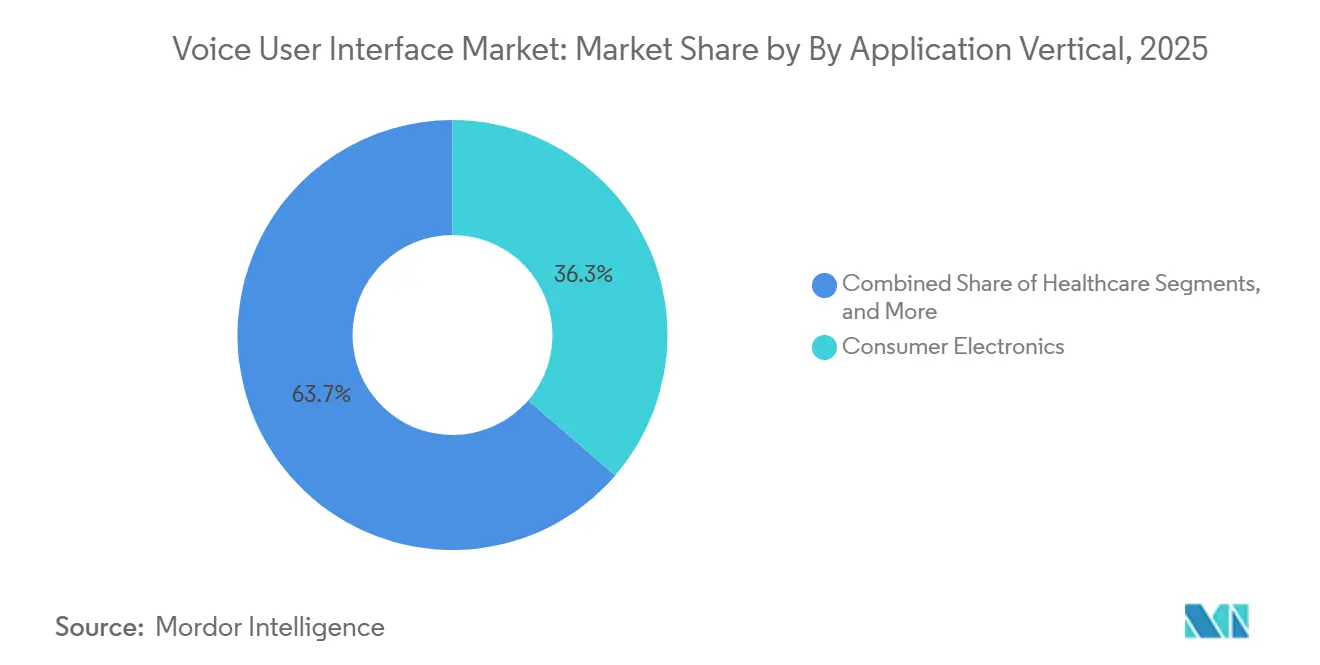
- By application vertical, consumer electronics led with 36.08% revenue share of the Voice User Interface Market in 2025, whereas healthcare is expected to post the fastest growth at a 25.91% CAGR during 2026-2031.
- By technology stack, edge AI processing accounted for 43.91% of the Voice User Interface Market revenue in 2025 and is on track to grow at a 24.12% CAGR through 2031.
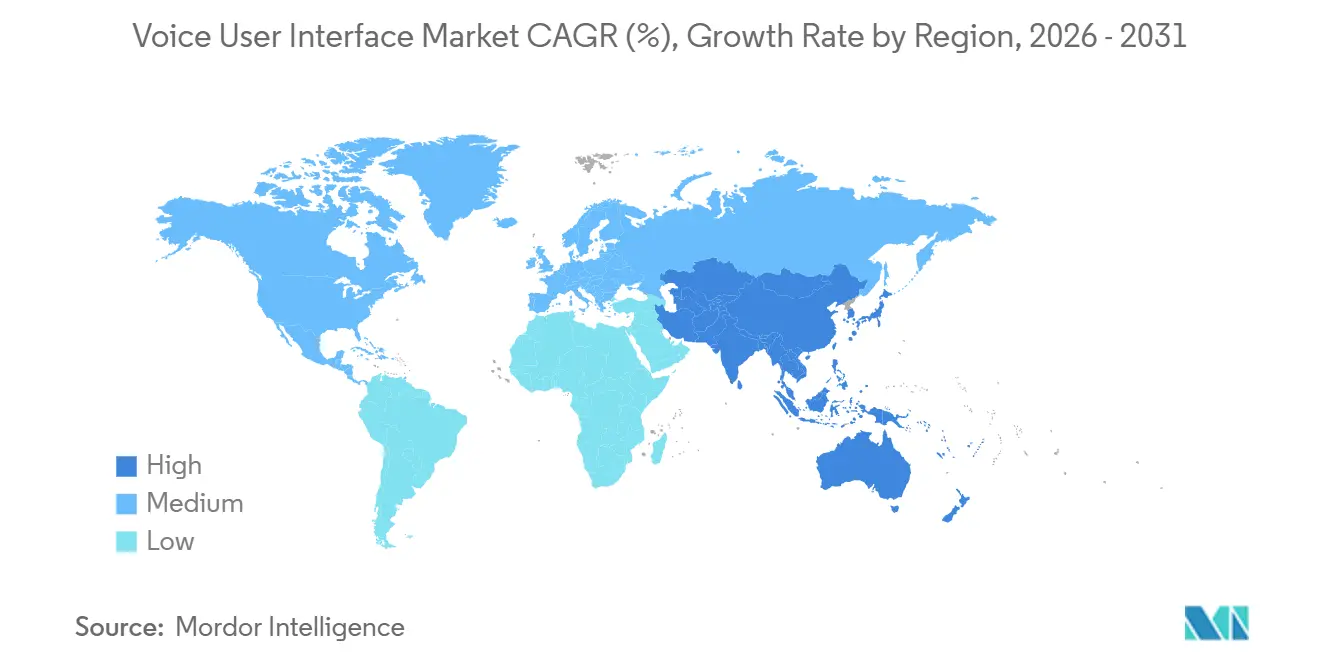
- By geography, North America commanded 38.23% of the Voice User Interface Market in 2025, yet Asia-Pacific is projected to record the highest CAGR at 24.17% through 2031.
Note: Market size and forecast figures in this report are generated using Mordor Intelligence’s proprietary estimation framework, updated with the latest available data and insights as of January 2026.
Global Voice User Interface Market Trends and Insights
Drivers Impact Analysis*
| Driver | (~) % Impact on CAGR Forecast | Geographic Relevance | Impact Timeline |
|---|---|---|---|
| Advances in Deep-Learning Speech Recognition Accuracy | +5.2% | Global, early gains in North America and China | Medium term (2-4 years) |
| On-Device Edge AI Chips Enabling Offline Voice Processing | +4.8% | Asia-Pacific core, spillover to Europe and Middle East | Long term (≥ 4 years) |
| Proliferation of Smart Speakers and Voice-First Consumer Devices | +3.9% | North America and Europe, expanding to Asia-Pacific | Short term (≤ 2 years) |
| Growing Integration of VUI in Automotive Infotainment | +3.6% | Europe and North America, with China accelerating | Medium term (2-4 years) |
| Multimodal Foundation Models Enabling Context-Rich Voice Interactions | +2.7% | Global, led by North America and select Asia-Pacific | Long term (≥ 4 years) |
| Open-Source Speech Corpora Lowering Entry Barriers for Niche Language Markets | +1.9% | Asia-Pacific, Middle East, Africa, and South America | Long term (≥ 4 years) |
| Source: Mordor Intelligence | |||
Advances in Deep-Learning Speech Recognition Accuracy
Transformer architectures cut production word-error rates to 5.42% in 2025, a 40% lift over 2023 recurrent networks.[1]Cohere Team, “Cohere Transcribe Achieves 5.42% Word-Error Rate in Production Environments,” Cohere, cohere.com Contextual-biasing techniques allow voice interfaces to parse legal, medical, and financial jargon without bespoke retraining, expanding use in high-stakes environments such as trading floors and operating rooms. Academic REB-former research prunes redundant attention heads, reducing edge-device latency to 180 milliseconds and making real-time interaction feasible for wearables.[2]IEEE Staff, “REB-former Architecture for Low-Latency Edge Voice Processing,” IEEE Xplore, ieeexplore.ieee.org With the threshold crossed, enterprises now elevate voice from secondary input to primary control, accelerating deployments across verticals that once relied on keyboards and touchscreens.
On-Device Edge AI Chips Enabling Offline Voice Processing
Specialized neural processing units reach 10 TOPS at sub-500 milliwatt power budgets, placing 1 billion-parameter models inside smartphones and car head units.[3] Mercedes-Benz, for instance, achieves sub-200 millisecond execution in the 2026 E-Class by pairing local wake-word detection with mid-tier transcription models. Offline inference decouples performance from network quality, a decisive benefit in automotive and industrial sites where coverage is spotty. Volume economics follow: ChipIntelli shipped 15 million USD 2.80 chips in 2025, enabling battery-powered sensors, locks, and thermostats to add reliable voice control.
Proliferation of Smart Speakers and Voice-First Consumer Devices
A 300 million-unit installed base of voice-activated speakers in 2025 normalized speech interaction, with households now initiating 4.2 daily commands on average.[4]WUQI Micro, “WQ5301 Neural Processing Unit Product Specifications,” WUQI Micro, wuqimicro.com Alexa alone processed 18 billion quarterly queries, driven by integrations that embed voice in everyday tasks such as grocery reordering and prescription refills. Matter protocol certification across 120 million devices standardizes command syntax, slashing the friction that once arose when consumers mixed and matched assistants. As users see voice as an expected utility, device makers without robust voice control face abandonment risk.
Growing Integration of VUI in Automotive Infotainment
Voice interfaces shipped in 42% of new vehicles during 2025, an increase from 28% two years earlier. Cerence’s xUI platform routes simple commands locally and complex ones to the cloud, shrinking average response latency to 320 milliseconds and cutting data-transmission cost by 65%. European New Car Assessment Program rules penalize vehicles that demand more than two seconds of visual attention for routine adjustments, effectively mandating voice control. Beamforming breakthroughs, such as Kardome’s six-microphone spatial isolation, sustain 90 decibel accuracy and shipped in 1.8 million vehicles during 2025.
Restraints Impact Analysis*
| Restraint | (~) % Impact on CAGR Forecast | Geographic Relevance | Impact Timeline |
|---|---|---|---|
| Persistent Privacy and Data-Security Concerns | -3.4% | Global, heightened in Europe and North America | Short term (≤ 2 years) |
| Acoustic and Accent Variability Reducing Recognition Accuracy | -2.8% | Asia-Pacific, Middle East, Africa, multilingual Europe | Medium term (2-4 years) |
| Escalating Royalties for Proprietary Wake-Word IP | -1.6% | Global, intensified in low-cost consumer electronics | Medium term (2-4 years) |
| EU AI Act Tier-II Transparency Mandates Inflating Compliance Overheads | -1.3% | Europe, spillover to vendors serving EU markets | Short term (≤ 2 years) |
| Source: Mordor Intelligence | |||
Persistent Privacy and Data-Security Concerns
Biometric voiceprints fall under sensitive-data clauses in the General Data Protection Regulation, and 68% of surveyed consumers remain unsure how assistants store or share recordings. The United States Federal Trade Commission settlement with Amazon over child data amplified skepticism, knocking 12 percentage points off purchase intent among parents. Enterprises now adopt on-device processing and zero-retention policies. Nuance’s Dragon Medical One keeps only de-identified text, adding roughly USD 1.2 million to project budgets but securing Health Insurance Portability and Accountability Act compliance. Until transparent governance frameworks solidify, privacy anxiety will mute uptake in healthcare, banking, and education.
Acoustic and Accent Variability Reducing Recognition Accuracy
Word-error rates for non-native English speakers remain 18-35 percentage points worse than native benchmarks. Google measured Indian English accuracy at 78.4%, far below the 94.2% for North American English, owing to retroflex consonants and code-switching gaps in training sets. In contact-center trials, accent diversity drove 22% higher human escalation, eroding the efficiency gains that voice automation promises. Collecting a 10,000-hour dialect corpus costs USD 800,000-1.2 million, an outlay only hyperscalers can absorb, thereby limiting competitive diversity and extending accent inequity.
*Our forecasts treat driver/restraint impacts as directional, not additive. The impact forecasts reflect baseline growth, mix effects, and variable interactions.
Segment Analysis
By Component: Services Gain Momentum as Customization Deepens
Services advanced from a supporting role to a growth engine as enterprises widen deployments beyond turnkey packages. Software retained 57.16% share in 2025, but services are slated to compound at 23.18% annually through 2031, eclipsing both software and hardware expansion. Large rollouts, such as a 2025 hospital implementation of Nuance DAX Copilot, demanded 180 integration hours, accent tuning for 40 physician vocabularies, and compliance documentation, yielding USD 340,000 in professional-services revenue per site. The voice user interface market size for services is therefore scaling faster than the core licensing pool, driven by recurring retraining needs as natural language evolves.
Hardware remains essential in the value chain, bundling beamforming microphones, digital signal processors, and neural processing units on cost-efficient dies. Anker’s Thus chip ships in multimillion-unit volumes at USD 4.20, bundling six-microphone arrays with 1 TOPS inference, elevating far-field capture quality. Continuous-learning contracts add another layer of stickiness: accuracy drifts 4-7 percentage points each year unless datasets are refreshed quarterly, creating annuity revenue for speech-specialist consultancies. This interdependence between code, silicon, and services sustains a balanced component mix even as customization accelerates.


By Deployment Mode: Cloud Dominance, Hybrid Reality
Cloud deployments controlled 63.22% of 2025 revenue, propelled by GPU pooling that drops inference cost to USD 0.005-0.02 per audio minute, well below on-premises economics. OpenAI’s GPT-4o voice mode hits 232-320 millisecond latency at USD 5 per million input tokens. Such metrics keep the voice user interface market leaning toward the cloud for complex reasoning and multimodal tasks. Nevertheless, hybrid routing processing wakes word triggers locally, then shipping only context-dependent queries has emerged as the operational norm, resolving 70-80% of standard utterances on-device and containing bandwidth demand.
On-premises installations, although smaller in absolute value, post an 18.90% CAGR due to data-sovereignty laws in China and India that forbid biometric prints from leaving national borders. iFlytek’s hospital deployments remain entirely inside local data centers to satisfy Personal Information Protection Law rules, lifting per-seat licenses 40% yet securing regulatory clearance. Multinational vendors must now sustain dual product tracks, public cloud and sovereign on-premises, raising engineering complexity but widening the voice user interface market share they can address without legal hindrance.
By Application Vertical: Healthcare Surges Past Consumer Electronics
Consumer electronics kept the lead with 36.08% of 2025 revenue, supported by the vast smart-speaker footprint, but healthcare has become the momentum story. Ambient clinical-intelligence systems shave 5.2 minutes from each patient visit, freeing capacity for two extra daily appointments and creating compelling return on investment at the physician level. Given a 25.91% CAGR, healthcare is on pace to narrow the gap by 2031, aided by strong reimbursement incentives, rising documentation mandates, and provider burnout concerns. The voice user interface market size for healthcare segments could therefore widen far beyond its current base if payers formally recognize conversational documentation savings.
Banking, financial services, and insurance used voice biometrics to cut fraud by USD 3.80 per interaction, giving the sector a 14.22% share in 2025. Retail, at 11.663.92%
%, shows slower growth because buyers still prefer visual confirmation for discretionary purchases, but voice ordering in quick-service restaurants is accelerating, especially as multi-lane drive-throughs adopt speech kiosks. Automotive adoption now straddles regulatory compulsion and convenience: European rules that restrict dashboard screen time force original equipment manufacturers to embed reliable voice for climate, navigation, and messaging.
By Technology Stack: Edge AI Establishes Regulatory and Latency Beachheads
Edge AI captured 43.90% of 2025 revenue and will pace the field with a 26.20% CAGR. Mercedes-Benz leverages NVIDIA DRIVE Orin to host a 1.3 billion-parameter model entirely on board, maintaining sub-200 millisecond round-trip even without cellular service. Regulations intensify the pull: China’s Personal Information Protection Law and India’s Digital Personal Data Protection Act forbid overseas transfer of voiceprints, making on-device inference a licensing prerequisite. These forces crystallize the voice user interface market share edge AI holds in regions where privacy and sovereignty converge.
Cloud-centric processing retains 38.70% share, favored for compute-intensive multimodal models that require 80 GB GPU footprints. Hybrid models split the difference, combining edge wake-word detection with cloud semantic parsing, creating efficient cost-latency trade-offs for mass-market speakers. Amazon’s USD 2.80 digital signal processor manages trigger detection then forwards audio upstream, shaving USD 6.50 off hardware bills while hitting sub-500 millisecond response benchmarks. As hybrid orchestration patents multiply, vendors solidify defensible positioning in a two-tier inference future.
Geography Analysis
North America led with 38.23% of 2025 revenue. A mature 300 million smart-speaker base and early Federal Trade Commission rule-setting gave enterprises legal clarity, prompting aggressive healthcare implementations. The region’s 20.80% forecast CAGR trails the global average because consumer penetration now plateaus at 62% of households. The United States accounts for 78% of regional revenue, locked in by ecosystem switching costs that deter users from leaving Alexa or Siri setups. Canada and Mexico, at 14% and 8% respectively, accelerate bilingual rollouts, leveraging recent improvements in code-switched accuracy.
Asia-Pacific posts the fastest 24.17% CAGR. China owns the majority of regional revenue on the strength of Baidu’s DuerOS, which fields 8.3 billion monthly queries across electric vehicles and smart homes. India holds a smaller slice, propelled by tier-2 city adoption and vernacular speech models that resonate with first-time internet users. Japan and South Korea emphasize on-device processing to align with 2025 privacy amendments, and the Association of Southeast Asian Nations markets struggle with dialect fragmentation, raising barriers to smaller entrants but opening room for regional champions.
Europe captures 21.40% of global revenue. Growth, forecast at 22.60% CAGR, is paced by automotive mandates requiring voice to mitigate driver distraction. However, EU Artificial Intelligence Act Tier-II disclosures add 8-12% compliance overhead, nudging smaller vendors to exit or partner. South America, though only 6.20% of worldwide revenue, expands at 23.40% CAGR behind Portuguese-language voice banking in Brazil. Middle East and Africa, at 5.80%, see early Arabic voice deployments, but dialect diversity and limited public corpora keep accuracy gaps wide, slowing uptake outside government and telecom pilots.

Competitive Landscape
Amazon, Google, Apple, Microsoft, and Baidu together controlled roughly 58% of consumer voice revenue in 2025, indicating moderate concentration. Hyperscalers treat speech interfaces as gateways to cloud-infrastructure consumption, pricing automatic speech recognition aggressively at USD 0.006 per 15 seconds or even open-sourcing models to expand GPU demand. Enterprise specialists Nuance, Cerence, and SoundHound defend 30-40% margins by bundling domain tuning, compliance consulting, and integration services that self-service APIs cannot replicate. Deepgram’s 98.5% accuracy in noisy call centers and rapid scale validated by its January 2026 acquisition of OfOne illustrate niche opportunities where quality trumps incumbency.
Edge-first disruptors such as Picovoice run wake-word engines on USD 0.80 microcontrollers, opening the sub-USD 20 device tier to reliable voice control. SoundHound’s April 2026 purchase of LivePerson’s voice unit merges orchestration with speech-to-text, cutting handle times by 38 seconds in pilot deployments. Patent filings reveal a strategic migration toward hybrid routing: Cerence lodged 14 applications in 2025 that dynamically shuttle queries between edge and cloud based on latency, battery, and complexity metrics, an approach that automotive original equipment manufacturers already adopt.
Regulation is the looming equalizer. Gartner estimates Tier-II conformity assessments will cost EUR 1.2-3.8 million annually, an amount easier for global giants to absorb. Smaller vendors pivot toward accent-specific or disability-focused niches, such as Voiceitt’s dysarthric speech recognition, funded by a March 2025 Series B round. Overall, the contest turns on specialized data, orchestration efficiency, and compliance agility rather than pure model accuracy.
Voice User Interface Industry Leaders
iFlytek Co., Ltd.
Verbit, Inc.
AppTek LLC
Speechmatics Ltd.
ReadSpeaker Holding B.V.
- *Disclaimer: Major Players sorted in no particular order

Recent Industry Developments
- March 2026: iFlytek debuted AI Glasses and AI Interpret Mic at Mobile World Congress, offering sub-2-second, 16-language translation with 91.3% accuracy.
- February 2026: ElevenLabs raised USD 500 million in Series D financing to scale text-to-speech and voice-cloning services that already process 1.2 billion characters monthly.
- February 2026: SoundHound AI opened a 200-engineer hub in Bengaluru to build Hindi, Tamil, Telugu, and Marathi models optimized for code-switching.
- January 2026: Apple and Google unveiled a multi-year pact to embed Gemini large-language models inside Siri, enabling the assistant to conduct multi-step tasks natively on 2 billion iOS devices.


Global Voice User Interface Market Report Scope
The Voice User Interface (VUI) Market refers to technologies that let users interact with devices, apps, and systems through spoken commands instead of touch or typing. It includes speech recognition, natural language processing, voice assistants, and integrated software used in smart devices, vehicles, appliances, and enterprise applications. The market is driven by growing adoption of contactless interfaces, smart home devices, in-car voice control, and accessibility-focused experiences.
The Voice User Interface Market Report is Segmented by Component (Software, Hardware, Services), Deployment Mode (On-Premises, Cloud), Application Vertical (Consumer Electronics, Automotive, Healthcare, BFSI, Retail and E-commerce, Education, Other Application Verticals), Technology Stack (Edge AI Processing, Cloud-Based Processing, Hybrid Processing), and Geography (North America, South America, Europe, Asia-Pacific, Middle East and Africa). The Market Forecasts are Provided in Terms of Value (USD).
| Software |
| Hardware |
| Services |
| On-Premises |
| Cloud |
| Consumer Electronics |
| Automotive |
| Healthcare |
| BFSI |
| Retail and E-commerce |
| Education |
| Other Application Verticals |
| Edge AI Processing |
| Cloud-Based Processing |
| Hybrid Processing |
| North America | United States | |
| Canada | ||
| Mexico | ||
| South America | Brazil | |
| Argentina | ||
| Rest of South America | ||
| Europe | Germany | |
| United Kingdom | ||
| France | ||
| Italy | ||
| Spain | ||
| Rest of Europe | ||
| Asia-Pacific | China | |
| Japan | ||
| India | ||
| South Korea | ||
| ASEAN | ||
| Rest of Asia-Pacific | ||
| Middle East and Africa | Middle East | Saudi Arabia |
| United Arab Emirates | ||
| Turkey | ||
| Rest of Middle East | ||
| Africa | South Africa | |
| Nigeria | ||
| Rest of Africa | ||
| By Component | Software | ||
| Hardware | |||
| Services | |||
| By Deployment Mode | On-Premises | ||
| Cloud | |||
| By Application Vertical | Consumer Electronics | ||
| Automotive | |||
| Healthcare | |||
| BFSI | |||
| Retail and E-commerce | |||
| Education | |||
| Other Application Verticals | |||
| By Technology Stack | Edge AI Processing | ||
| Cloud-Based Processing | |||
| Hybrid Processing | |||
| By Geography | North America | United States | |
| Canada | |||
| Mexico | |||
| South America | Brazil | ||
| Argentina | |||
| Rest of South America | |||
| Europe | Germany | ||
| United Kingdom | |||
| France | |||
| Italy | |||
| Spain | |||
| Rest of Europe | |||
| Asia-Pacific | China | ||
| Japan | |||
| India | |||
| South Korea | |||
| ASEAN | |||
| Rest of Asia-Pacific | |||
| Middle East and Africa | Middle East | Saudi Arabia | |
| United Arab Emirates | |||
| Turkey | |||
| Rest of Middle East | |||
| Africa | South Africa | ||
| Nigeria | |||
| Rest of Africa | |||


Key Questions Answered in the Report
How large is the voice user interface market today, and where will it be by 2031?
The voice user interface market size stood at USD 15.48 billion in 2025, is expected to reach USD 18.95 billion in 2026, and is projected to hit USD 52.08 billion by 2031, reflecting a 22.41% CAGR over 2026-2031.
Which component grows fastest through 2031?
Services post the highest forecast growth, expanding at a 23.18% CAGR as enterprises demand custom datasets, wake-word tuning, and compliance audits.
Which deployment model dominates revenue?
Cloud accounts for the largest 2025 share at 63.22% and continues to lead, supported by GPU pooling that lowers inference costs and simplifies updates.
What is the strongest growth geography?
Asia-Pacific shows the highest forecast CAGR at 24.17%, driven by Mandarin, Cantonese, and Indian-language model rollouts that outperform Western accuracy rates.
Where are voice interfaces having the biggest vertical impact?
Healthcare is the standout vertical, expected to grow at a 23.91% CAGR as ambient-documentation tools save physicians more than five minutes per patient encounter.
Why are edge AI chips critical for future adoption?
On-device neural processors eliminate network latency, comply with data-sovereignty laws in China and India, and cut cloud cost, pushing edge AI to a 24.17% CAGR.
Page last updated on:


