Liquid Packaging Market Size and Share
Market Overview
| Study Period | 2020 - 2031 |
|---|---|
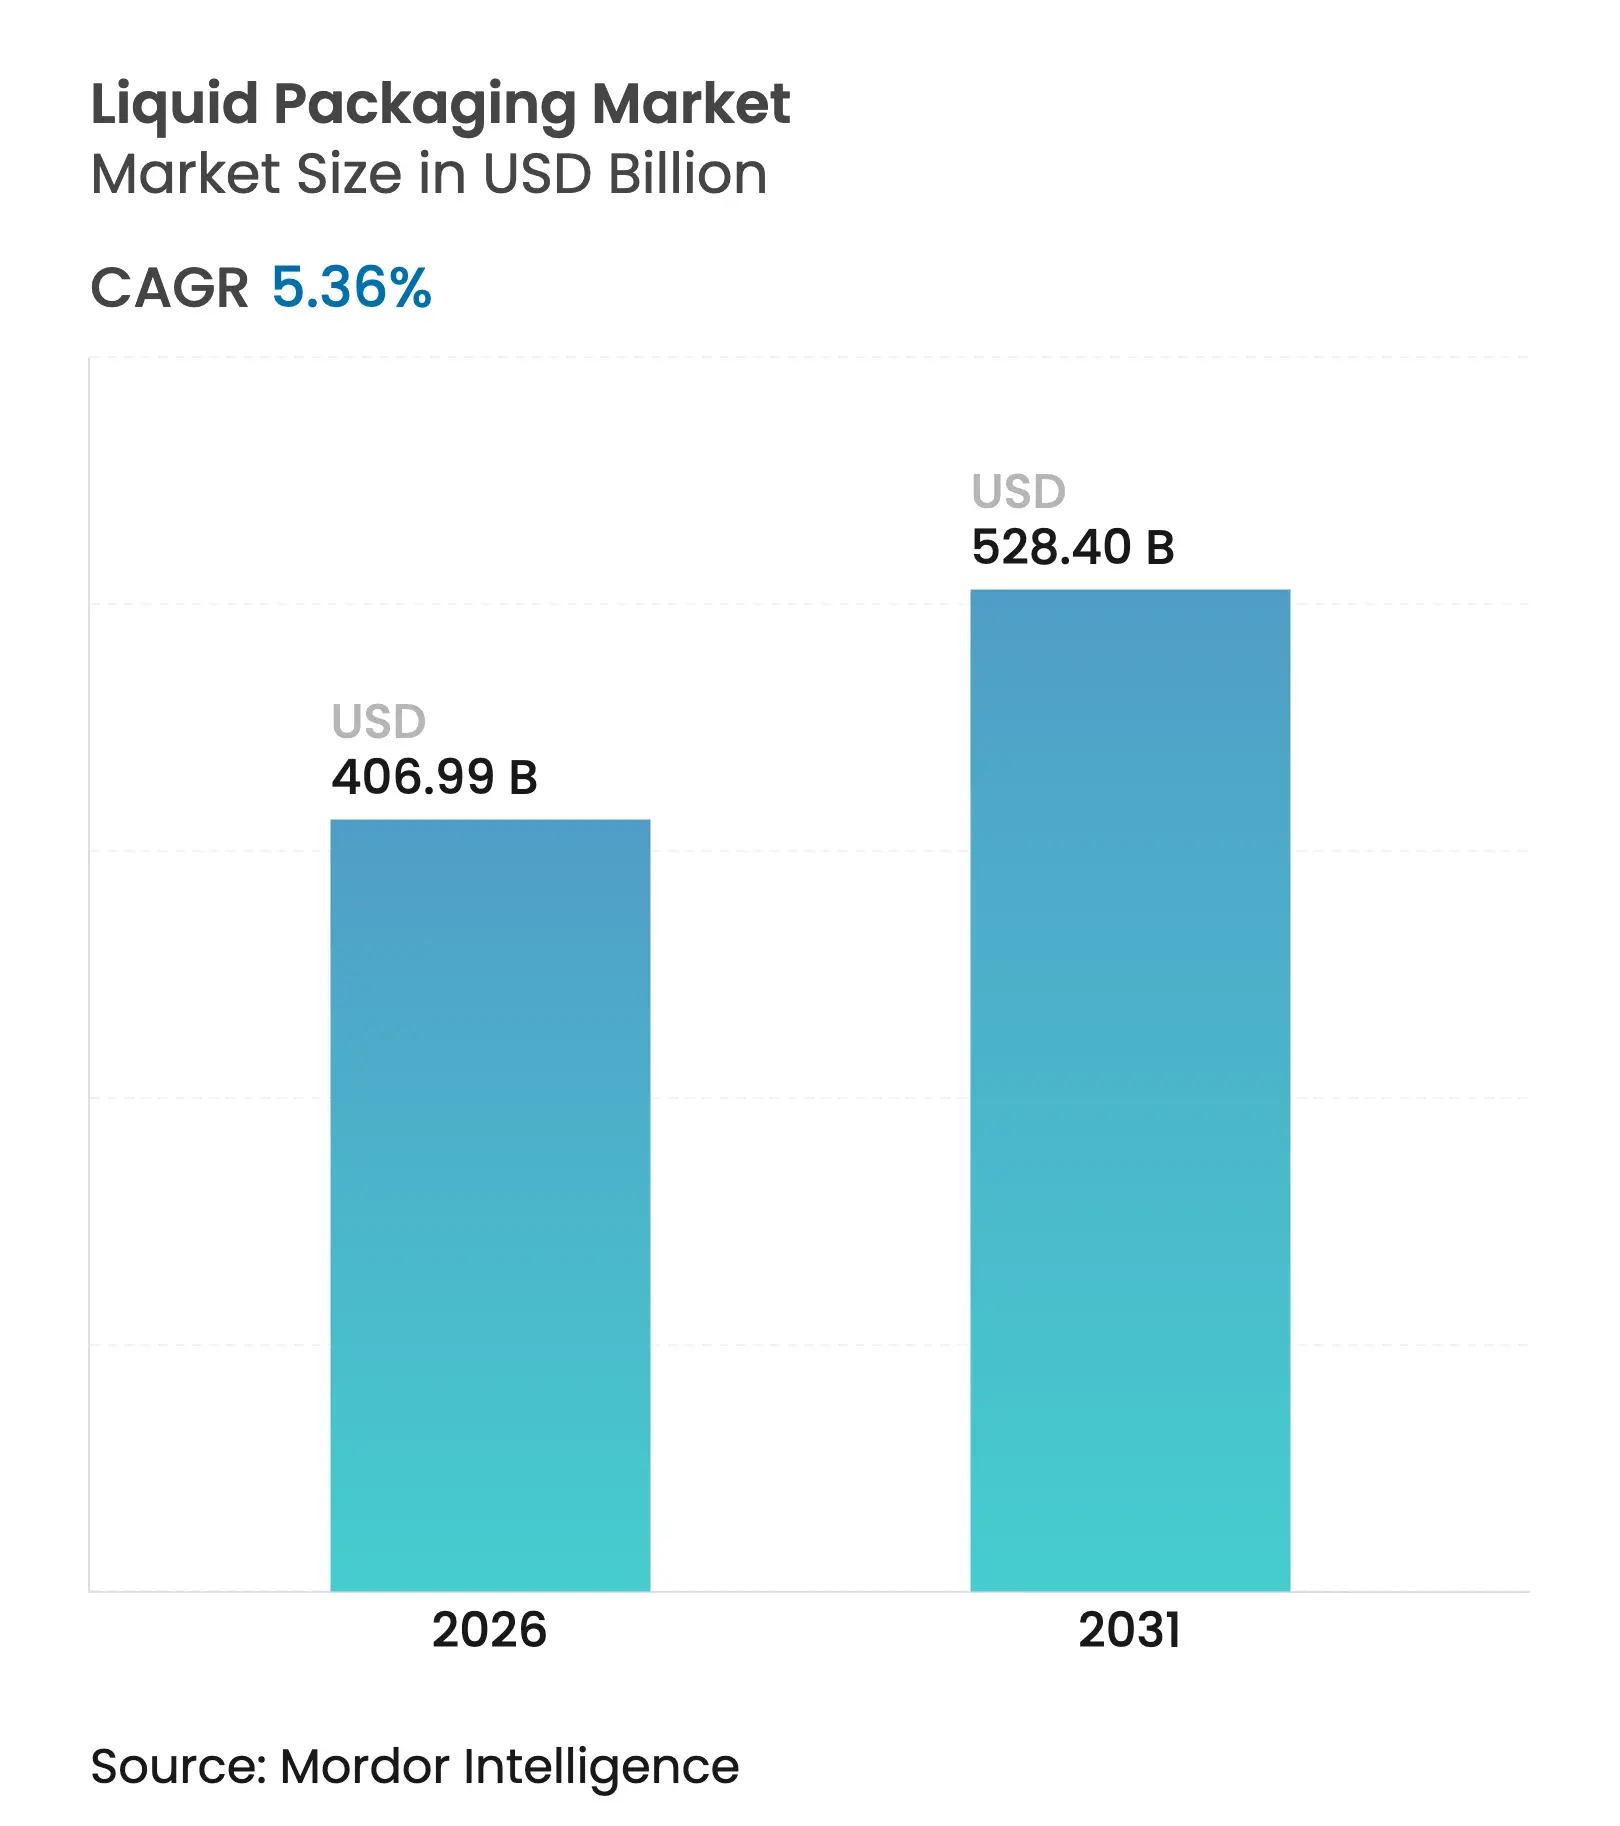
| Market Size (2026) | USD 406.99 Billion |
| Market Size (2031) | USD 528.4 Billion |
| Growth Rate (2026 - 2031) | 5.36 % CAGR |
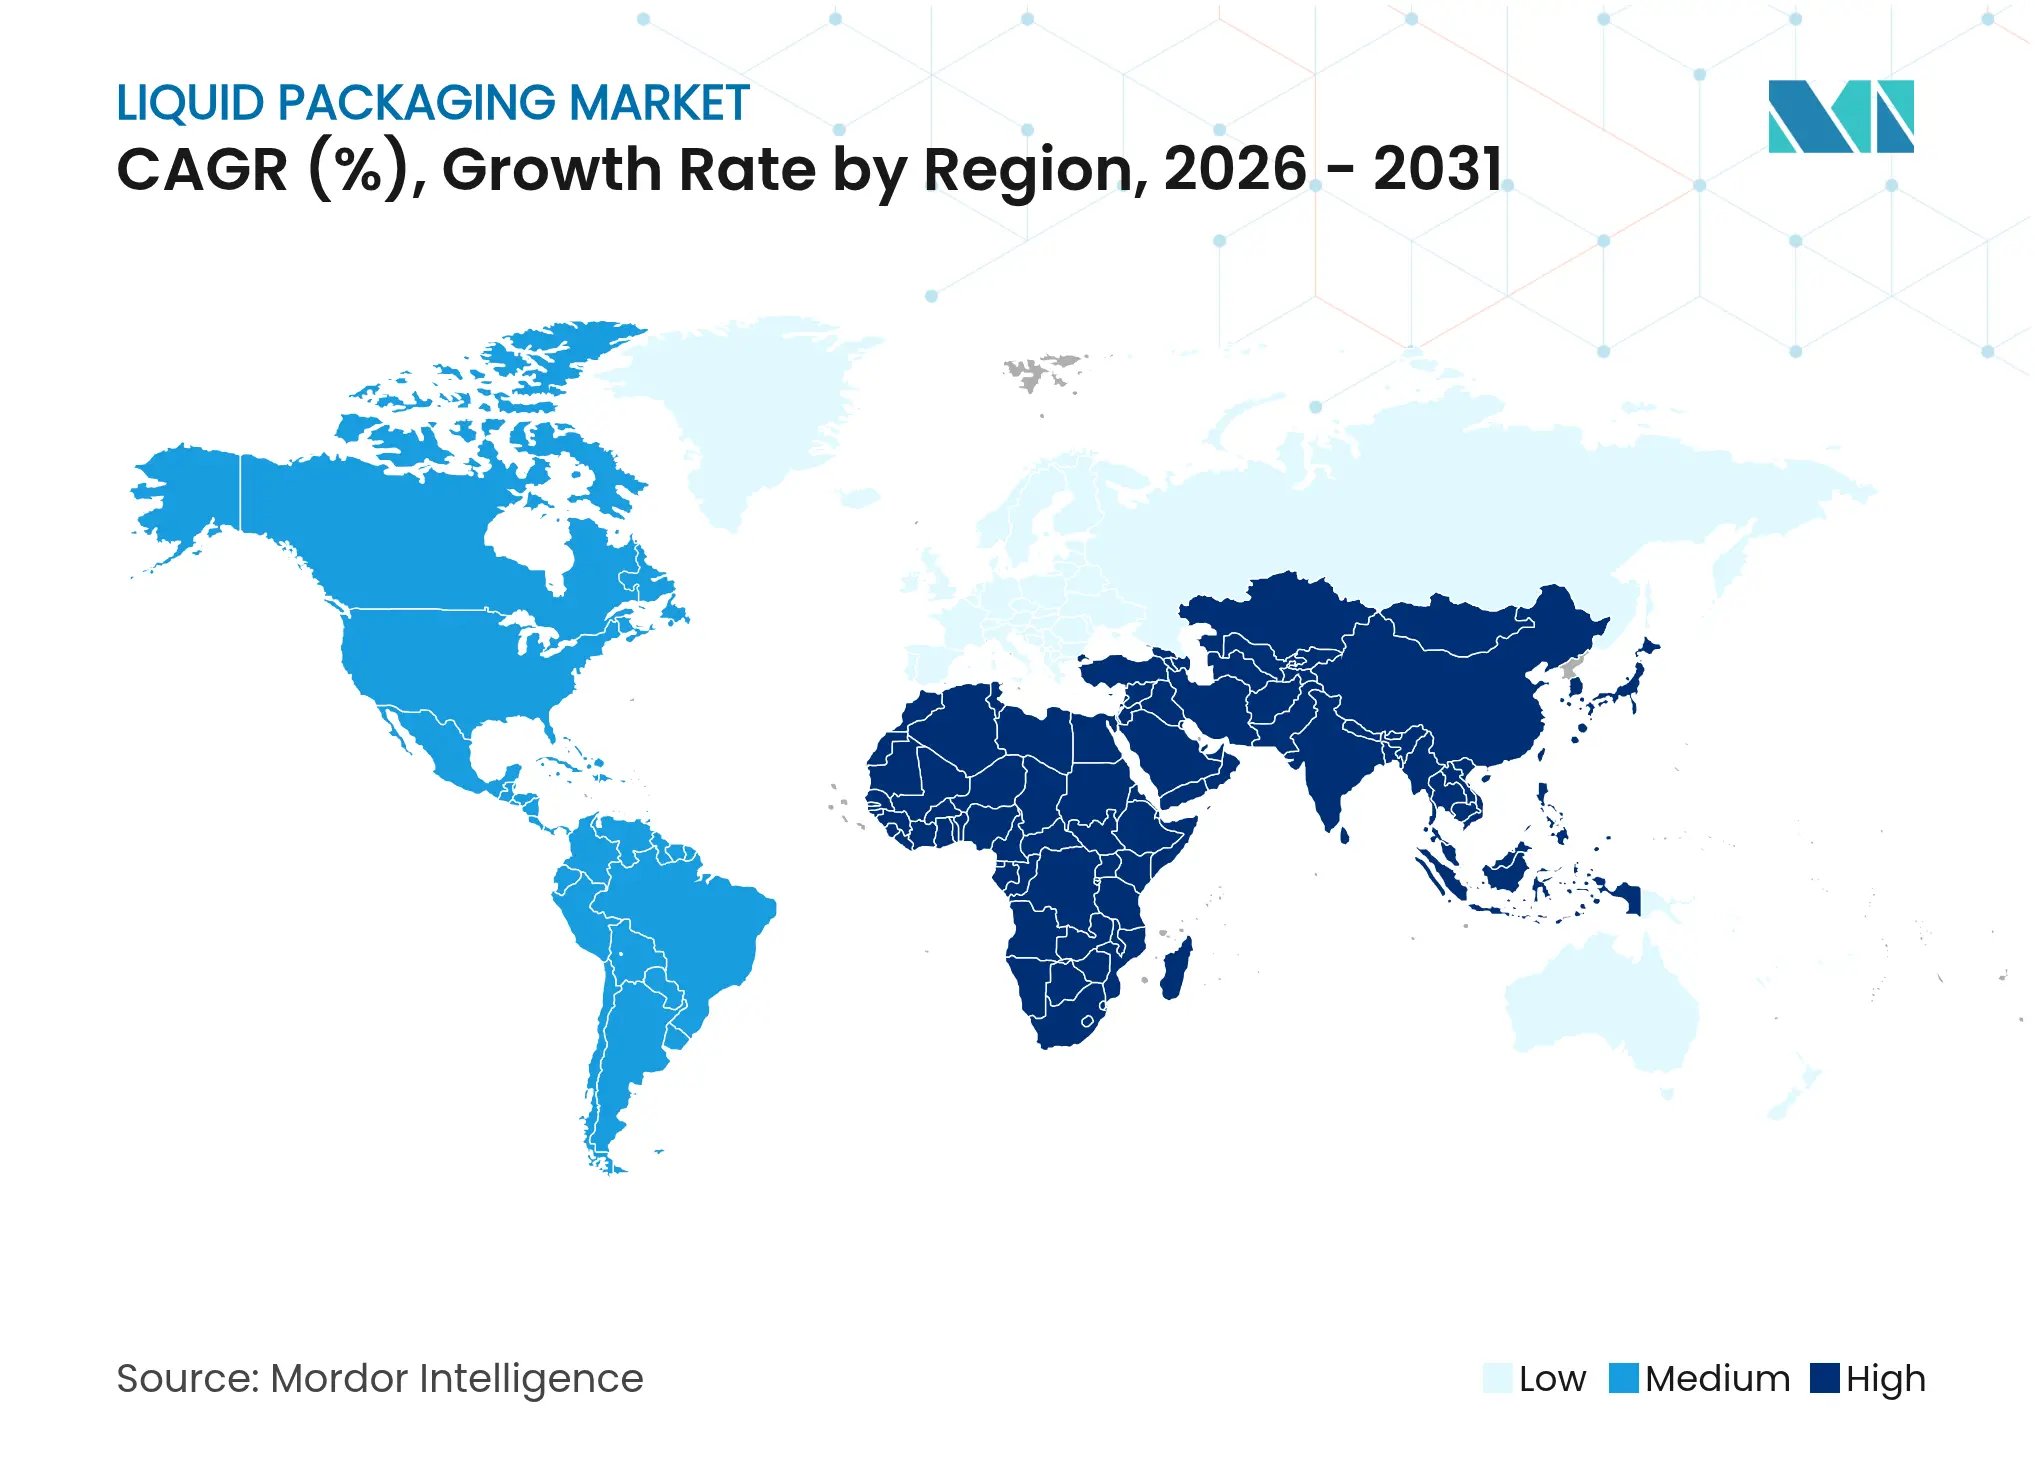
| Fastest Growing Market | Asia Pacific |
| Largest Market | Asia Pacific |
| Market Concentration | Low |
Major Players *Disclaimer: Major Players sorted in no particular order. Image © Mordor Intelligence. Reuse requires attribution under CC BY 4.0. |
Liquid Packaging Market Analysis by Mordor Intelligence
The liquid packaging market size was valued at USD 386.32 billion in 2025 and estimated to grow from USD 406.99 billion in 2026 to reach USD 528.4 billion by 2031, at a CAGR of 5.36% during the forecast period (2026-2031). Robust urbanization, especially in Asia-Pacific cities, is pushing brands to prioritize convenience-oriented formats while regulators tighten sustainability requirements. Material innovators continue to transform plastics into mono-material solutions that maintain barrier performance yet remain fully recyclable, helping brand owners future-proof portfolios against evolving Extended Producer Responsibility schemes. E-commerce growth is accelerating adoption of leak-proof bag-in-box and small-format pouches that can survive the parcel network without secondary over-pack, and pharmaceutical demand for blow-fill-seal sterility is driving an important technology shift. Established suppliers, led by Tetra Pak and SIG, have responded by launching aluminum-free cartons and carbon-reduced laminates to protect share in an increasingly eco-driven competitive arena.
Key Report Takeaways
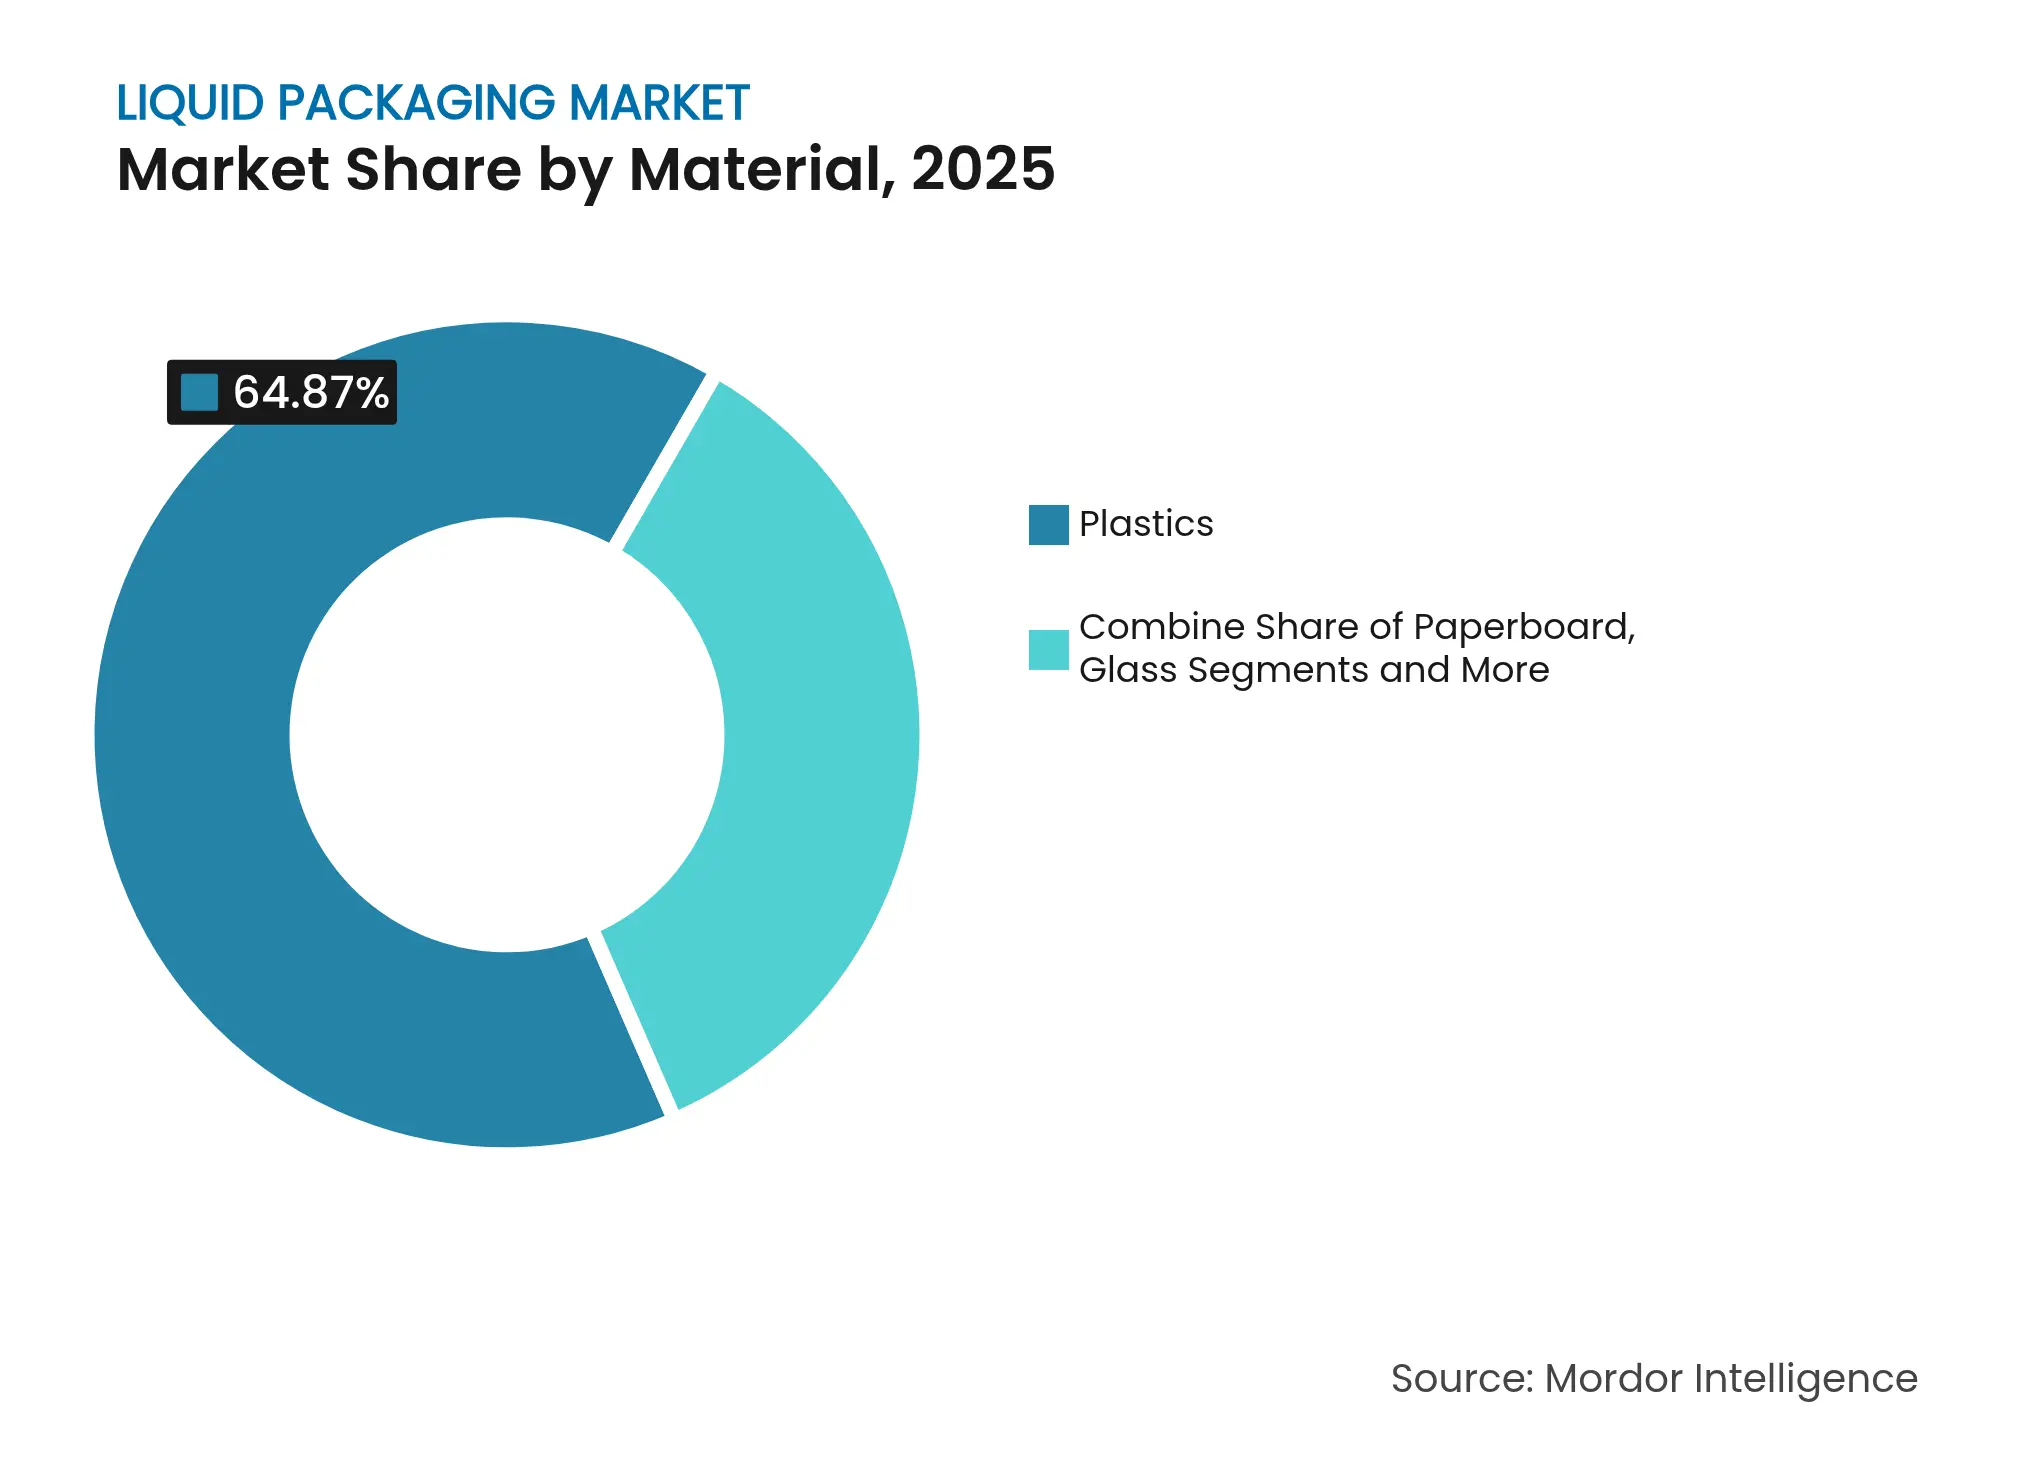
- By material, plastics commanded 64.87% of 2025 revenue, while “Other Plastics” are set to expand at an 8.47% CAGR to 2031.
- By packaging format, rigid containers retained 59.78% share in 2025; flexible formats are forecast to grow at 6.52% CAGR.
- By technology, form-fill-seal held 40.05% of the 2025 total; blow-fill-seal is the fastest mover at an 8.39% CAGR.
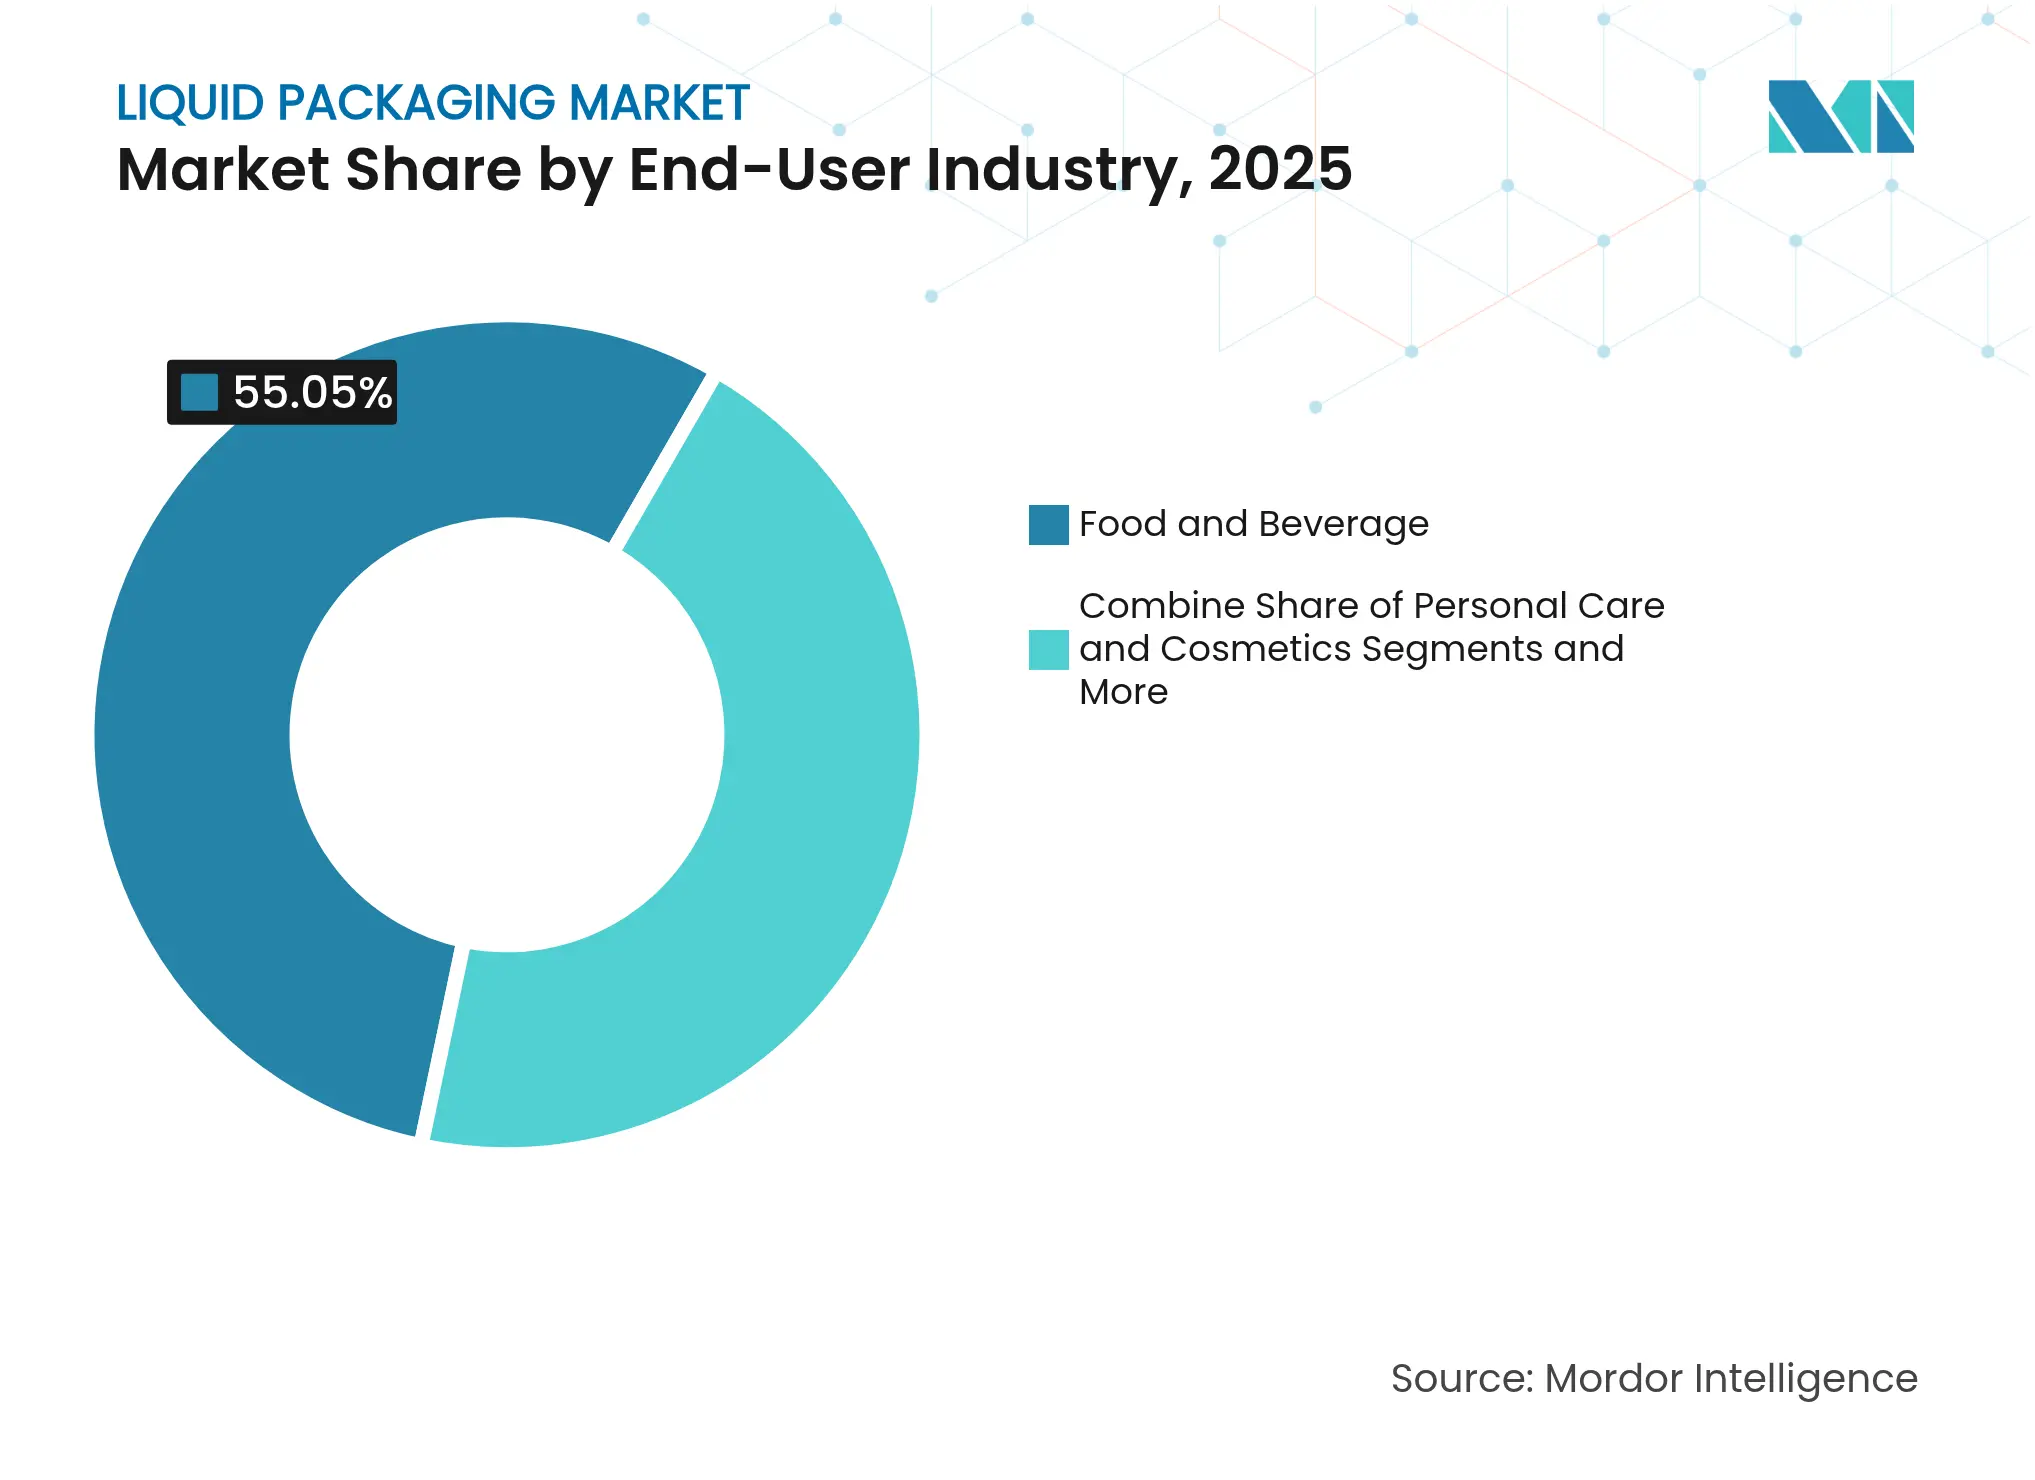
- By end-user, food & beverage generated 55.05% of 2025 revenue; pharmaceuticals and healthcare will outpace all others at a 7.54% CAGR.
- By container capacity, 1-10 L solutions represented 49.76% of 2025 sales; ≤1 L packs post the highest 6.78% CAGR.
- Asia-Pacific captured 39.85% of global revenue in 2025 and is projected to compound at 8.16% annually, the quickest regional climb.
Note: Market size and forecast figures in this report are generated using Mordor Intelligence's proprietary estimation framework, updated with the latest available data and insights as of 2026.
Global Liquid Packaging Market Trends and Insights
Drivers Impact Analysis
| Driver | (~) % Impact on CAGR Forecast | Geographic Relevance | Impact Timelin | |||
|---|---|---|---|---|---|---|
Rising urban demand for convenient formats Rising urban demand for convenient formats | +1.2% | Global, with highest impact in Asia-Pacific urban centers | Medium term (2-4 years) | (~) % Impact on CAGR Forecast:+1.2% | Geographic Relevance:Global, with highest impact in Asia-Pacific urban centers | Impact Timelin:Medium term (2-4 years) |
Brand-owner shift to mono-material flexible laminates Brand-owner shift to mono-material flexible laminates | +0.8% | Europe and North America leading, expanding to Asia-Pacific | Long term (≥ 4 years) | |||
On-premise beverage chains adopting aseptic PET for RTD On-premise beverage chains adopting aseptic PET for RTD | +0.6% | North America and Europe core markets, expanding globally | Short term (≤ 2 years) | |||
E-commerce demand for leak-proof bag-in-box E-commerce demand for leak-proof bag-in-box | +0.9% | Global e-commerce markets, strongest in developed economies | Medium term (2-4 years) | |||
Chemical-resistant IBC growth in circular supply chains Chemical-resistant IBC growth in circular supply chains | +0.7% | Industrial regions globally, particularly Europe and North America | Long term (≥ 4 years) | |||
| Source: Mordor Intelligence | ||||||
Rising Urban Demand for Convenient Formats
City living is elevating single-serve, reclosable and lightweight primary packs that fit busy commuter routines. Spouted pouches now hold more than 30% of baby-food packaging in North America, propelled by Cheer Pack’s dominance. [1]Cheer Pack North America, “Food & Beverage,” cheerpack.comJapanese beverage producers boosted sub-500 ml output throughout 2025, mirroring consumption surveys that favor portion control in rail-commute societies. The ≤1 L segment, already the fastest rising component of the liquid packaging market, is scheduled to compound at 7.12% CAGR on the back of these urban preferences.
Brand-Owner Shift to Mono-Material Flexible Laminates
Global brand owners are dismantling complex multilayer laminates in favor of PE- or PP-based mono-material films that allow curbside recycling. DNP’s commercial roll-out of oxygen-barrier mono-PE sachets, certified by CEFLEX, keeps moisture ingress low enough for dairy and coffee concentrate. [2]DNP Group, “DNP’s Mono-Material Packaging,” global.dnp Saica’s Monoflex and Greenheart lines replicate these gains while introducing 40% PCR content. Early adopters such as Capri-Sun have validated consumer acceptance, removing a key commercial hurdle and boosting the liquid packaging market momentum.
On-Premise Beverage Chains Adopting Aseptic PET for RTD
High-throughput aseptic PET lines that sterilize, fill and cap within one block are now producing 36,000 bph, turning cost models in favor of cold-chain-free distribution. With RTD coffee alone heading toward USD 64.78 billion by 2032, beverage chains are leveraging the format to standardize shelf life across geographies. This driver lifts the liquid packaging market by lowering energy use in chilled logistics and opening new retail points unconstrained by refrigerators.
E-Commerce Demand for Leak-Proof Bag-in-Box
Spike growth in direct-to-consumer liquid shipping has made puncture-resistant bag-in-box the e-commerce default for syrups, cocktails and edible oils. SIG’s aseptic variants ensure full shelf stability without adding cold packs. [3]SIG, “Bag-in-Box Packaging,” sig.biz Smurfit Westrock’s EasySplit design enables >90% recyclability after fiber-polymer separation, satisfying EU waste mandates. Consumers gain nearly complete product evacuation, curbing in-home waste and reinforcing the liquid packaging market adoption curve.
Restraints Impact Analysis
| Restraint | (~) % Impact on CAGR Forecast | Geographic Relevance | Impact Timeline | |||
|---|---|---|---|---|---|---|
PFAS legislation restricting barrier coatings PFAS legislation restricting barrier coatings | -1.1% | United States and European Union, expanding to other regions | Short term (≤ 2 years) | (~) % Impact on CAGR Forecast:-1.1% | Geographic Relevance:United States and European Union, expanding to other regions | Impact Timeline:Short term (≤ 2 years) |
Food-grade rPET shortage inflating costs Food-grade rPET shortage inflating costs | -0.8% | Global, with acute impact in Europe and North America | Medium term (2-4 years) | |||
Volatile EVOH and aluminum prices hitting multilayer cartons Volatile EVOH and aluminum prices hitting multilayer cartons | -0.6% | Global manufacturing regions, particularly Asia-Pacific | Short term (≤ 2 years) | |||
| Source: Mordor Intelligence | ||||||
PFAS Legislation Restricting Barrier Coatings
A wave of state-level PFAS prohibitions coupled with the FDA’s withdrawal of 35 food-contact approvals is compelling converters to re-engineer grease- and moisture-barrier chemistries. [4]U.S. FDA, “FDA Determines Authorization for 35 Food Contact Notifications Related to PFAS Are No Longer Effective,” fda.gov Industry is pivoting to water-based acrylic and biopolymer coatings, yet performance gaps remain for high-temperature and high-fat applications. Capital outlays for line retrofits and qualification testing are dampening the liquid packaging market in the near term.
Food-Grade rPET Shortage Inflating Costs
European rPET spot prices climbed to USD 1,810 per ton in early 2025, widening the delta over virgin PET and stressing converters bound by recycled-content directives. Limited FDA-approved reprocessors in emerging economies compound global scarcity. Brand owners face difficult trade-offs between price stability and meeting the 25% recycled-content rule in beverage bottles, pressuring margins and slowing conversion projects within the liquid packaging market.
Segment Analysis
By Material: Plastics Lead as Circular Solutions Accelerate
Plastics held 64.87% share in 2025 within the liquid packaging market, a position that reflects unbeatable cost-to-performance ratios in food, dairy and personal-care lines. Yet regulatory zeal is fast-tracking lightweighting, bio-based resins and PCR integration across the board. “Other Plastics” such as bio-PEF and chemically recycled PP are expanding at 8.47% CAGR, driven by Avantium’s commercial PEF bottles and growing drop-in compatibility with municipal sortation streams.
Paperboard’s progress is tied to fiber-barrier breakthroughs like Koehler’s NexPlus, which promises twenty-five recycle loops against plastic’s lower cycles. Glass remains a prestige choice for premium spirits, while metal’s closed-loop recyclability keeps aluminum bottles and aerosol cans in brand sustainability playbooks. Overall, plastics will continue to anchor the liquid packaging market through 2031, albeit in progressively circular forms that satisfy both corporate and policy mandates.
Note: Segment shares of all individual segments available upon report purchase
By Packaging Format: Rigid Dominance Faces Flexible Momentum
Rigid containers controlled 59.78% of 2025 revenue and continue to benefit from entrenched filling lines and broad consumer acceptance. However, flexible formats are on track for a 6.52% CAGR, reshaping the liquid packaging market narrative around material efficiency and e-commerce readiness. Spouted pouches, responsible for double-digit share in infant nutrition, epitomize consumer readiness to trade rigidity for portability.
Bag-in-box technologies multiply those savings at warehouse scale, protecting products while reducing cube weight in parcel freight. Rigid vessels respond through lightweight PET resins and aluminum bottle investments that preserve tactile familiarity while trimming carbon intensity. A hybrid future is emerging in which collapsible inner bags pair with outer returnable shells, effectively blending the strengths of both formats inside the liquid packaging market.
By Technology: Form-Fill-Seal Stability Meets Blow-Fill-Seal Growth
Form-fill-seal remains the backbone at 40.05% share because lines are capitalized, operators are trained and spare parts are abundant. Conversely, blow-fill-seal machines are registering an 8.39% CAGR as biologics and ophthalmic therapies demand hermetic integrity with minimal human contact. BFS lines, able to mold, fill and seal within seconds, fit ISO-5 classified environments and simplify validation procedures, making them particularly appealing to the pharmaceutical slice of the liquid packaging market.
Aseptic carton lines also maintain relevance by eliminating cold-chain costs for dairy-alternative drinks and shelf-stable soups. Hot-fill continues in acidic beverage niches, while cold-fill protects vitamin-rich products from thermal degradation. Looking ahead, robotics and inline inspection will target waste-rate reductions, amplifying technology’s role as a competitive lever inside the liquid packaging market.

Recognized by Experts. Trusted by Leaders.
A trusted intelligence partner to global decision-makers across 90+ countries.


By End-User Industry: Food & Beverage Stability, Healthcare Upswing
The food & beverage community generated 55.05% of 2025 value, benefiting from daily-use velocity and brand experimentation in flavor and function. Meanwhile, healthcare applications are marching at a 7.54% CAGR amid rising biologics, vaccine and personalized-medicine volumes that mandate sterile and traceable primary packs. The liquid packaging market therefore finds itself balancing high-throughput commodity drinks with low-volume, high-margin injectable solutions.
Personal-care formulators are also migrating toward aluminum aerosol bottles and post-consumer resin content to match eco-aware shoppers. Industrial lubricants prefer UN-certified IBCs that align with Safety-Data-Sheet revisions and transport regulations. Cross-industry diversification shields packaging suppliers from isolated demand shocks and keeps R&D pipelines fueled within the liquid packaging market.
Note: Segment shares of all individual segments available upon report purchase
By Container Capacity: Mid-Range Dominance Confronts Small-Format Premium
Containers sized 1-10 L represented 49.76% of all sales in 2025 as foodservice and institutional buyers rely on bulk efficiencies. Yet ≤1 L packs log the highest 6.78% CAGR, mirroring urban lifestyles that value portability and premium cues in craft beverages and functional shots. Their role in the liquid packaging market demonstrates how shifting consumption occasions redefine optimal pack geometry.
Large-volume IBCs ranging 10-1,000 L continue to penetrate chemical loops thanks to CHEP-style pooling that cuts capex for shippers while slashing single-trip waste. With UN and DOT credentials, these totes preserve worker safety and product integrity over multiple reuse cycles, reinforcing a circular narrative across industrial supply chains anchored to the liquid packaging market.
Geography Analysis
Asia-Pacific held 39.85% of 2025 revenue in the liquid packaging market and is predicted to expand at 8.16% CAGR through 2031. China’s machinery suppliers, led by TECH-LONG, are scaling turnkey lines that extend high-speed capability beyond domestic beverage giants. Japanese converters have introduced carton water that incorporates 30% domestically sourced thinned wood, signaling the region’s commitment to forestry stewardship. Population density, rising income and pro-recycling policy momentum converge to sustain the region’s leadership.
North America combines stringent PFAS bans with deep technology benches, resulting in early adoption of aluminum-free cartons and aseptic PET infrastructure. KHS’s high-output aseptic blocks and Westrock Coffee’s RTD lines illustrate the capital investment wave now coursing through the United States beverage sector. Consumer demand for traceable, low-carbon formats is pushing resin suppliers and fillers alike to mine new PCR streams, anchoring future growth in the regional liquid packaging market.
Europe’s influence stems from policy. The forthcoming EU Packaging Regulation sets recyclability, reuse and recycled-content thresholds that effectively dictate global standards. Material scientists in Germany and the Nordics have launched molded-fiber and mono-material breakthroughs at commercial scale, a testament to public-private R&D synergy. The continent’s coordinated deposit-return schemes also guarantee high rPET recovery rates, positioning it as both a demanding and opportunity-rich arena within the global liquid packaging market.

Competitive Landscape
Market Concentration
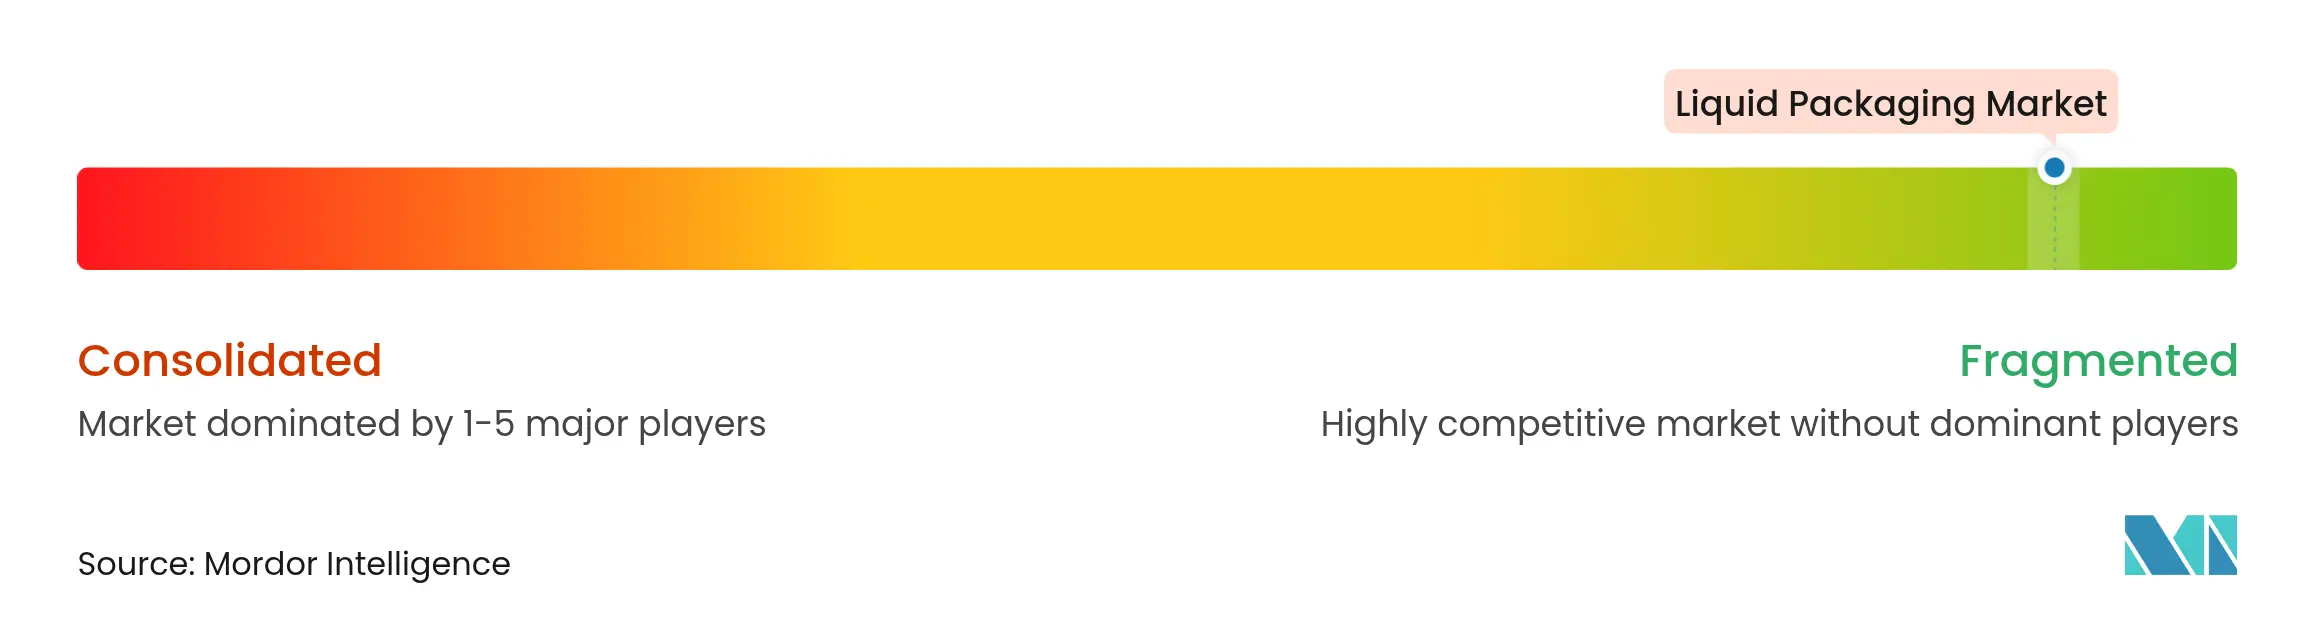
The liquid packaging market is fragmented. Tetra Pak, SIG, Amcor and Elopak leverage decades-old customer networks, proprietary filling systems and integrated material science to secure volume and margin. SIG’s Terra aluminum-free board trimmed carbon output by 61% without sacrificing 12-month shelf life, allowing brands to lower Scope 3 emissions on high-turnover SKUs. Tetra Pak collaborates with Lund University to commercialize plant-based polymers that meet drop-in performance benchmarks.
Partnerships are expanding beyond traditional supply chains. Metsä Group and Amcor’s joint molded-fiber trial illustrates a shift toward collaborative problem-solving that compresses development timelines. Digitalization is another frontier: Gerresheimer’s Gx Cap pairs medication vials with Bluetooth sensors that capture adherence data for healthcare providers. Mid-tier participants, including DS Smith and Smurfit Kappa, excel at e-commerce optimization and fiber innovation, plugging niche gaps left by the top tier.
Disruption potential arises from biopolymer incumbents such as Avantium and specialty recyclers exploring solvent-based depolymerization. While capital intensity and food-contact approvals remain barriers, their technologies promise reduced reliance on virgin petrochemicals. Competitive positioning will therefore depend on a blend of open innovation, circular economy alignment and regulatory foresight inside the liquid packaging market.
Liquid Packaging Industry Leaders

*Disclaimer: Major Players sorted in no particular order
Recent Industry Developments
- May 2025: SIG launched the first aluminum-free full-barrier carton, lifting paper content above 80% and cutting carbon footprint up to 61% .
- January 2025: DS Smith released TailorTemp fiber-based pharma shippers maintaining 36-hour cool-chain integrity
- January 2025: Ball Corporation invested in Meadow to manufacture fully recyclable aluminum personal-care cans using KAPSUL technology
- November 2024: Smurfit Westrock unveiled EasySplit bag-in-box, meeting EU recyclability thresholds above 90%
Table of Contents for Liquid Packaging Industry Report
1. INTRODUCTION
- 1.1Study Assumptions and Market Definition
- 1.2Scope of the Study
2. RESEARCH METHODOLOGY
3. EXECUTIVE SUMMARY
4. MARKET LANDSCAPE
- 4.1Market Drivers
- 4.1.1Rising urban demand for convenient formats
- 4.1.2Brand-owner shift to mono-material flexible laminates
- 4.1.3On-premise beverage chains adopting aseptic PET for RTD
- 4.1.4E-commerce demand for leak-proof bag-in-box
- 4.1.5Chemical-resistant IBC growth in circular supply chains
- 4.2Market Restraints
- 4.2.1PFAS legislation restricting barrier coatings
- 4.2.2Food-grade rPET shortage inflating costs
- 4.2.3Volatile EVOH and aluminum prices hitting multilayer cartons
- 4.3Supply-Chain Analysis
- 4.4Regulatory Landscape
- 4.5Technological Outlook
- 4.6Porter's Five Forces Analysis
- 4.6.1Bargaining Power of Suppliers
- 4.6.2Bargaining Power of Buyers
- 4.6.3Threat of New Entrants
- 4.6.4Threat of Substitutes
- 4.6.5Intensity of Rivalry
- 4.7Recycling and Sustainability Landscape
5. MARKET SIZE AND GROWTH FORECASTS (VALUE)
- 5.1By Material
- 5.1.1Paperboard
- 5.1.2Plastics
- 5.1.2.1Polyethylene (PE)
- 5.1.2.2Polypropylene (PP)
- 5.1.2.3Other Plastics
- 5.1.3Glass
- 5.1.4Metal (Aluminum, Steel)
- 5.2By Packaging Format
- 5.2.1Flexible Packaging
- 5.2.1.1Pouches
- 5.2.1.2bag-in-box
- 5.2.1.3Other Flexible Packaging
- 5.2.2Rigid Packaging
- 5.2.2.1Bottles
- 5.2.2.2Cans
- 5.2.2.3Other Rigid Packaging
- 5.3By Technology
- 5.3.1Aseptic Liquid Packaging
- 5.3.2Blow-Fill-Seal
- 5.3.3Form-Fill-Seal
- 5.3.4Hot-Fill / Cold-Fill
- 5.4By End-User Industry
- 5.4.1Food and Beverage
- 5.4.2Personal Care and Cosmetics
- 5.4.3Pharmaceutical and Healthcare
- 5.4.4Household Care
- 5.4.5Industrial Chemicals and Lubricants
- 5.5By Container Capacity
- 5.5.1≤1 L
- 5.5.21–10 L
- 5.5.310-1,000 L (IBCs and drums)
- 5.6By Geography
- 5.6.1North America
- 5.6.1.1United States
- 5.6.1.2Canada
- 5.6.1.3Mexico
- 5.6.2Europe
- 5.6.2.1Germany
- 5.6.2.2United Kingdom
- 5.6.2.3France
- 5.6.2.4Italy
- 5.6.2.5Spain
- 5.6.2.6Russia
- 5.6.2.7Rest of Europe
- 5.6.3Asia-Pacific
- 5.6.3.1China
- 5.6.3.2India
- 5.6.3.3Japan
- 5.6.3.4South Korea
- 5.6.3.5Australia and New Zealand
- 5.6.3.6Rest of Asia-Pacific
- 5.6.4Middle East and Africa
- 5.6.4.1Middle East
- 5.6.4.1.1United Arab Emirates
- 5.6.4.1.2Saudi Arabia
- 5.6.4.1.3Turkey
- 5.6.4.1.4Rest of Middle East
- 5.6.4.2Africa
- 5.6.4.2.1South Africa
- 5.6.4.2.2Nigeria
- 5.6.4.2.3Egypt
- 5.6.4.2.4Rest of Africa
- 5.6.5South America
- 5.6.5.1Brazil
- 5.6.5.2Argentina
- 5.6.5.3Rest of South America
6. COMPETITIVE LANDSCAPE
- 6.1Market Concentration
- 6.2Strategic Moves
- 6.3Market Share Analysis
- 6.4Company Profiles (includes Global level Overview, Market level overview, Core Segments, Financials as available, Strategic Information, Market Rank/Share, Products and Services, Recent Developments)
- 6.4.1Amcor plc
- 6.4.2Tetra Pak (Tetra Laval)
- 6.4.3SIG Group AG
- 6.4.4Mondi plc
- 6.4.5Sealed Air Corp.
- 6.4.6Smurfit WestRock
- 6.4.7Huhtamaki Oyj
- 6.4.8Elopak ASA
- 6.4.9Liquibox (Sealed Air)
- 6.4.10Guala Pack S.p.A
- 6.4.11Crown Holdings Inc.
- 6.4.12Ball Corporation
- 6.4.13International Paper Co.
- 6.4.14Uflex Ltd.
- 6.4.15Gerresheimer AG
- 6.4.16Ardagh Group
- 6.4.17Comar LLC
- 6.4.18ProAmpac Intermediate Inc.
7. MARKET OPPORTUNITIES AND FUTURE OUTLOOK
- 7.1White-space and Unmet-need Assessment
Global Liquid Packaging Market Report Scope
Liquid packaging employs specialized materials and technologies to contain and safeguard various liquid products. This packaging solution caters to various liquids, ranging from beverages and edible oils to pharmaceuticals and industrial chemicals. The research also examines underlying growth influencers and significant industry vendors, all of which help to support market estimates and growth rates throughout the anticipated period. The market estimates and projections are based on the base year factors and arrived at top-down and bottom-up approaches.
The liquid packaging market is segmented by material (Paperboard, Plastic, Glass, and Metal), by packaging type (Flexible and Rigid), by technology (Aseptic Liquid Packaging, Blow Molding, and Form Fill Seal), by end-user industry (Food and Beverage, Personal Care, Pharmaceutical, Household Care, Industrial and Other End-User Industries) and by geography (North America, Europe, Asia Pacific, South America and Middle East and Africa), The market sizing and forecasts are provided in terms of value (USD) for all the above segments.