Molded Pulp Packaging Market Size and Share
Market Overview
| Study Period | 2020 - 2031 |
|---|---|
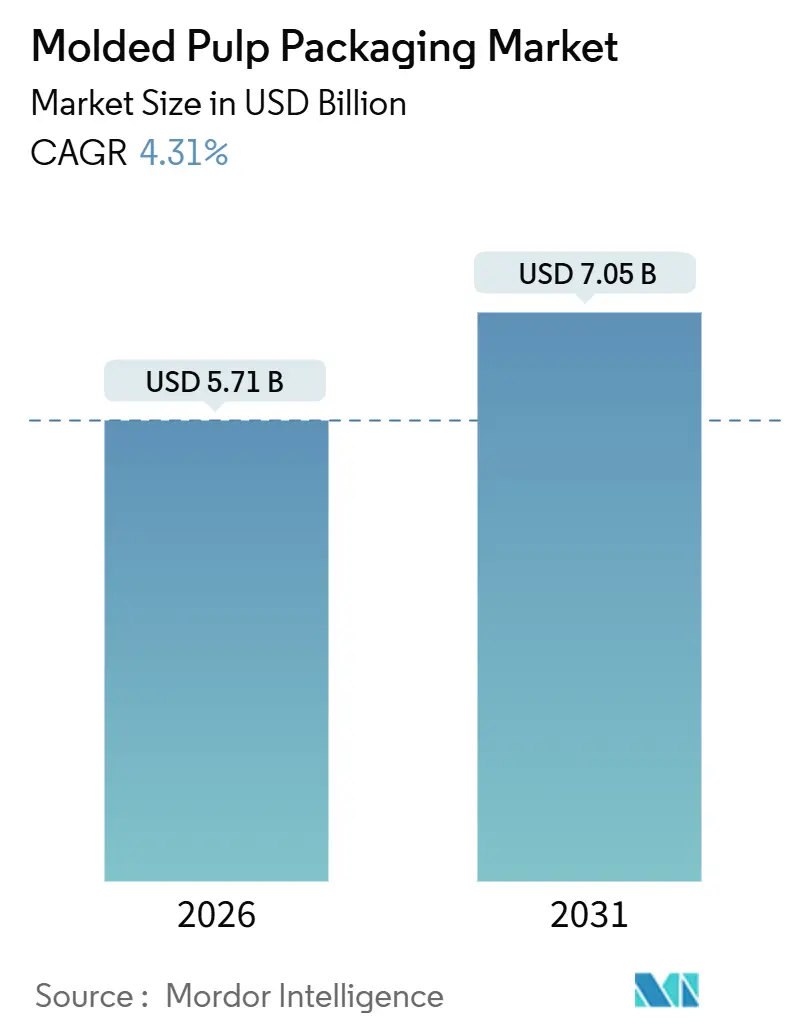
| Market Size (2026) | USD 5.71 Billion |
| Market Size (2031) | USD 7.05 Billion |
| Growth Rate (2026 - 2031) | 4.31% CAGR |
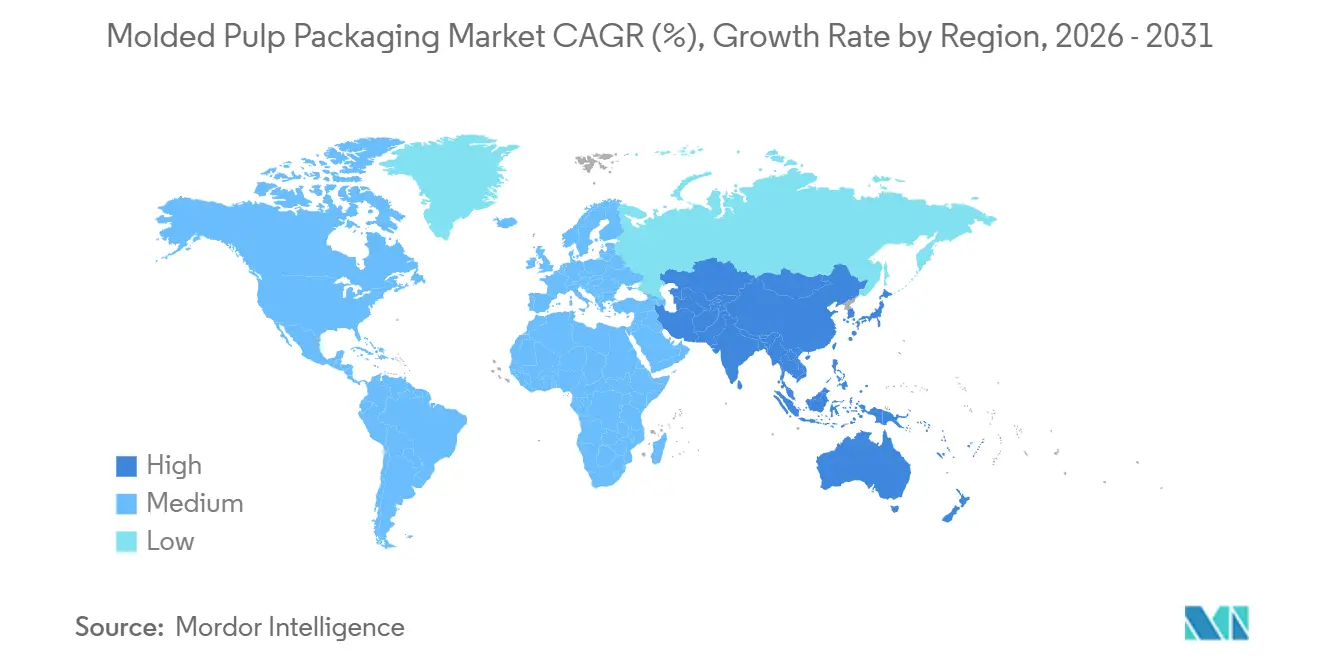
| Fastest Growing Market | Middle East |
| Largest Market | North America |
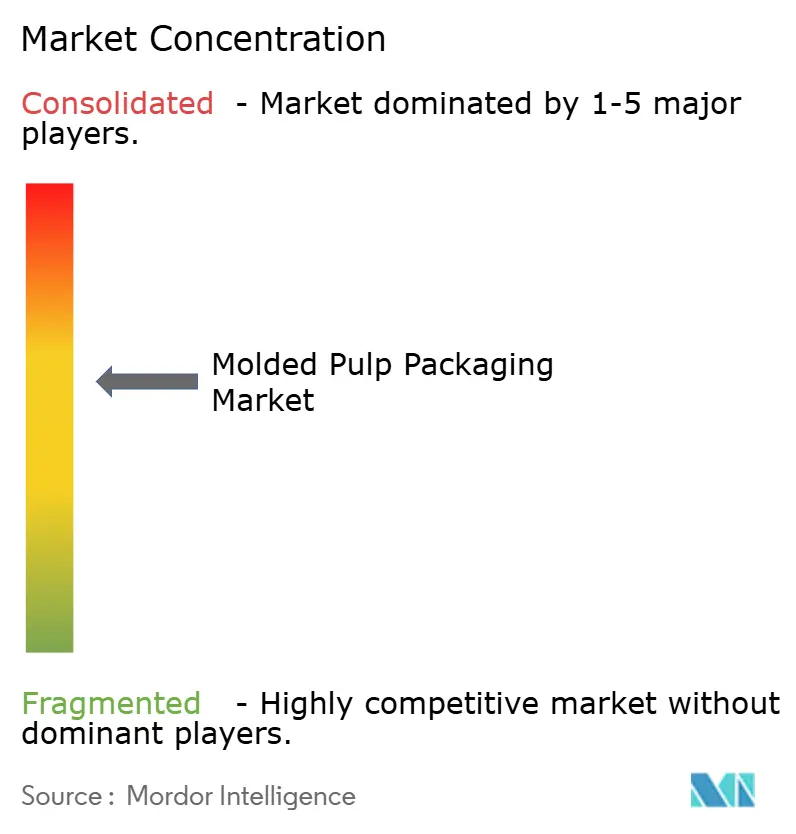
| Market Concentration | Medium |
Major Players *Disclaimer: Major Players sorted in no particular order Image © Mordor Intelligence. Reuse requires attribution under CC BY 4.0. | |
Molded Pulp Packaging Market Analysis by Mordor Intelligence
The molded pulp packaging market size stands at USD 5.71 billion in 2026 and is projected to reach USD 7.05 billion by 2031, advancing at a 4.31% CAGR. The growth trajectory is propelled by regulatory bans on single-use plastics in more than 100 countries, retailer scorecards that now rank recyclability ahead of unit cost, and rapid e-commerce expansion that favors curbside-recyclable protective fillers. Multinational brands are aligning with the European Union’s 2030 recyclability mandate and California’s SB 54 timeline, prompting suppliers to phase out polystyrene in favor of fiber-based alternatives[1]Source: European Commission, “Packaging and Packaging Waste,” ec.europa.eu. Technology leaps, including dry-molded-fiber processes that cut cycle time from minutes to seconds, are compressing the historical cost gap with injection-molded plastics. While recycled fiber anchors price competitiveness, blended formulations that pair recycled economics with virgin-fiber performance are accelerating, and geographic hot spots such as the Middle East are drawing fresh capital as local circular-economy targets gain momentum.
Key Report Takeaways
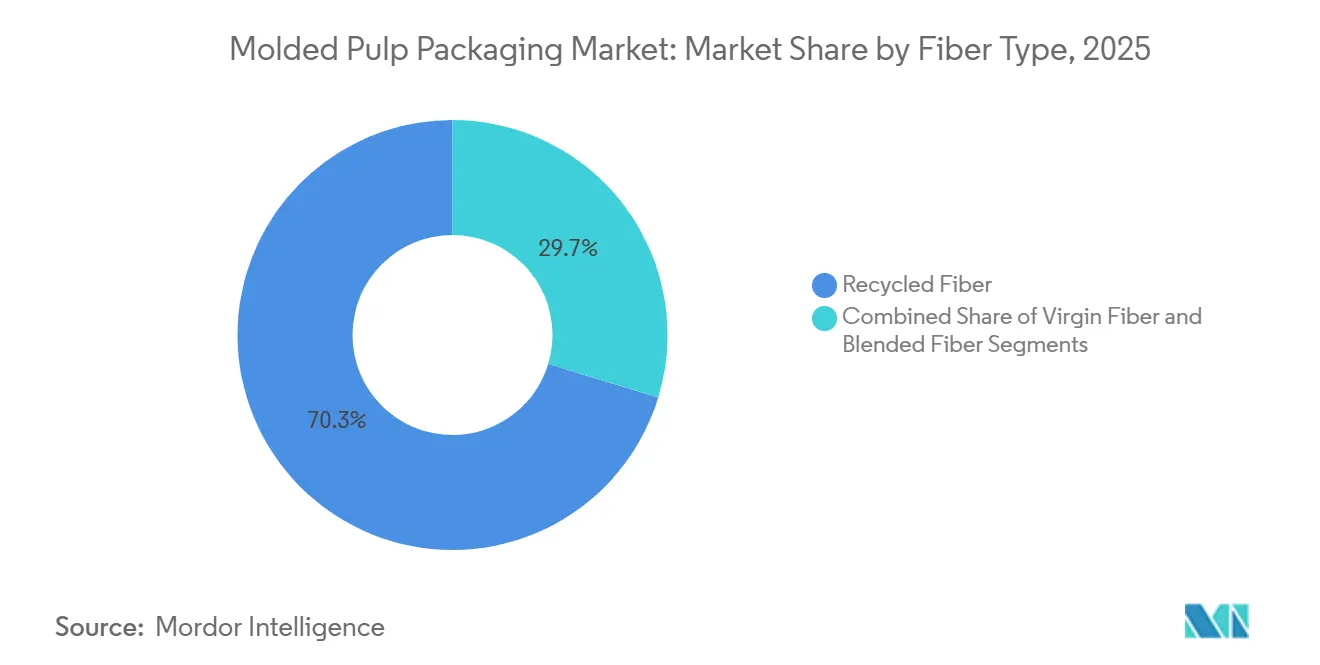
- Recycled fiber led with 70.3% molded pulp packaging market share in 2025, while blended fiber is forecast to expand at an 8.5% CAGR through 2031.
- Trays commanded 41.2% of 2025 revenue, whereas bowls and cups are projected to grow at 9.1% CAGR to 2031.
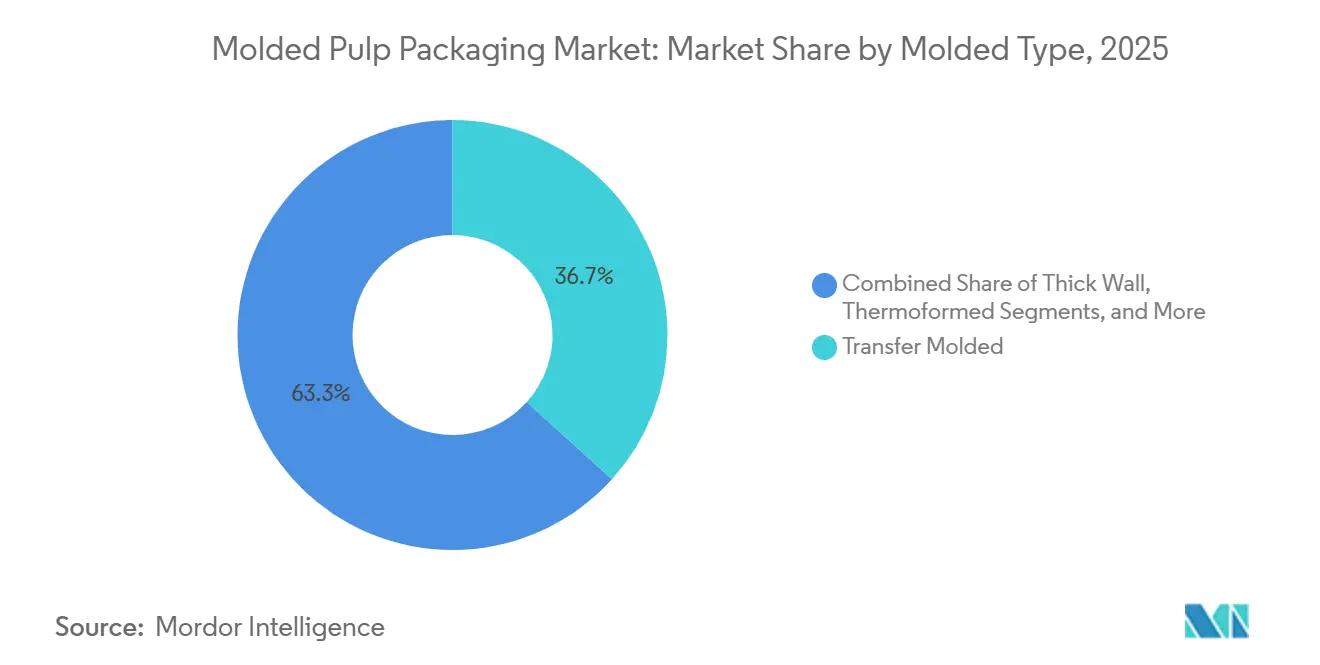
- Transfer molded technology captured 36.7% of 2025 volume, yet thermoformed molded pulp is on track for 7.24% CAGR through 2031.
- Food packaging accounted for 52.4% of demand in 2025, and healthcare and medical devices are poised to register an 8.6% CAGR.
- North America contributed 46.56% of global sales in 2025, but the Middle East is expected to record an 8.4% CAGR to 2031.
Note: Market size and forecast figures in this report are generated using Mordor Intelligence’s proprietary estimation framework, updated with the latest available data and insights as of January 2026.
Global Molded Pulp Packaging Market Trends and Insights
Drivers Impact Analysis*
| Driver | (~) % Impact on CAGR Forecast | Geographic Relevance | Impact Timeline |
|---|---|---|---|
| Regulatory bans on single-use plastics | +1.8% | Global, strongest in EU, North America, select Asia-Pacific | Medium term (2-4 years) |
| Corporate net-zero and plastic-neutral goals | +1.2% | Global, concentrated in North America and Europe | Medium term (2-4 years) |
| Cost advantage versus EPS and thermoformed | +0.7% | Global, especially South America and Asia-Pacific | Short term (≤ 2 years) |
| E-commerce demand for curbside-recyclable fillers | +0.9% | North America, Europe, Asia-Pacific e-commerce hubs | Short term (≤ 2 years) |
| Line-speed gains from dry-formed technology | +0.6% | North America and Europe first, spill-over to Asia-Pacific | Long term (≥ 4 years) |
| PFAS-free legislation in foodservice | +1.0% | North America and Europe, emerging in Asia-Pacific | Medium term (2-4 years) |
| Source: Mordor Intelligence | |||


Regulatory Bans On Single-Use Plastics
Legislation is redefining procurement priorities across the molded pulp packaging market. The European Union’s 2030 recyclability rule and California’s SB 54 both outlaw expanded polystyrene, instantly elevating molded pulp from cost-driven option to compliance necessity. India’s ban on 19 plastic items deepens demand in foodservice, while varying enforcement standards make multi-jurisdiction compliance complex. Integrated producers that command their own tooling and certification resources are best positioned to navigate divergent exemptions and accelerated timelines, reinforcing the market’s shift toward scale and vertical control.
Corporate Net-Zero And Plastic-Neutral Pledges
Retailer and brand commitments translate sustainability rhetoric into hard supplier mandates that favor the molded pulp packaging market. Unilever targets a 50% cut in virgin plastic, Walmart’s Project Gigaton embeds recyclable packaging in supplier scorecards, and Amazon’s frustration-free program removed millions of metric tons of plastic fillers. These cascading requirements compel contract packers to adopt molded pulp tooling even at a pricing premium because shelf access now hinges on ESG metrics, not just cents per unit.
Cost Advantage Versus EPS And Thermoformed Plastic
High virgin-plastic prices and landfill surcharges have widened the cost delta in favor of molded pulp, especially in price-sensitive South America and parts of Asia-Pacific. When feedstock is sourced locally, recycled-fiber trays can undercut expanded polystyrene by 10%, strengthening the molded pulp packaging market’s appeal to mass-market egg, produce, and consumer-electronics accounts. This cost edge supports penetration while technology upgrades continue to trim per-unit conversion expense.
E-Commerce Demand For Curbside-Recyclable Fillers
Record parcel volumes expose the shortcomings of peanuts and bubble wrap. Major carriers report that more than 90% of outgoing packaging is now curbside recyclable, a benchmark that molded pulp corner blocks and edge protectors comfortably meet. Although molded pulp can add 10-15% to unit cost, online retailers have shown willingness to absorb the premium to avoid penalties and preserve brand equity, reinforcing another structural tailwind for the molded pulp packaging market.
Restraint Impact Analysis*
| Restraint | (~) % Impact on CAGR Forecast | Geographic Relevance | Impact Timeline |
|---|---|---|---|
| Price volatility of OCC and virgin fiber | -0.9% | Global, acute where recovered paper is imported | Short term (≤ 2 years) |
| Perceived poor barrier and print performance | -0.6% | Global, most visible in cosmetics and pharmaceuticals | Medium term (2-4 years) |
| Limited color-pulp recycling streams | -0.3% | North America and Europe where MRFs lack color separation | Long term (≥ 4 years) |
| High energy load during hot-press finishing | -0.4% | Regions with elevated electricity costs, notably Europe and parts of Asia-Pacific | Medium term (2-4 years) |
| Source: Mordor Intelligence | |||
Price Volatility Of OCC And Virgin Fiber
Fluctuating old-corrugated-container and softwood-pulp prices compress converter margins and complicate fixed-price contracts. Without hedging tools, many smaller players in the molded pulp packaging market absorb cost spikes that can push material expense up threefold within months. Vertical integration into paper trading, as executed by leading suppliers, is emerging as a key defense, yet regional producers remain exposed and occasionally shutter capacity, tightening supply just as demand surges.
Perceived Poor Barrier And Print Performance Versus Coated Plastic
Moisture-vapor transmission rates and print fidelity remain weaker than in coated plastics, limiting molded pulp usage in premium cosmetics, chilled ready meals, and pharmaceutical blister packs. Regulatory bans on PFAS have removed a low-cost barrier option, forcing converters to explore bio-polymer and water-based coatings that add expense and can complicate recycling streams. Until next-generation coatings mature, the molded pulp packaging market faces an innovation gap in the very segments that carry the highest margins.
*Our forecasts treat driver/restraint impacts as directional, not additive. The impact forecasts reflect baseline growth, mix effects, and variable interactions.
Segment Analysis
By Fiber Type: Blended Formats Narrow The Performance Gap
Blended fiber formulations are projected to record an 8.5% CAGR through 2031, the fastest among fiber types, as converters balance recycled-fiber economics with virgin-fiber strength. Recycled grades controlled 70.3% of 2025 demand, reflecting mature supply chains and a 30-40% cost discount to virgin pulp. Yet brand owners seeking barrier performance for refrigerated or medical applications increasingly specify 60-40 blends, absorbing the surcharge to meet durability metrics. India’s pulp mills, already operating at 75% recycled content, showcase the scalability of recycled streams even in fast-growing economies. Conversely, virgin fiber retains a foothold in Class II medical packaging, where contamination risk is unacceptable, ensuring that all three fiber types coexist within the molded pulp packaging market.
Regional preferences differ. North American converters gravitate toward blended recipes to satisfy retailer sustainability audits without sacrificing carton strength, whereas Asian producers still favor recycled-only mixes to serve price-led foodservice demand. Vertical acquisitions that secure pre-sorted recycled feedstock enable higher recycled ratios without strength loss, giving integrated players a cost edge. As drying-energy cuts from emerging technology shrink processing overhead, the molded pulp packaging market size for blended products is expected to expand steadily, even as recycled grades remain the volume anchor.


By Product Type: Bowls And Cups Ride Foodservice Recovery
Trays generated 41.2% of 2025 revenue, led by egg and produce applications, but bowls and cups are forecast to grow at 9.1% CAGR, outpacing every other product family. Quick-service restaurants in states with extended producer responsibility laws are shifting from polystyrene clamshells to molded pulp bowls and coffee lids, redirecting capital toward dedicated tooling lines. Clamshell volumes face pressure from nascent reusable-container pilots in Europe, whereas containers and lids gain from coffee-shop adoption of fiber-based covers that comply with polystyrene bans.
Foodservice survey data crowns molded pulp the “clear winner” among sustainable disposables, a sentiment that filters through purchasing portals of global chains. Compliance fees attached to single-use plastics have turned curbside recyclability into a bottom-line lever, accelerating conversion even when molded pulp commands a higher unit price. Awards for PFAS-free coatings validate new product lines and spur copy-cat launches, ensuring that bowls and cups remain the fastest-advancing slice of the molded pulp packaging market.
By Molded Type: Thermoformed Technology Gains Precision Advantage
Transfer molded formats held 36.7% of 2025 volume on the strength of egg cartons and produce trays, yet thermoformed molded pulp is tracking a 7.24% CAGR to 2031, winning accounts in consumer electronics and cosmetics that demand tight tolerances. Thick-wall variants continue to serve industrial components where crush strength matters more than aesthetics, and processed slim-wall formats occupy high-value niches such as pharmaceutical blister inserts.
Major electronics brands report double-digit plastic reductions after switching to thermoformed fiber inserts that match the sleek form factors of high-end devices. Surface finish improvements coupled with denser footprints enable luxurious unboxing experiences that recycled corrugated could not achieve. As cycle times fall and defect rates shrink, the molded pulp packaging market sees a convergence of aesthetics, precision, and sustainability that erodes the final bastion of polystyrene in upscale packaging.
By End-User Industry: Healthcare Segment Accelerates On Sterile-Barrier Demand
Food packaging still comprised 52.4% of demand in 2025, but healthcare and medical devices are projected to log an 8.6% CAGR, the fastest among end users. Stringent ISO sterilization standards push converters toward virgin or blended fiber with ultra-low contaminant thresholds. PFAS bans further tilt hospitals away from coated plastics, opening a lane for thermoformed trays that can withstand autoclave cycles once thought exclusive to polymer formats.
Consumer electronics remain a second hot zone as sustainability targets cascade from headline brands to contract manufacturers, while personal-care adoption hinges on barrier-coating advancements. Industrial goods grow in line with manufacturing output but supply relatively stable volume that dampens cyclical swings. The resulting demand mosaic diversifies the molded pulp packaging market, buffering it against single-sector shocks and widening its strategic relevance across verticals.
Geography Analysis
North America captured 46.56% of global sales in 2025 thanks to early retailer mandates and state-level extended producer responsibility laws. Growth is moderating as egg and produce applications near saturation, yet policy tailwinds such as California’s 25% plastic-reduction rule keep the adoption curve positive. Canada’s ban on polystyrene foodservice ware and Mexico City’s compostability requirement echo U.S. shifts, sustaining regional momentum even as urban recycling programs mature.
The Middle East is set to post an 8.4% CAGR through 2031, the fastest worldwide. Saudi Arabia’s Vision 2030 targets and the UAE’s Circular Economy Policy have catalyzed large-scale local investments, including a USD 266 million plant aimed at displacing Asian imports. Upstream moves by regional containerboard producers secure feedstock, anchoring domestic supply chains that buffer against global pulp price spikes.
Europe benefits from the bloc-wide 2030 recyclability mandate, with Germany, France, and the United Kingdom at the forefront of molded pulp adoption in foodservice and retail. Asia-Pacific remains a mixed picture: India’s packaging boom, rising e-commerce penetration, and strict plastic-waste rules make it a demand engine, whereas several Southeast Asian nations still rely on cheap plastic amid under-developed recycling infrastructure[2]Source: India Brand Equity Foundation, “IBEF Homepage,” ibef.org. South America and Africa show patchier progress but register rising interest in molded pulp for quick-service restaurants and industrial exports as compliance costs for plastics escalate.

Competitive Landscape
The molded pulp packaging market retains moderate fragmentation; the top five suppliers hold roughly 35-40% of capacity, leaving space for regional specialists and technology entrants. Vertical integration dominates strategic agendas, evidenced by paper-trading acquisitions that shelter converters from recycled-fiber price swings. Capital outlays in North America and Europe are automating high-speed lines and consolidating regional egg-carton capacity, while cross-border deals in Asia-Pacific expand manufacturing footprints.
Technology licensing accelerates time-to-market for disruptive processes. Dry-molded-fiber lines installed in the United States, Sweden, and Malaysia slash cycle times, achieving near parity with thermoforming and opening premium categories such as cosmetics caps and coffee lids. Healthcare-grade trays remain a white-space opportunity; converters that pair virgin fiber with PFAS-free coatings and ISO-certified sterile-barrier performance can command premium margins.
Consolidation in broader packaging signals that scale is becoming a prerequisite. Multibillion-dollar mergers in containerboard and plastic packaging tighten feedstock control and broaden product portfolios, positioning conglomerates to bundle molded pulp with folding cartons or flexible films in integrated bids. Niche innovators continue to address color separation, energy-efficient hot-pressing, and digital printing, ensuring that the competitive landscape evolves on both volume and technology fronts.
Molded Pulp Packaging Industry Leaders
Brødrene Hartmann A/S
Huhtamaki Oyj
UFP Technologies, Inc.
Sabert Corporation
Sonoco Products Company
- *Disclaimer: Major Players sorted in no particular order

Recent Industry Developments
- November 2025: Sabert’s PFAS-free Pulp Ultra® line won the 2025 U.S. Plastics Pact Award, accelerating chain-wide rollouts at national restaurants.
- September 2025: Packaging Corporation of America completed its USD 1.8 billion acquisition of Greif’s containerboard unit, expanding recycled-fiber supply for molded-pulp converters.
- October 2025: Packaging Corporation of America completed its USD 1.8 billion acquisition of Greif’s containerboard unit, expanding recycled-fiber supply for molded-pulp converters.
- April 2025: Huhtamaki commissioned a USD 30 million folding-carton plant in Texas that complements its molded-fiber network.


Research Methodology Framework and Report Scope
Market Definitions and Key Coverage
Our study defines the molded pulp packaging market as global revenue from trays, clamshells, end-caps, bowls, and similar rigid shapes produced through wet or dry molding of recycled paper or virgin plant fibers. The count begins when finished items leave converters and enter food packaging, food service, consumer electronics, healthcare, and industrial channels.
Scope exclusion: loose-fill cellulose, plain bagasse dinnerware, and any un-molded fiber pads are not covered.
Segmentation Overview
- By Fiber Type
- Recycled Fiber
- Virgin Fiber
- Blended Fiber
- By Product Type
- Trays
- Bowls and Cups
- Clamshells
- Plates
- Containers and Lids
- Other Product Types
- By Molded Type
- Thick Wall
- Transfer Molded
- Thermoformed
- Processed / Slim Wall
- By End-User Industry
- Food Packaging
- Foodservice
- Consumer Electronics
- Healthcare and Medical Devices
- Industrial Goods
- Personal Care and Cosmetics
- Other End-User Industries
- By Geography
- North America
- United States
- Canada
- Mexico
- Europe
- Germany
- United Kingdom
- France
- Italy
- Spain
- Russia
- Rest of Europe
- Asia-Pacific
- China
- Japan
- India
- South Korea
- Australia
- Rest of Asia-Pacific
- Middle East
- Saudi Arabia
- United Arab Emirates
- Turkey
- Rest of Middle East
- Africa
- South Africa
- Nigeria
- Rest of Africa
- South America
- Brazil
- Argentina
- Rest of South America
- North America
Detailed Research Methodology and Data Validation
Primary Research
Analysts spoke with procurement leads at quick service chains, Asian molding machine builders, European electronics assemblers, and regional distributors, then reconciled volume and ASP bands until gaps closed.
Desk Research
We compiled HS 4823 trade lines from UN Comtrade, FAO egg output, US EPA and EU plastic ban logs, pulp price curves from Fastmarkets, and Factiva news flows. SEC filings were sifted through D&B Hoovers for capacity clues. The list is illustrative; many other open and paid references informed our desk work.
Market-Sizing & Forecasting
We start with top down supply built from fiber use per ton of capacity plus net trade, then Mordor analysts confirm totals using sampled supplier ASP x volume roll-ups. Drivers include egg yield, parcel volumes, enacted plastic bans, pulp prices, and installed dry formed lines. Forecasts rely on multivariate regression, while thin bottom up spots are bridged with substitution rates drawn from interviews.
Data Validation & Update Cycle
Each run feeds a variance dashboard; only after anomalies are resolved does a senior reviewer sign off. Figures refresh yearly, with interim updates if regulation, capacity, or M&A materially alter demand.
Why Mordor's Molded Pulp Packaging Baseline Commands Reliability
Published numbers often diverge because firms vary product baskets, price logic, and refresh speeds.
Key gap drivers include whether dry molded lids are counted, how cushioning inserts are treated, the exchange rate month, and the cadence of scenario updates.
Benchmark comparison
| Market Size | Anonymized source | Primary gap driver |
|---|---|---|
| USD 5.47 B (2025) | Mordor Intelligence | |
| USD 5.81 B (2024) | Global Consultancy A | Omits cushioning; single region ASP |
| USD 8.13 B (2023) | Industry Journal B | Adds dinnerware and pots; refreshes biennially |
The comparison shows we offer a balanced, transparent baseline grounded in clear variables and repeatable steps, giving decision makers greater confidence in our numbers.


Key Questions Answered in the Report
How large is the molded pulp packaging market in 2026?
The molded pulp packaging market size is USD 5.71 billion and is forecast to reach USD 7.05 billion by 2031.
Which end-user sector is growing fastest for molded pulp?
Healthcare and medical devices lead with an anticipated 8.6% CAGR thanks to sterile-barrier requirements and PFAS bans.
What technology is disrupting molded-pulp production cycles?
Dry-molded-fiber lines cut forming times from minutes to seconds, narrowing the cost gap with injection-molded plastics.
Which geography is projected to expand most rapidly?
The Middle East is forecast to register an 8.4% CAGR to 2031, propelled by Saudi Arabia’s Vision 2030 and UAE circular-economy policies.
Page last updated on:


