
Containerboard Market Size and Share
Market Overview
| Study Period | 2020 - 2031 |
|---|---|
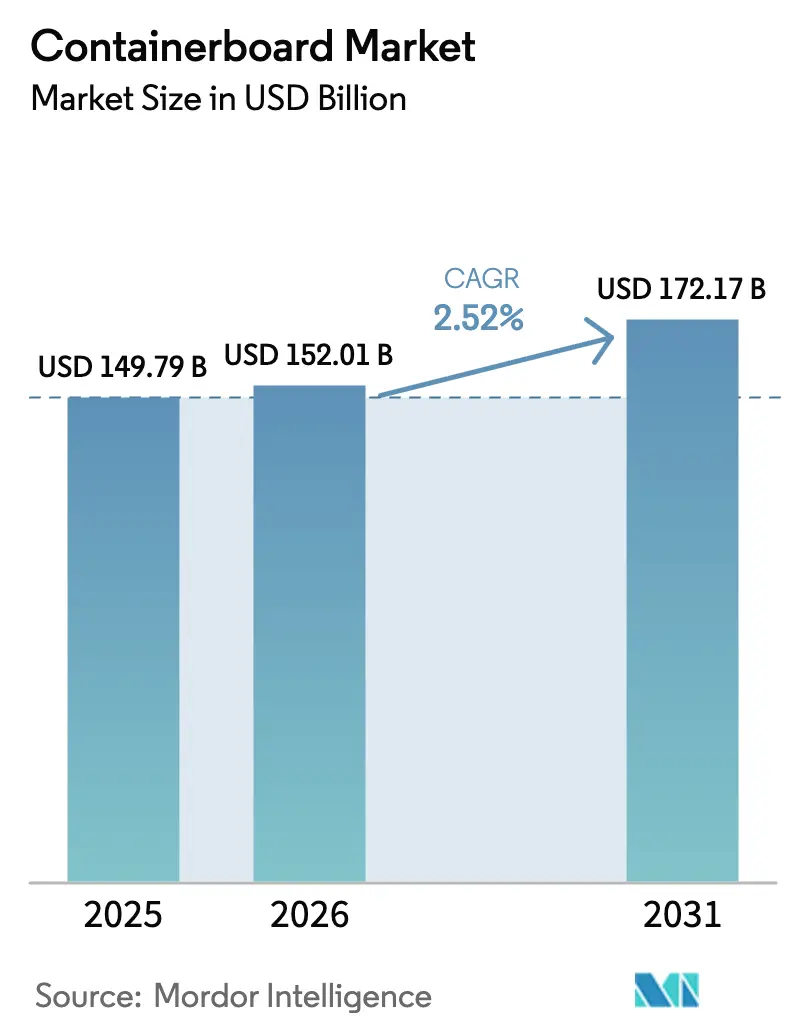
| Market Size (2026) | USD 152.01 Billion |
| Market Size (2031) | USD 172.17 Billion |
| Growth Rate (2026 - 2031) | 2.52 % |
| Fastest Growing Market | Middle East and Africa |
| Largest Market | Asia Pacific |
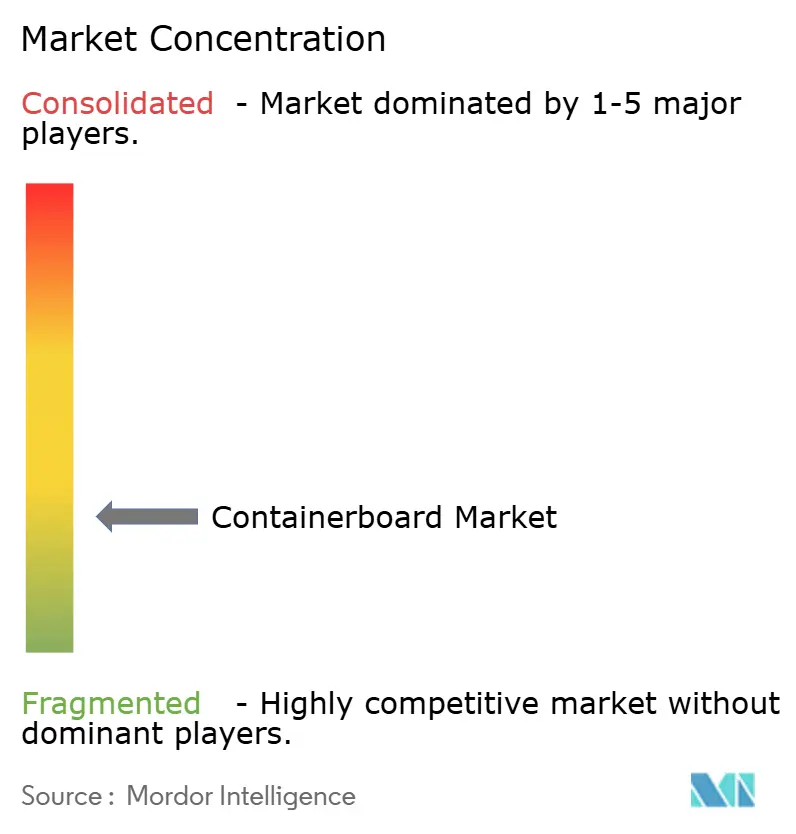
| Market Concentration | Low |
Major Players *Disclaimer: Major Players sorted in no particular order Image © Mordor Intelligence. Reuse requires attribution under CC BY 4.0. | |
Containerboard Market Analysis by Mordor Intelligence
The containerboard market size is expected to grow from USD 149.79 billion in 2025 to USD 152.01 billion in 2026 and is forecast to reach USD 172.17 billion by 2031 at a 2.52% CAGR over 2026-2031. This steady trajectory reflects disciplined capacity management, escalating recycled-content mandates, and sustained e-commerce demand. Producers are prioritizing mill debottlenecking, lightweighting programs, and captive energy projects to defend margins against volatile fiber and carbon costs. Regulatory pressure in the European Union and the United Kingdom is accelerating shifts toward mono-material designs, while North American brand owners are raising burst-strength specifications for direct-to-consumer shipments. Capital is flowing to high-growth corridors in Southeast Asia, the Middle East, and Africa, where greenfield corrugators shorten lead times and avoid import duties. Consolidation among integrated majors is intensifying price competition, forcing mid-tier mills to specialize in niche or premium grades to remain profitable.
Key Report Takeaways
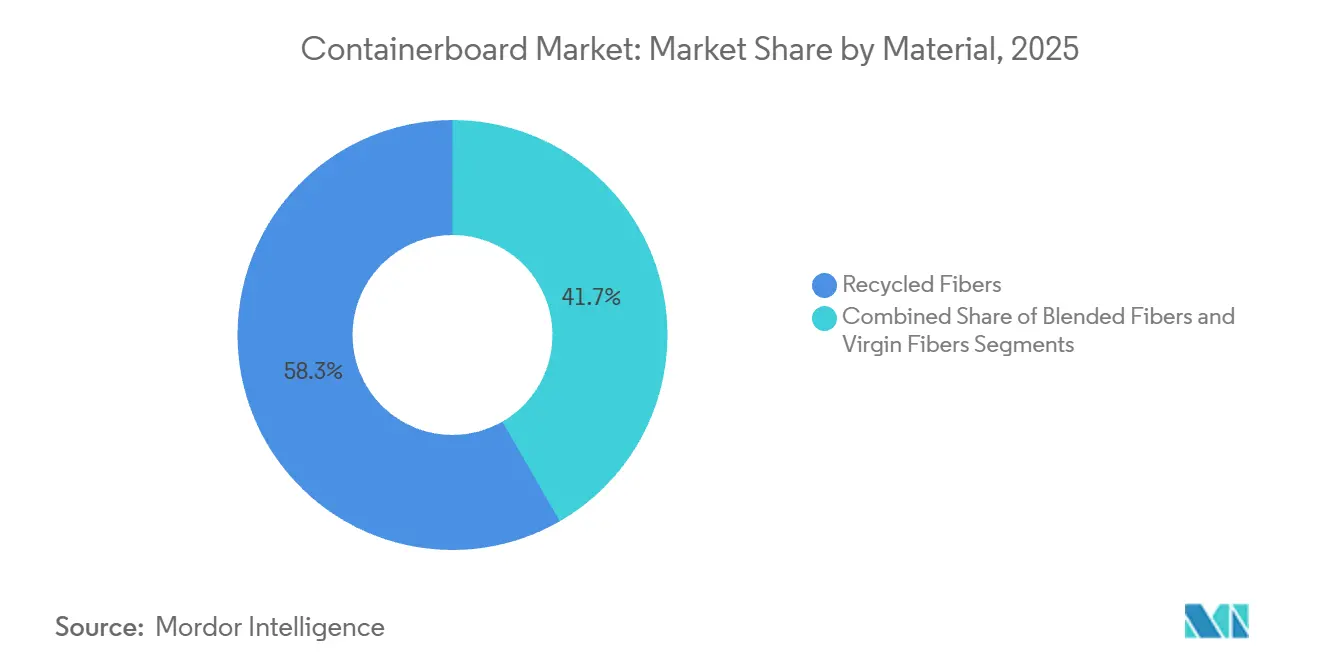
- By material, recycled fibers captured 58.32% of the containerboard market share in 2025. However, blended fibers are projected to post a 3.43% CAGR through 2031, the fastest among all material segments.
- By type, kraftliners led with 46.43% revenue share in 2025, while flutings are advancing at a 4.32% CAGR to 2031.
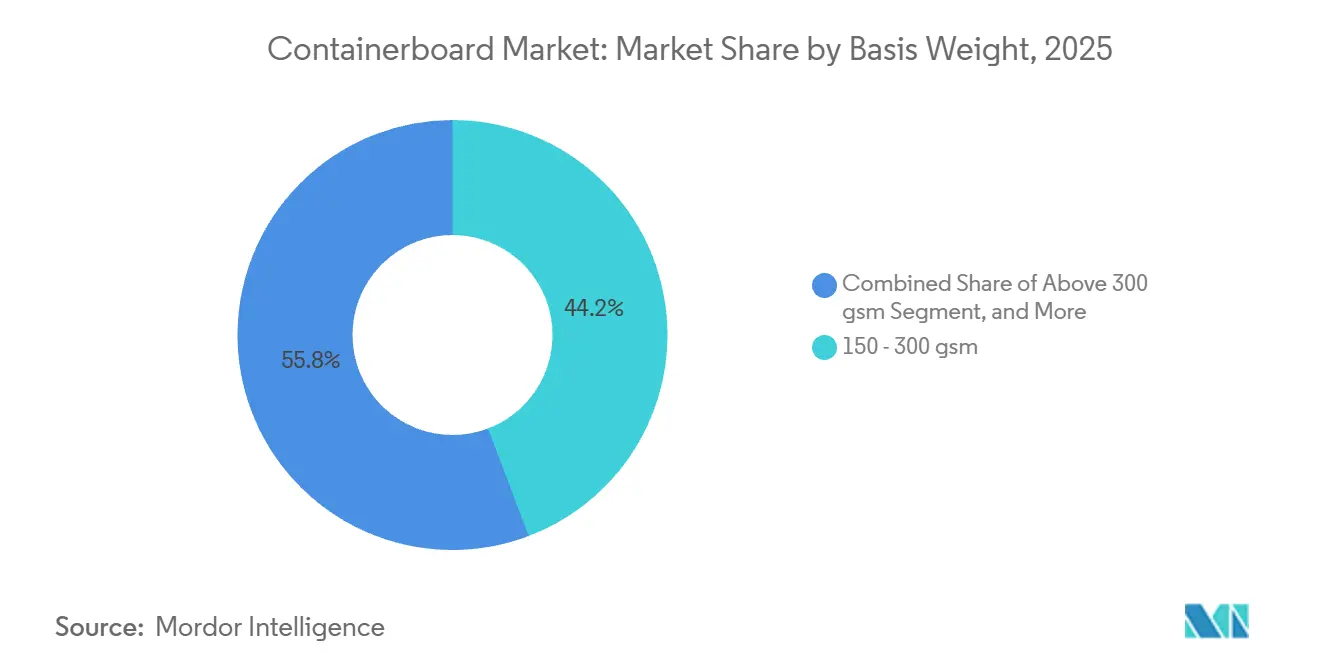
- By basis weight, the 150-300 gsm range commanded 44.23% of the containerboard market size in 2025, whereas grades above 300 gsm are paced for a 3.57% CAGR.
- By end user, food and beverage accounted for 32.32% of the revenue share in 2025, and industrial packaging is projected to expand at a 3.68% CAGR through 2031.
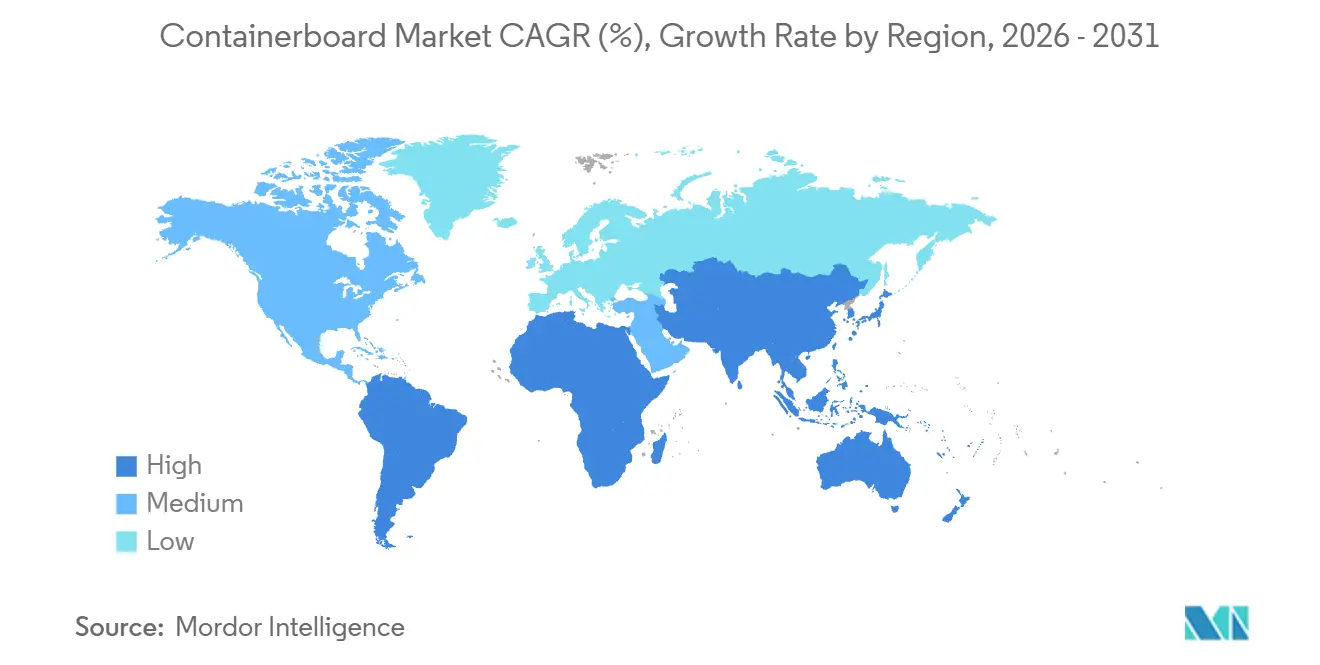
- By geography, Asia-Pacific accounted for 40.32% regional share in 2025, but the Middle East and Africa are expected to record the highest regional CAGR at 4.76% to 2031.
Note: Market size and forecast figures in this report are generated using Mordor Intelligence’s proprietary estimation framework, updated with the latest available data and insights as of January 2026.
Market Trends and Insights
Drivers Impact Analysis of Containerboard Market*
| Driver | (~) % Impact on CAGR Forecast | Geographic Relevance | Impact Timeline |
|---|---|---|---|
| Rising E-commerce Shipping Volumes | +0.8% | Global, with concentration in North America, Europe, and key Asia-Pacific metros | Short term (≤ 2 years) |
| Growth in Processed Food and Beverage Packaging | +0.5% | Global, especially Asia-Pacific and South America urbanizing regions | Medium term (2-4 years) |
| Shift Toward Sustainable and Recyclable Packaging Solutions | +0.6% | Europe and North America regulation-driven, Asia-Pacific corporate-led | Medium term (2-4 years) |
| Lightweight Containerboard Innovations Reducing Shipping Costs | +0.3% | Global early uptake in Europe and North America logistics networks | Medium term (2-4 years) |
| Expansion of Corrugated Box Plants in Emerging Markets | +0.4% | Asia-Pacific (India, Vietnam), Middle East and Africa, South America | Long term (≥ 4 years) |
| Increase in Intercontinental Trade Requiring Durable Packaging | +0.2% | Global, emphasis on Asia-Pacific export corridors and Middle East import hubs | Long term (≥ 4 years) |
| Source: Mordor Intelligence | |||
Rising E-commerce Shipping Volumes
Explosive parcel growth is reshaping linerboard specifications as automated sortation and last-mile fulfillment subject shippers to higher drop and compression stresses. Integrated majors now combine 24 million tons of containerboard capacity with more than 2,000 box plants, enabling on-demand formats that achieve cube utilization within 5 millimeters of product dimensions. The result is elevated demand for kraftliners delivering burst strength above 1,100 kPa, a threshold that recycled testliners often miss without virgin reinforcement. [1] International Paper, “Investor Day Presentation,” INTERNATIONALPAPER.COM
Growth in Processed Food and Beverage Packaging
Urbanizing middle-class consumers in Asia-Pacific and South America continue to favor shelf-stable foods packed in corrugated cases. Converters respond with moisture-resistant coatings and rapid-cooling liners that maintain board integrity through cold-chain logistics. The surge is most visible in single-serve beverage multipacks, where redesigned flute profiles cut weight yet uphold stacking strength, allowing retailers to run higher pallet heights.
Shift Toward Sustainable and Recyclable Packaging Solutions
Mandatory recycled-content floors and single-use plastic restrictions have pivoted investment toward closed-loop fiber systems. A recycled containerboard machine commissioned in 2024 added 420,000 tons of annual capacity in Italy, backed by a EUR 280 million (USD 316.4 million) spend that underscores confidence in mono-material adoption. The United Kingdom's extended producer responsibility fees, reaching GBP 1,000 per ton, further tilt the economics toward corrugated alternatives.
Lightweight Containerboard Innovations Reducing Shipping Costs
Each 10 gsm liner reduction can shave roughly 8% off freight bills, prompting mills to introduce 72-92 gsm kraftliners that emit up to 80% less carbon dioxide than regional averages. [2]Holmen Paper, “Holmen Elevate Kraftliner,” HOLMEN.COM Converters leverage these substrates to replace 90-100 gsm grades, realizing 15-18% material savings while retaining edge-crush performance above 5.5 kN/m. This shift also contributes to reducing the overall environmental footprint of the packaging industry.
Restraints Impact Analysis of Containerboard Market*
| Restraint | (~) % Impact on CAGR Forecast | Geographic Relevance | Impact Timeline |
|---|---|---|---|
| Availability of Alternative Flexible Packaging Solutions | -0.4% | Global, higher substitution in North America and Europe | Medium term (2-4 years) |
| Volatility in Recovered Paper Prices | -0.5% | Global, acute in Asia-Pacific and Europe recycled-fiber mills | Short term (≤ 2 years) |
| Escalating Energy and Carbon Compliance Costs | -0.3% | Europe primary, spillover in regulated North America and Asia-Pacific zones | Medium term (2-4 years) |
| Water Scarcity Constraints on Mill Operations | -0.2% | Asia-Pacific water-stressed provinces, Middle East, U.S. Southwest | Long term (≥ 4 years) |
| Source: Mordor Intelligence | |||
Volatility in Recovered Paper Prices
Spot prices for old corrugated containers fell 16% in one quarter of 2025, compressing recycled-fiber mill margins by roughly 250 basis points. Such swings push independent producers toward vertical integration or long-term supply contracts, as quarterly fiber costs can otherwise fluctuate 20-30%. [3]Federal Reserve Bank of St. Louis, “Producer Price Index: Wastepaper,” FRED.STLOUISFED.ORG This trend highlights the importance of cost management strategies in maintaining profitability.
Availability of Alternative Flexible Packaging Solutions
Stand-up pouches and flow wraps are growing faster than corrugated in select snack and pet-food formats because they offer superior moisture barriers and shelf appeal. Although pending European recyclability mandates may curb single-use plastics, flexible laminates remain a credible substitute where rigidity is not essential, tempering expansion prospects for the containerboard market. However, advancements in sustainable materials could further influence the adoption of flexible laminates in the coming years.
*Our forecasts treat driver/restraint impacts as directional, not additive. The impact forecasts reflect baseline growth, mix effects, and variable interactions.
Containerboard Market Segment Analysis
By Material:
Recycled Fibers Dominate, Blended Grades Gain TractionRecycled fibers represented 58.32% of market share in 2025, anchored by mature collection loops in Europe and North America, where recovery rates exceed 90%. The containerboard market for blended grades is projected to outpace all others, with a 3.43% CAGR through 2031, as converters balance cost with burst strength. A multilayer concept pairing chemithermomechanical pulp with kraft fibers showcases how mills are engineering stiffness at lower grammages.
Blended formulations allow real-time adjustment to price shifts in recovered paper, smoothing margin swings for mills exposed to spot procurement. Regulatory minimums on recycled content compel virgin-fiber producers to integrate recovered furnish, further accelerating blend adoption. In application terms, blended liners increasingly ship fresh produce and export containers that require moisture resistance without full virgin composition.



By Type:
Kraftliners Lead, Flutings Surge on LightweightingKraftliners held a 46.43% revenue share in 2025 as the favored outer liner for high-graphics retail and e-commerce cartons. Flutings, however, are forecast to grow 4.32% annually, the swiftest pace in the containerboard market. Lightweight semi-chemical flutings at 73 gsm are replacing 80-85 gsm recycled mediums, saving up to 16% material while keeping edge-crush values above 4.0 kN/m.
The uplift in fluting demand mirrors converter migration from C-flute to thinner B- and E-flute structures that trim board consumption yet uphold stacking performance. Kraftliner producers counter by launching 72-92 gsm grades that satisfy e-commerce burst requirements and reduce freight costs, reinforcing their dominance in premium outer facings of the containerboard market.
By Basis Weight:
Mid-Range Dominates, Heavy-Duty Gains MomentumThe 150-300 gsm band accounted for 44.23% of demand in 2025 and remains the workhorse range for general shipping cases. Even so, above-300 gsm heavy-duty grades are registering a 3.57% CAGR as automotive and electronics manufacturers adopt triple-wall formats for intercontinental freight. In contrast, sub-150 gsm boards serve partition and point-of-purchase roles where printability outweighs stacking strength.
Lightweighting remains pervasive across the containerboard market. Mills deploy refined fiber orientation and calendering to drop 200 gsm liners to 180 gsm equivalents without sacrificing edge-crush benchmarks, a cost-effective move where logistics bills can exceed 12% of delivered packaging price.
By End User:
Food and Beverage Largest, Industrial Fastest GrowingFood and beverage applications made up 32.32% of market share in 2025, supported by corrugated cases for fresh produce and shelf-stable multipacks. Industrial uses are poised for the fastest advance at 3.68% CAGR to 2031, driven by manufacturers swapping plastic and wood for fiber-based protective formats. A premium smartphone producer reported 99% adoption of fiber packaging in 2024, underscoring the trend toward precision die-cut inserts.
The drive to eliminate petroleum-based dunnage aligns with extended producer responsibility mandates that now span automotive and consumer electronics supply chains. Returnable corrugated containers are also gaining favor in just-in-time component flows, leveraging board recyclability and weight advantages over wooden crates.
Geography Analysis
APAC Containerboard Market
Asia-Pacific controlled 40.32% of 2025 output, anchored by China’s 120 million-ton capacity. Nevertheless, maturation in China and relocations to Southeast Asia are moderating regional growth. India, Vietnam, and Thailand draw greenfield corrugators that cut lead times from 45-60 days to under 10 days for local brand owners. Water scarcity in northern China and parts of India is prompting investment in closed-loop effluent systems or coastal desalination tie-ins.
MEA Containerboard Market
The Middle East and Africa comprise the fastest-growing bloc at 4.76% CAGR through 2031, propelled by Saudi Vision 2030 infrastructure and Egypt’s industrial diversification. A 450,000-ton capacity increment in Saudi Arabia leverages low domestic gas prices and port proximity to broaden regional supply. Sub-Saharan demand is constrained by weak collection networks, necessitating virgin fiber imports from South America and Europe until domestic loops mature.
Europe and North America Containerboard Market
Europe and North America are rationalizing high-cost mills while upgrading integrated sites with biomass cogeneration. Two mill closures in the United States removed a combined 250,000 tons, but recycled capacity additions via acquisitions offset the cuts. In Europe, minimum recycled-content rules are nudging mills toward lighter, higher-recovered grades, though subdued industrial output keeps overall tonnage growth modest.
South America Containerboard Market
South America remains buoyed by Brazil’s vertically integrated forestry assets that supply containerboard for food and beverage cases linked to urbanization and rapid grocery delivery. Currency volatility continues to influence export competitiveness, but local demand remains resilient.

Regulatory Landscape
In the European Union, Regulation (EU) 2025/40 on packaging and packaging waste (PPWR) entered into force on 11 February 2025 and applies from 12 August 2026 to packaging placed on the EU market. The PPWR framework raises compliance needs around packaging design, minimization, and circularity documentation, and it is supported by ongoing European Commission guidance, including Commission Notice 2026/C/3084, which shapes how containerboard-based formats are specified for market access.
In the United States, food-contact paper and paperboard, including containerboard used in food applications, is regulated under FDA rules in 21 C.F.R. Part 176, with specific provisions relevant to reclaimed fiber. Industry compliance programs, such as the Recycled Paperboard Technical Association (RPTA) program updated in December 2024, are used by manufacturers to align recycled grades with FDA expectations. Trade policy also affects cross-border flows of containerboard and related products, with U.S. tariff administration referencing the Harmonized Tariff Schedule (2026 revision) and broader tariff actions executed through established U.S. trade authorities.
Value Chain Analysis
The containerboard value chain starts with fiber sourcing, including virgin pulp and recovered paper such as OCC, then moves through pulping and stock preparation, papermaking (kraftliner, testliner, and fluting), and downstream converting into corrugated sheets and boxes. Vertical integration links recovered-fiber collection and sorting, mill operations, and box plants, helping stabilize furnish costs and service levels when recovered paper prices swing and when energy costs tighten mill economics.
Recent operating conditions show how supply, pricing, and investment decisions propagate through the chain. In North America, industry data in Q1 2026 reported an 8% year-over-year decline in containerboard production alongside capacity reductions reported across February 2025 to March 2026. This shift has altered negotiations among mills, converters, and brand owners, contributing to longer mill backlogs and multiple price-increase rounds. In emerging manufacturing corridors, new recycled containerboard capacity, such as Star Paper Mill's 135,000-tonne-per-year facility in KEZAD, Abu Dhabi (inaugurated May 2026), and rebuild programs like Aquakraft's Ferizli mill project in Turkey with Voith (contract signed May 2026), demonstrate how equipment suppliers, utilities, and local recovered-fiber ecosystems affect regional cost-to-serve and lead times.
Competitive Landscape
The containerboard market features fragmentation. Two mega-mergers completed in 2024-2025 created integrated platforms spanning containerboard manufacture, box conversion, and recovered-fiber collection, squeezing independent converters that purchase merchant board. Innovation is moving from commodity production toward performance grades, such as ultra-light kraftliners and moisture-resistant multilayers, which command 10-15% premiums.
Smaller mills adopt specialization to survive, focusing on white-top liners, recycled flutings for e-commerce void fill, or rapid-response digital print runs. Digitization is rapidly permeating operations, with machine-learning optimizers cutting refining energy use by up to 8% and reducing caliper variability across production lots. Carbon prices between EUR 60 and EUR 80 per ton (USD 65.4-87.2) amplify competitive gaps between mills with biomass cogeneration and those reliant on grid electricity.
Emerging substitutes, including molded-pulp rigid formats, are progressing but have yet to achieve scale or cost parity with corrugated. Consequently, the strategic emphasis remains on vertical integration, mill efficiency, and niche-grade development rather than wholesale diversification beyond paper-based substrates.
Containerboard Industry Leaders
Smurfit WestRock
International Paper Company
Oji Holdings Corporation
Mondi Group
Nine Dragons Paper (Holdings) Limited
- *Disclaimer: Major Players sorted in no particular order
Containerboard Market Companies Covered in this Report
- International Paper Company
- Smurfit WestRock
- Nine Dragons Paper Holdings
- Mondi plc
- Oji Holdings Corporation
- Cascades Inc.
- Stora Enso Oyj
- Sappi Limited
- Georgia-Pacific LLC
- Svenska Cellulosa Aktiebolaget SCA
- Lee and Man Paper Manufacturing
- Pratt Industries
- Klabin SA
- Rengo Co., Ltd.
- Packaging Corporation of America
- Asia Pulp and Paper (APP)
- Shanying International
- Visy Industries

Market Opportunities and Future Outlook
Regulation-led packaging redesign and recycled-content compliance are creating whitespace for higher-performance containerboard that supports tightening circularity and food-contact requirements, while still protecting products in automated logistics. The EU's PPWR timeline, applying from 12 August 2026, is a concrete trigger for suppliers and converters to requalify grades, labeling, and documentation for packaging placed on the EU market. In parallel, FDA food-contact rules under 21 C.F.R. Part 176 and industry compliance programs such as the RPTA framework (updated December 2024) support opportunities for certified recycled-content containerboard in food and beverage secondary packaging, where converters increasingly seek validated reclaimed-fiber protocols.
Capital allocation and network optimization are also reshaping where and how containerboard is made and converted, creating opportunities for supply relocation, mill efficiency upgrades, and regional self-sufficiency. Examples include International Paper's April 2026 agreement to acquire NORPAC for USD 360 million to add nearly 1 million tons of annual containerboard capacity and strengthen its U.S. West Coast footprint, and Green Bay Packaging's commitment of over USD 1 billion (Project PowerPack) to expand its Morrilton, Arkansas kraft linerboard mill. Outside mature markets, newly commissioned recycled containerboard capacity, such as the May 2026 Star Paper Mill facility in Abu Dhabi, highlights continued demand for local supply that reduces import dependence and lead times, while reinforcing circular-economy collection and sorting ecosystems.
Recent Industry Developments in Containerboard Market
- June 2026: International Paper announced the closure of its preprint operation in Richwood, Kentucky, and sheet and converting plants in Aurora, Illinois; Elk Grove, California; and Barrington, New Jersey, targeted by the end of Q3 2026. The move tightens the company’s downstream footprint and concentrates volume into more competitive sites, influencing regional converting availability and service models for box buyers.
- April 2026: International Paper announced an agreement to acquire North Pacific Paper Company (NORPAC) for USD 360 million, adding nearly 1 million tons of annual containerboard capacity and strengthening its West Coast platform. The deal reinforces integrated supply for converting networks and shifts competitive positioning in a freight-sensitive region where proximity to customers and ports matters.
- November 2024: Mondi acquired Schumacher Packaging Group for EUR 634 million (USD 684.72 million), adding 1.1 billion square meters of corrugated capacity in Central and Eastern Europe. The acquisition expands Mondi’s converting reach and customer access in key European manufacturing corridors, supporting broader integration between containerboard supply and box converting.


Containerboard Market Report Scope and Research Methodology
Market Definition and Coverage
For this study, the containerboard market covers the value of containerboard grades sold for making corrugated packaging, including linerboard and fluting produced from virgin, recycled, or blended fibers.
Scope exclusions: We exclude converted corrugated boxes, printing and converting services, and other paperboard grades that are not used as containerboard.
Segments Covered in This Report
- By Material
- Virgin Fibers
- Recycled Fibers
- Blended Fibers
- By Type
- Kraftliners
- Testliners
- Flutings
- Other Types
- By Basis Weight
- Below 150 gsm
- 150 - 300 gsm
- Above 300 gsm
- By End User
- Food and Beverage
- Consumer Goods
- Industrial
- Other End Users
- By Geography
- North America
- United States
- Canada
- Mexico
- Europe
- Germany
- France
- United Kingdom
- Italy
- Spain
- Rest of Europe
- Asia-Pacific
- China
- Japan
- India
- South Korea
- Australia and New Zealand
- Rest of Asia-Pacific
- South America
- Brazil
- Argentina
- Rest of South America
- Middle East
- Saudi Arabia
- United Arab Emirates
- Turkey
- Rest of Middle East
- Africa
- South Africa
- Egypt
- Nigeria
- Rest of Africa
- North America
Data Sources, Market Sizing, and Validation
Desk Research
Desk work was used to set the market perimeter, map supply chains, and build a first view of production and consumption by region. Public sources such as FAOSTAT forestry and paper statistics, UN Comtrade trade flows, the US Census Bureau, Eurostat, and national customs or statistics offices helped anchor basic industry signals like paper and paperboard output, trade direction, and packaging activity.
We also reviewed annual reports, investor presentations, sustainability disclosures, and association websites for facts on mill capacity additions, recycled fiber availability, and pricing commentary. To reduce gaps, we used paid subscriptions only for company financials and intelligence, news and financials, patent databases, and shipment-level import and export checks where these were relevant to validate directionality. The desk sources listed here are illustrative, and many other public references were used for data collection, validation, and clarification.
Primary Interviews and Surveys
Primary inputs were collected through expert interviews and structured surveys with containerboard producers, distributors, packaging buyers, and industry consultants across major producing and consuming regions. These conversations helped confirm what drives demand by end use, how recycled and virgin mixes are changing, and how price movements are typically passed through, which tightened our assumptions before finalizing the model.
Distribution of primary research fieldwork respondents
| Company type | Respondent position | Region |
|---|---|---|
| Top tier: 26% | CXOs: 14% | APAC: 43% |
| Mid tier: 56% | Functional/Unit leaders: 38% | EMEA: 35% |
| Smaller Players: 18% | Managers: 48% | Americas: 22% |
Market-Sizing & Forecasting
Sizing starts with a top-down build where paper and paperboard production, trade balances, and packaging demand indicators are used to reconstruct the containerboard demand pool by region, then converted into value using observed price ranges. To keep the totals realistic, we cross-checked the outputs with selective bottom-up approximations, such as sampled mill capacity by grade, utilization discussions from interviews, and ASP times volume checks for key countries.
The main inputs that shaped the model included corrugated packaging demand from food and beverage and consumer goods shipments, e-commerce parcel trends, recycled fiber collection and availability, mill capacity changes and downtime patterns, and regional containerboard price movements (kraftliner versus testliner and fluting spreads). Where data was thin, gaps were handled by using proxy indicators like trade intensity and paperboard output shares, and then corrected through primary feedback.
For forecasting, scenario analysis was applied around a base case reflecting expected demand growth and planned capacity additions, then stress-tested for energy and recovered paper cost swings. In each region, forward assumptions were reviewed with industry participants so the growth curve stayed consistent with purchasing behavior and typical contract reset cycles.
Data Validation & Update Cycle
Validation is done in steps so that a single data point does not overly influence the final number. Analysts compare model outputs against independent signals, including regional production and trade direction, pricing trajectories, and known capacity moves, and then investigate outliers before sign-off.
If a large variance shows up, inputs are rechecked, and the team reconnects with sources to clarify whether the change is structural or temporary. Reports are refreshed annually, with interim updates when material events occur, such as major mill shutdowns, new capacity starts, or sharp price resets. Before delivery, we run a final refresh pass so clients receive the most current view available at that time.
Mordor Intelligence's Containerboard Market Size Compared With Other Published Estimates
Published containerboard market values can look different because the scope is not always identical, and pricing and currency timing can vary across studies. Differences also come from how firms treat recycled versus virgin grades, and whether the estimate is tied back to production and trade checks or mainly to end-use packaging demand.
Some sources appear to fold in parts of the converted corrugated packaging value chain or apply aggressive price progression across the forecast window. By contrast, Mordor Intelligence counts only containerboard grades sold for corrugated packaging and keeps pricing tied to regional grade spreads and capacity and trade signals, which can shift the 2025 value up or down versus broader-scope totals.
Benchmark comparison
| Source | Market Size | Gaps in Research Methodology |
|---|---|---|
| Mordor Intelligence | USD 149.79 B (2025) | |
| Industry Research Publisher A | USD 141.43 B (2025) | Uses a narrower value capture in some regions by leaning more on reported industry splits, and the pricing build can lag fast-moving grade spreads, which reduces the stated 2025 value. |
| Industry Research Publisher B | USD 131.33 B (2025) | Relies on a broader set of high-level end-use and material splits with fewer production and trade cross-checks, and the price assumptions can be smoothed across regions, which tends to compress the 2025 total. |
Looking across the table, most of the spread is explained by how tightly containerboard is separated from downstream corrugated packaging value, and by how regional prices are applied to volumes in the base year. When the demand pool is rebuilt from production, trade, and capacity signals and then reviewed with buyers and producers, the final number becomes easier to trace and repeat for future updates.


Key Questions Answered in the Report
What is the projected value of the containerboard market in 2031?
The containerboard market is anticipated to reach USD 172.17 billion by 2031.
Which material segment is growing fastest?
Blended grades of virgin and recycled fibers are forecast to grow at 3.43% CAGR, the highest among material categories.
Why are lightweight kraftliners gaining popularity?
Every 10 gsm reduction can lower freight costs around 8%, so mills have introduced 72-92 gsm kraftliners that cut weight while retaining strength.
Which region is expected to post the highest growth rate?
The Middle East and Africa are projected to record a 4.76% CAGR through 2031, outpacing all other regions.
How does carbon pricing affect containerboard producers?
European Union carbon allowances cost USD 65-87 per ton, adding USD 15-20 per ton to production for mills without biomass cogeneration.
What end-user sector is expanding fastest?
Industrial packaging, driven by automotive and electronics manufacturers seeking fiber-based protection, is projected to advance at 3.68% CAGR to 2031.
Page last updated on:





