
Market Overview
| Study Period | 2020 - 2031 |
|---|---|
| Forecast Data Period | 2026 - 2031 |
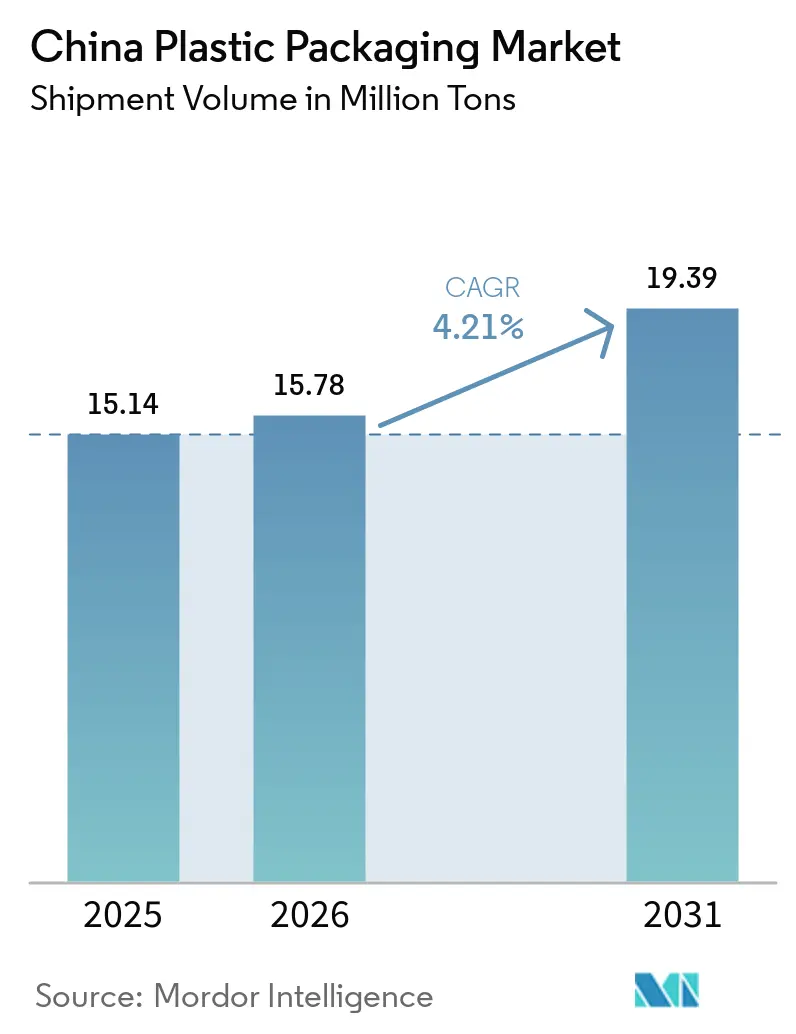
| Base Year Market Size (2025) | 15.14 Million tons |
| Market Volume (2026) | 15.78 Million tons |
| Market Volume (2031) | 19.39 Million tons |
| Growth Rate (2026 - 2031) | 4.21 % |
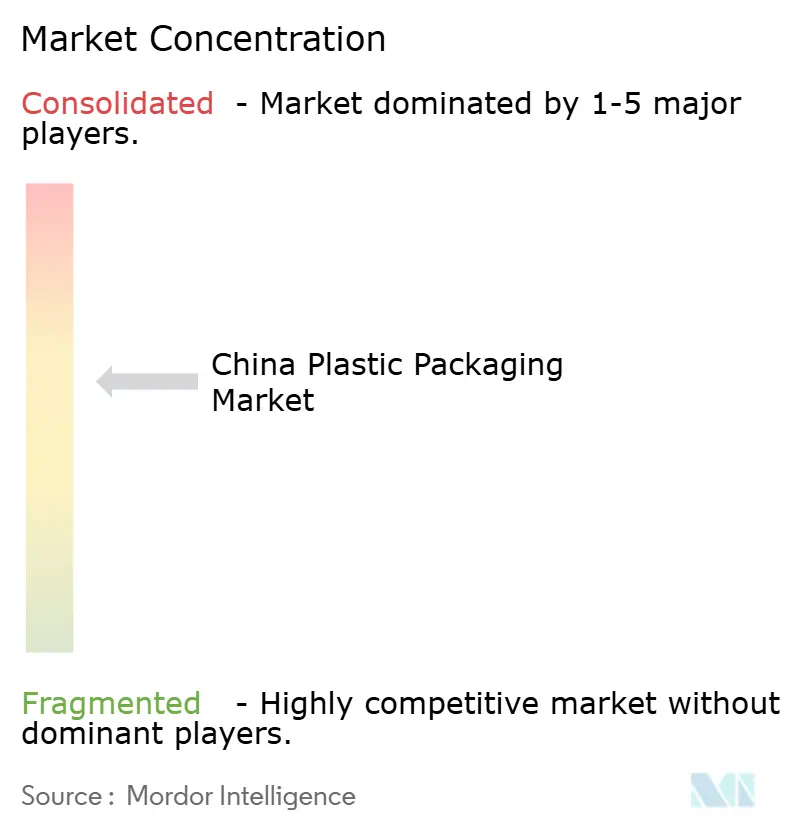
| Market Concentration | Medium |
Major Players *Disclaimer: Major Players sorted in no particular order Image © Mordor Intelligence. Reuse requires attribution under CC BY 4.0. | |
China Plastic Packaging Market Analysis by Mordor Intelligence
The China plastic packaging market size is expected to grow from 15.14 million tons in 2025 to 15.78 million tons in 2026 and is forecast to reach 19.39 million tons by 2031 at 4.21% CAGR over 2026-2031. Sustained e-commerce expansion, cold-chain penetration, and recycled-content mandates underpin the steady trajectory, while down-gauging techniques and digital printing bolster cost efficiency and brand agility. Stiffer provincial VOC rules raise compliance costs, but smart-factory investments in inland clusters cut freight lead-times and unlock new customers. Multinational majors and well-capitalized domestic players are therefore widening competitive moats, even as carbon-border measures reshape export flows. Overall, the China plastic packaging market balances regulatory rigor with innovation to remain resilient in a fast-evolving consumer economy.[1]China Packaging Federation, “Industry Development Report 2024,” CPP114.COM
Key Report Takeaways
- By material type, polyethylene held 40.22% of the China plastic packaging market share in 2025, while polyethylene terephthalate is advancing at a 6.18% CAGR through 2031.
- By packaging type, flexible formats commanded 55.25% revenue share in 2025; the same segment is growing at a 6.58% CAGR to 2031.
- By product form, pouches and sachets accounted for 35.92% of the China plastic packaging market size in 2025 and films and wraps are expanding at a 5.12% CAGR through 2031.
- By end-user industry, food packaging led with 29.10% share in 2025, whereas cosmetics and personal care are forecast to climb at a 6.39% CAGR to 2031.
- By manufacturing process, extrusion held 27.15% share in 2025, while thermoforming is on track for a 5.63% CAGR to 2031.
Note: Market size and forecast figures in this report are generated using Mordor Intelligence’s proprietary estimation framework, updated with the latest available data and insights as of 2026.
China Plastic Packaging Market Trends and Insights
Drivers Impact Analysis*
| Driver | (~) % Impact on CAGR Forecast | Geographic Relevance | Impact Timeline |
|---|---|---|---|
| Surging demand from e-commerce logistics and cold-chain food distribution | +1.2% | National – tier-1 and tier-2 cities | Short term (≤ 2 years) |
| Mandatory recycled-content quotas in China’s 2025 Plastic-Pollution Action Plan | +0.8% | National – stricter in eastern provinces | Medium term (2-4 years) |
| Down-gauging and mono-material shift lowering resin costs for converters | +0.7% | National – coastal hubs | Medium term (2-4 years) |
| High-speed digital printing unlocking SKU proliferation for FMCG brands | +0.6% | Consumer-goods clusters nationwide | Short term (≤ 2 years) |
| Capital migration from coastal to inland smart-factory clusters cutting freight lead-times | +0.5% | Central and western China | Long term (≥ 4 years) |
| E-commerce logistics drive packaging innovation | +0.4% | National | Short term (≤ 2 years) |
| Source: Mordor Intelligence | |||
E-Commerce Logistics Drive Packaging Innovation
China’s online retail sales surpassed CNY 13 trillion (USD 1.8 trillion) in 2024, compelling converters to supply protective yet lightweight formats that survive automated sortation and long cross-country hauls.[2]National Bureau of Statistics, “E-commerce Transaction Volume 2024,” STATS.GOV.CN Cold-chain parcel volume grew 23% in 2024, spurring demand for high-barrier films and temperature-monitoring smart labels. Brands also seek packaging that elevates unboxing experiences, nudging suppliers toward mono-material laminate pouches compatible with recycling streams. As e-commerce platforms tighten sustainability targets, converters investing in thinner gauges and curbside-recyclable designs capture contracts from leading marketplaces. In parallel, investment in printed QR codes enables real-time traceability, strengthening consumer trust and supply-chain visibility.
Recycled-Content Mandates Reshape Material Flows
The 2025 Plastic-Pollution Action Plan requires 30% recycled content in most packaging by 2026, immediately tightening supply of food-grade rPET and rPE. Sinopec and CNPC committed over CNY 5 billion (USD 700 million) to chemical-recycling lines that upcycle post-consumer bottles into virgin-equivalent pellets. Price premiums for certified recycled resin reached 8-12% over virgin grades in 2024, pressuring converters’ margins yet rewarding vertically integrated players with captive recycling. Certifications under ISO 14855 on biodegradability gain traction as alternate compliance pathways, particularly for flexible films targeting fresh-food and snack markets. The policy environment effectively accelerates consolidation, given that small converters struggle to secure consistent recycled feedstock at viable prices.
Down-Gauging Technologies Reduce Material Consumption
Multi-layer co-extrusion and advanced resin formulations now allow converters to shave 15-20% thickness in common stand-up pouches without compromising oxygen or moisture barriers. Material savings translate into roughly 12-15% cost reduction per unit for high-volume SKUs. Mono-material laminates are gaining because they eliminate polyethylene-to-nylon adhesive layers, simplifying after-use recycling. Big converters are procuring precision dies and optical sensors that ensure tight gauge control, whereas smaller firms face capital constraints that limit adoption. International brands reward down-gauged packaging by allocating supply awards to converters that document material reduction under life-cycle-assessment frameworks, reinforcing the trend.
High-Speed Digital Printing Enables Mass Customization
Press speeds exceeding 120 m/min coupled with variable-data software let converters print batch-size-one jobs profitably. Cosmetics and personal-care brands leverage the capability to launch seasonal designs, QR-linked loyalty programs, and language-localized SKUs without plate-making delays. Food and beverage companies leverage digital presses certified for food contact to release limited-edition runs tied to sports events and festivals. The equipment also dovetails with Industry 4.0 workflows, allowing web-inspection AI to adjust color in real time. Resulting lead-time reductions improve inventory turnover and cut obsolete stock, a benefit that resonates with retailers demanding agile supply.
Restraints Impact Analysis*
| Restraint | (~) % Impact on CAGR Forecast | Geographic Relevance | Impact Timeline |
|---|---|---|---|
| Volatility in polyolefin feedstock pricing linked to crude-oil cycles | -0.9% | Nationwide – import-dependent regions | Short term (≤ 2 years) |
| Stricter provincial VOC caps raising compliance capex for small converters | -0.6% | Eastern and southern provinces | Medium term (2-4 years) |
| EU CBAM and US green-tariff exposure eroding export competitiveness | -0.4% | Coastal exporters | Long term (≥ 4 years) |
| Feedstock price volatility pressures margins | -0.3% | Nationwide | Short term (≤ 2 years) |
| Source: Mordor Intelligence | |||
Feedstock Price Volatility Pressures Margins
Polyolefin spot prices swung 25-30% during 2024, echoing crude-oil turbulence and periodic cracker shutdowns. While tier-one converters hedge through long-term supply contracts and financial derivatives, smaller players lack balance-sheet depth, forcing them to absorb cost spikes or cede orders. Volatility complicates fixed-price agreements with brand owners that insist on cost stability. Consequently, converters diversify into recycled resins and bio-based alternatives to buffer against petrochemical swings, though these materials remain costlier. Heightened input uncertainty may accelerate merger activities as financially stressed firms seek buyers with stronger procurement leverage.
Environmental Compliance Costs Burden Small Players
In 2024, eastern provinces cut VOC emission limits to 50 mg/m³ for flexographic and gravure printing, compelling installation of regenerative thermal oxidizers priced at CNY 2-5 million (USD 280,000-700,000) per line. Continuous monitoring and reporting further add OPEX complexity. Global majors with ISO 14001 systems absorb the spend, but family-owned converters often shut older lines, hastening industry consolidation. Some migrate to inland provinces with more lenient interim standards, yet local governments increasingly harmonize rules, narrowing arbitrage windows. Net-net, compliance requirements tilt competitive advantage toward scale players able to amortize environmental expenditures across high output volumes.
*Our forecasts treat driver/restraint impacts as directional, not additive. The impact forecasts reflect baseline growth, mix effects, and variable interactions.
Segment Analysis
By Material Type: PET Recycling Drives Growth Acceleration
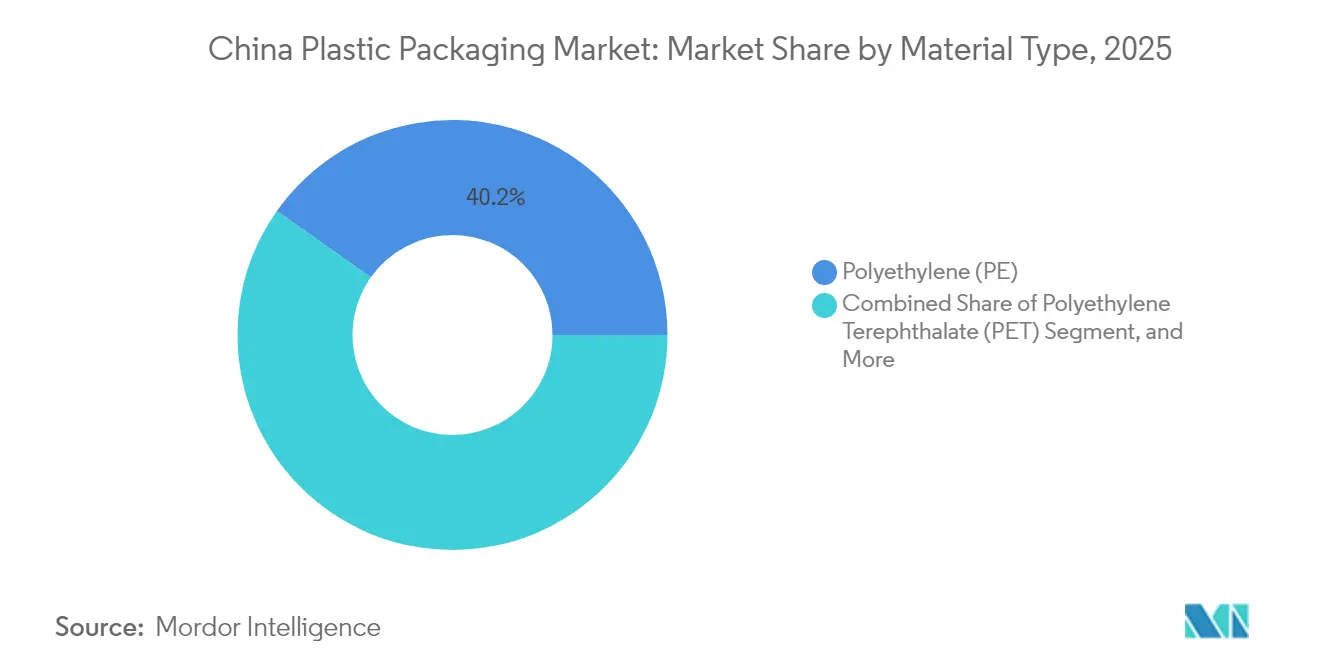
Polyethylene continued to command 40.22% of the China plastic packaging market size in 2025, underpinned by its processability and cost advantage across food pouches, stretch films, and commodity containers. Polyethylene terephthalate is the clear volume gainer, propelled by a 6.18% CAGR to 2031, as beverage bottlers embrace closed-loop recycling and cosmetics brands prefer transparent, premium-looking jar .
Multi-layer barrier coatings now elevate PET’s oxygen-scavenging properties, opening doors in medicine and high-value cosmetics. Chemical recycling platforms co-developed by Sinopec produce 100,000 tons per year of food-grade rPET pellets, directly feeding converters with secure supply. Conversely, polystyrene is losing share because dine-in chains shun foam clamshells to meet provincial bans. Bio-based PLA, PHA, and other niche resins gain pilot-scale traction in cutlery and snack wrappers, yet their collective volume remains below 2% of the market given higher cost and processing barriers.



By Packaging Type: Flexible Solutions Dominate Innovation
Flexible formats comprised 55.25% of the overall volume in 2025 and are forecast to outpace rigid alternatives at a 6.58% CAGR. Brands appreciate lower shipping costs, evolving from 20 g PET bottles to 8 g mono-PE spouted pouches for household cleaners. At the same time, recyclability gains as single-material laminates replace mixed-substrate snack bags.
Rigid packaging retains relevance in carbonated drinks, injectables, and heavy-duty industrial polymer drums where structural integrity is paramount. Lightweighting in blow-molded bottles has trimmed gram weights by 10% since 2023, but flexible stand-up pouches still undercut total packaging mass by at least 30%. Moreover, flexible form-fill-seal systems facilitate shorter production runs aligned with mass-customized marketing, whereas rigid lines demand higher changeover cost and downtime.
By Product Form: Films Drive E-Commerce Growth
Pouches and sachets led with 35.92% share in 2025 owing to portion-control convenience across condiments, nutraceuticals, and trial-size cosmetics. Yet, stretch and shrink films are expanding faster, riding a 5.12% CAGR as omnichannel retailers wrap mixed-SKU parcels and perishable food crates for cross-provincial shipping, strengthening demand for plastic packaging films across the country.
Advances in nano-clay and EVOH co-extrusion provide high oxygen barriers while preserving transparency, essential for ready-meal trays displayed through last-mile cold-chain. Films also benefit from post-industrial scrap recycling loops that are simpler than multi-layer pouches. Bottles remain the workhorse for beverages and OTC pharmaceuticals, but composite materials like PET-aluminum integrate foil layers, complicating recovery. Trays gain share in premium bakery and fresh-cut produce, especially when thermoformed from rPET sheets certified for direct food contact.
By End-User Industry: Cosmetics Accelerate Premium Trends
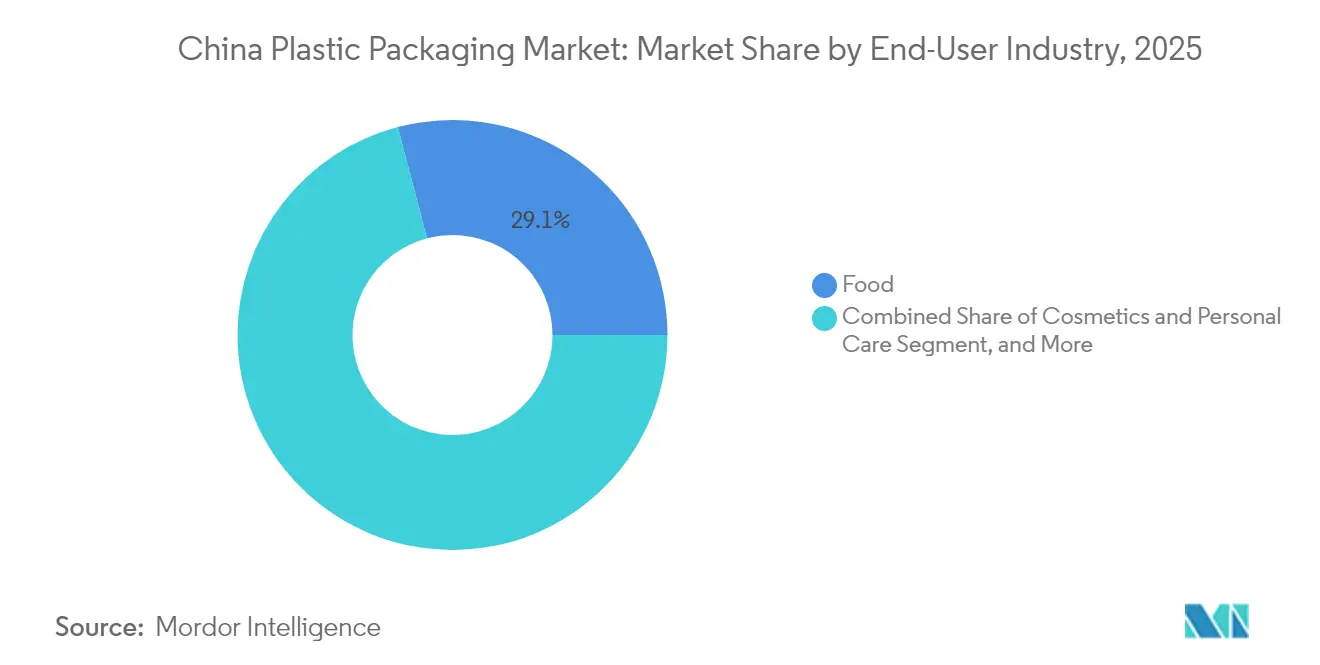
Food maintained a 29.10% lead in 2025, fueled by the spread of convenience retail formats and frozen meal uptake across urban centers. Yet cosmetics and personal-care products are sprinting ahead, rising at a 6.39% CAGR as Gen-Z consumers gravitate toward premium serums packaged in glossy, recyclable containers.
Sustainability messaging drives refill-and-reuse schemes for skin-care jars, often executed with mono-material PP inserts that snap into decorated outer shells. Beverage players push toward aseptic pouches for dairy and functional drinks, partly to cut cold-chain logistics. Pharmaceuticals rely on stringent ISO-class cleanroom packaging, cushioning demand for multilayer blister packs and injection vials. Industrial segments such as automotive lubricants and agrochemicals increasingly specify UN-certified drums molded from high-molecular-weight HDPE to satisfy hazardous-goods transit rules.
By Manufacturing Process: Thermoforming Gains Precision Applications
Extrusion held a 27.15% share in 2025 on its ubiquity for film and sheet production that feeds bag-making, lamination, and thermoforming. Thermoforming, however, is growing fastest at 5.63% CAGR because retailers demand rigid trays with intricate geometry for shelf-ready presentation.
Modern servo-driven thermoformers cut cycle times while slashing trim waste, allowing thinner gauges and rPET content exceeding 60%. Injection molding supports fine-thread bottle necks and child-resistant caps for pharmaceuticals, whereas stretch-blow molding sustains light-weighted PET bottles. Industry 4.0 deployments integrate sensors and predictive analytics across extrusion, printing, and converting lines, enabling closed-loop process adjustments that boost yields and reduce off-grade scrap.
Geography Analysis
Eastern seaboard provinces Shanghai, Jiangsu, and Zhejiang produced roughly 60% of the China plastic packaging market in 2025, leveraging dense supplier parks, skilled labor, and port access. Pearl River Delta clusters in Guangdong specialize in export-oriented rigid containers and industrial sacks but face escalating wage bills and stringent emission controls.
Central megacities such as Chongqing, Chengdu, and Wuhan now attract greenfield investments with 30% lower land costs and newly commissioned high-speed rail lines that compress east-west transit to under 48 hours. Government tax breaks and renewable-power availability bolster project economics, prompting majors to relocate growth capacity inland. This inland pivot enables consumer-goods brands to replenish western store shelves faster, trimming stock-out risk.
Northern provinces including Hebei and Tianjin concentrate on medical, pharmaceutical, and frozen-food applications, benefitting from proximity to national drug manufacturers and grain processing hubs. Yet heightened air-quality campaigns enforce stricter VOC baselines, compelling converters to upgrade solvent-based ink lines or switch to water-based systems. Border regions adjoining ASEAN capture incremental demand by exporting laminates and wraps under the Regional Comprehensive Economic Partnership, though compliance with origin rules requires localized resin sourcing.
Regulatory Landscape
China plastic packaging regulation is shaped by national waste-reduction programs and environmental compliance enforcement, with the National Development and Reform Commission (NDRC) and the Ministry of Ecology and Environment (MEE) anchoring plastic-pollution control under the 14th Five-Year Plan framework. In March 2026, China adopted the Ecological Environment Code of the People's Republic of China (effective August 2026), strengthening life-cycle management expectations for materials and production processes, including emphasis on low-VOC products and tighter environmental accountability across the packaging chain.
Standardization work led by the State Administration for Market Regulation (SAMR) and the Standardization Administration of China (SAC) is also tightening technical requirements for packaging design and recycled plastics. National standards under development across 2024-2026 includes areas such as design for easy recovery and recycling, traceability and environmental assessment of recycled plastics, and greenhouse-gas emission accounting for plastic enterprises, which increases documentation and verification requirements for converters and brand owners seeking compliant recycled-content packaging.
Value Chain Analysis
The China plastic packaging value chain starts with upstream resin and additive supply (virgin PE, PP, PET and growing volumes of recycled rPET/rPE), followed by midstream converting operations spanning extrusion and film production, printing (gravure/flexo/digital), lamination, and downstream forming (thermoforming, injection, blow molding). Converters then supply brand owners and contract packers across food, beverage, pharmaceuticals, cosmetics, and industrial end uses, with e-commerce and express logistics players acting as high-volume specifiers for secondary and transit packaging that must withstand automated handling and long-haul distribution.
A key structural shift in the chain is tighter integration between recyclers, resin producers, and converters to secure compliant PCR supply and certification, prompted by recycled-content mandates and design-for-recycling requirements. This is reinforcing partnerships across chemical producers, industry associations, and logistics platforms to build closed-loop collection and reprocessing streams, while stricter provincial VOC limits are pushing investment in cleaner printing and solvent-free lamination technologies that small converters struggle to fund, which accelerates consolidation and inland capacity migration.
Competitive Landscape
The China plastic packaging market is moderately concentrated, with the top five groups controlling roughly 45-50% of domestic output. Amcor, Berry Global, and Huhtamaki retain technological leadership via high-barrier structures, digital printing assets, and food-grade recycling plants. Domestic challengers Zhuhai Zhongfu, COFCO Packaging, and Southern Packaging Group leverage agile decision-making and low overhead to under-price imports while meeting strict lead-times.[3]Shanghai Stock Exchange, “Listed Company Performance Analysis 2024,” SSE.COM.CN
Sustainability is a focal point of competition. COFCO’s chemical-recycling venture with Sinopec guarantees captive rPET supply, underpinning beverage contracts. Amcor’s Suzhou expansion lifts flexible-pack capacity by 40% and introduces solvent-free lamination that aligns with provincial emission caps. Berry Global’s 2024 buy-out of Guangdong Danjia adds rigid tubs and thin-wall IML know-how, broadening its FMCG portfolio.
Innovation intensity is rising: Chinese converters filed 34% more packaging patents in 2024 than 2023, with emphasis on barrier coatings, bio-based resins, and digital-workflow automation. Capital expenditure increasingly flows to robotics and AI-powered inspection, elevating consistent quality while mitigating labor shortages. Exporters, however, face looming EU CBAM levies that favor converters able to certify low-carbon footprints.
China Plastic Packaging Industry Leaders
Amcor plc
Huhtamaki Oyj
Sealed Air Corporation
Winpak Ltd.
Silgan Holdings Inc.
- *Disclaimer: Major Players sorted in no particular order

Market Opportunities and Future Outlook
Recycled-content compliance and traceability are creating whitespace for converters that can lock in certified PCR supply, validate carbon and environmental data, and redesign structures toward mono-material formats. The policy push was reinforced by the State Council issuing a Solid Waste Comprehensive Management Action Plan in January 2026, which includes measures targeting greener express delivery packaging and broader solid-waste controls, increasing the need for compliant packaging specifications across e-commerce and FMCG supply chains.
On the supply side, new resin and converting investments are creating opportunities for higher-performance packaging structures and localized supply resilience. In March 2026, Dushanzi Petrochemical commissioned a 450 ktpa PP unit as part of the Tarim Phase II ethylene project, supporting specialty PP availability for higher-grade packaging applications. Capacity additions and upgrades by packaging producers, including expansions in South China and inland projects linked to green manufacturing, are also opening room for faster lead times and upgraded capabilities such as automation, high-barrier films, and recyclable flexible packaging aligned with evolving standards and provincial emission controls.
Recent Industry Developments
- July 2026: Amcor commenced an expansion of its flexible packaging facility in Dongguan, China, adding about 7,000 square meters of manufacturing space and an automated warehouse. The project increases local capacity and operational resilience for customers sourcing flexible formats in South China, with the automation element supporting shorter lead times and more consistent quality.
- November 2025: Amcor announced plans to explore a new factory in Jiangyin, Jiangsu province, focused on medical, pharmaceutical, and food packaging. The announcement points to targeted capacity planning toward higher-specification applications that require compliance, cleanliness controls, and reliable supply for regulated end markets.
- March 2024: Huhtamaki announced consolidation of its production footprint in China, including the closure of production sites in Tianjin and Shanghai with operations transferred to Guangzhou. The restructuring concentrates output in fewer sites, supporting scale efficiencies and a more streamlined manufacturing network for serving foodservice packaging demand.


Research Methodology Framework and Report Scope
Market Definition and Coverage
For this methodology, the China plastic packaging market covers plastic-based packaging products used to pack, protect, and distribute goods in China, counted at the point where packaging is sold into end-use demand.
Scope exclusions: We exclude paper, metal, and glass packaging, as well as packaging machinery and packaging services.
Segmentation Overview
- By Material Type
- Polyethylene (PE)
- Polypropylene (PP)
- Polyethylene Terephthalate (PET)
- Polystyrene and EPS
- Other Material Types
- By Packaging Type
- Flexible Plastic Packaging
- Rigid Plastic Packaging
- By Product Form
- Bottles and Jars
- Trays and Containers
- Pouches and Sachets
- Bags and Sacks
- Films and Wraps
- Other Product Forms
- By End-User Industry
- Food
- Beverage
- Pharmaceuticals and Healthcare
- Cosmetics and Personal Care
- Industrial
- Other End-user Industries
- By Manufacturing Process
- Extrusion
- Injection Molding
- Blow Molding
- Thermoforming
Data Sources, Market Sizing, and Validation
Desk Research
Desk work starts with building the demand context for packaged goods and the plastics supply chain in China, and then linking it back to packaging output. We mainly use public statistics and policy sources to understand packaging use intensity, manufacturing output signals, and trade movements that can push packaging volumes up or down.
Common inputs include sources such as the National Bureau of Statistics of China, China Customs trade statistics, MIIT and related regulator circulars on plastics and recycling, standards and notices from national standardization bodies, and peer-reviewed journals covering packaging and polymer processing. To refine company presence and cross-check activity patterns, we also review annual reports, investor presentations, association websites, and credible press coverage, supported by a paid subscription for company financials and another for patent and invention tracking where it helps clarify technology shifts. The specific desk sources listed here are illustrative and not exhaustive, since many other references are used for data collection, validation, and research clarification.
Primary Interviews and Surveys
Primary checks are used to confirm real-world packaging demand and to pressure-test assumptions that are difficult to read directly from public data, such as product mix shifts and effective utilization rates. We speak with stakeholders across packaging producers, converters, distributors, and large end users, then re-check the most sensitive inputs across coastal manufacturing hubs and inland consumption centers.
Distribution of primary research fieldwork respondents
| Company type | Respondent position |
|---|---|
| Top tier: 29% | CXOs: 18% |
| Mid tier: 53% | Functional/Unit leaders: 38% |
| Smaller Players: 18% | Managers: 44% |
Market-Sizing & Forecasting
Sizing is built using a top-down approach where packaged end-use activity is converted into packaging demand using category-level usage factors, then translated into plastic packaging volume. In practice, this means using production and trade indicators for packaged goods, plus plastics conversion signals, to reconstruct the addressable packaging output in tons, which is then split into the right packaging forms.
To keep totals realistic, selective bottom-up approximations are also used as checks. These include sampling typical throughput by packaging lines, sanity-checking resin-to-packaging conversion ranges, and validating a few high-volume applications using volume times typical weight-per-pack assumptions. Key model inputs (illustrative) include packaged food and beverage output trends, e-commerce parcel intensity, share shifts between flexible and rigid packs, recycled content adoption pace, and manufacturing utilization changes by packaging process (extrusion, injection molding, blow molding, and thermoforming). When a bottom-up check is incomplete, the gap is handled using proxy ratios anchored to comparable product forms, and then adjusted through interview feedback.
For forecasting, scenario analysis is used around a base case, since policy actions on plastics, changes in consumer pack sizes, and sustainability-led substitution can move demand faster than a single trend line suggests. Those scenarios are tied back to expected trajectories for end-use output and packaging mix, then aligned with what industry experts consider achievable over the forecast window.
Data Validation & Update Cycle
Validation is done through several passes, where totals are reconciled against independent signals such as resin demand direction, packaging conversion activity, and end-use production movements. When a segment looks out of range, the assumptions are reopened, and follow-up conversations are triggered to confirm whether the change is real or data timing related.
Before sign-off, the model is reviewed by another analyst, and variance checks are run across packaging type, process, and end-use splits so the full picture remains consistent. Reports are refreshed annually, with interim updates when material events occur, and a final pre-delivery review is completed so the client receives the most current view available.
Mordor Intelligence's China Plastic Packaging Market Size Versus Other Published Estimates
Published market numbers for China plastic packaging often do not align because the unit of measure, counting point, and inclusion rules for what gets treated as packaging are not handled the same way. Differences also come from how firms treat trade flows, whether they model demand in volume or revenue, and how frequently they refresh assumptions that react to policy and consumption shifts.
The gaps are usually explained by scope boundaries and the underlying mechanics of the model, not by one single data point. Some studies present revenue-based totals that fold in a broader packaging value chain, while other studies treat production or consumption values as the market without separating domestic use from export-driven output, and currency timing can widen the spread when numbers are converted to USD.
Benchmark comparison
| Source | Market Size | Gaps in Research Methodology |
|---|---|---|
| Mordor Intelligence | USD 15.78 M (2026) | |
| Global Publisher A | USD 50.52 B (2024) | Reported in revenue terms and tends to blend packaging value with broader pricing assumptions, which makes it hard to reconcile against a tonnage-based demand pool and packaging weight intensity. |
| Industry Publisher B | USD 48.40 B (2024) | Apparent consumption framing mixes production and trade in value terms, and it can overstate domestic demand when export-oriented packaging output and higher unit values are not separated cleanly. |
The table shows a large spread mainly because the baseline is presented in tons, and then compared with USD-based totals from other sources. In Mordor Intelligence's model, the market is sized and forecast in volume for China plastic packaging (15.78 million tons in 2026), which reduces distortion from price swings and currency conversion and keeps the count tied to mix shifts and process utilization.


Key Questions Answered in the Report
How fast is the China plastic packaging market expected to grow through 2031?
Volume is projected to expand from 15.78 million tons in 2026 to 19.39 million tons by 2031, reflecting a 4.21% CAGR.
Which packaging format is expanding quickest in China?
Flexible solutions, especially stand-up pouches and high-barrier films, are leading growth at a 6.58% CAGR to 2031.
What role does recycled PET play in beverage packaging?
Recycled PET is gaining traction because the 2025 Plastic-Pollution Action Plan mandates 30% recycled content, prompting chemical-recycling investments and supply agreements with beverage bottlers.
Why are inland provinces attracting new packaging plants?
Lower land costs, improved rail links, and tax incentives cut freight lead-times and operating expenses, enticing converters to relocate capacity from the crowded coast.
How are converters mitigating feedstock price swings?
Larger players hedge long-term resin contracts, diversify into recycled materials, and invest in process efficiencies that reduce resin consumption by up to 20%.
Which end-user segment is set to outpace food in growth terms?
Cosmetics and personal care packaging is poised for a 6.39% CAGR, fueled by premium product launches and consumer preference for sustainable, visually appealing packs.
Page last updated on:





