Legumes Market Size and Share
Legumes Market Analysis by Mordor Intelligence
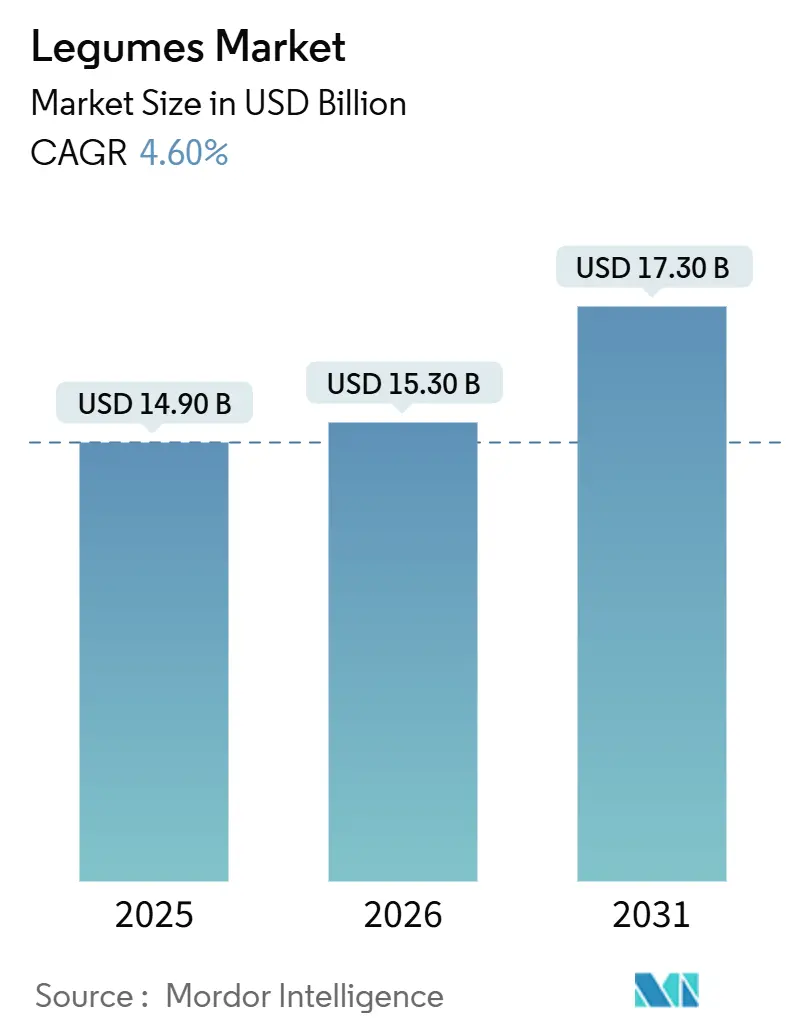
The legumes market size is projected to expand from USD 14.90 billion in 2025 and USD 15.30 billion in 2026 to USD 17.30 billion by 2031, registering a CAGR of 4.60% between 2026 and 2031. Nitrogen-fixing rotations that qualify for carbon-credit payments, accelerating use of pulse proteins in aquafeed, and modular near-farm processing hubs are reshaping farm-gate economics and trade flows in the legumes market[1]Source: UK Department for Environment, Food and Rural Affairs, “Nature for Climate Fund,” gov.uk. Asia-Pacific supplies more than half of global output, while Africa records the fastest consumption growth as local nutrition mandates favor indigenous pulses. North America anchors export logistics on the strength of Canadian yellow-pea and United States chickpea shipments, whereas South America is adding lentil acreage as currency trends improve farmer margins. Carbon-farming subsidies in the United Kingdom, United States, and Canada, along with European eco-schemes, are lowering growers’ cost of capital and underpin a multiyear expansion of pulse hectares[2]Source: United States Department of Agriculture, “Climate-Smart Commodities Program,” usda.gov. At the same time, blockchain-verified traceability and containerized milling allow cooperatives to capture double-digit price premiums, intensifying competition in the global legumes market.
Key Report Takeaways
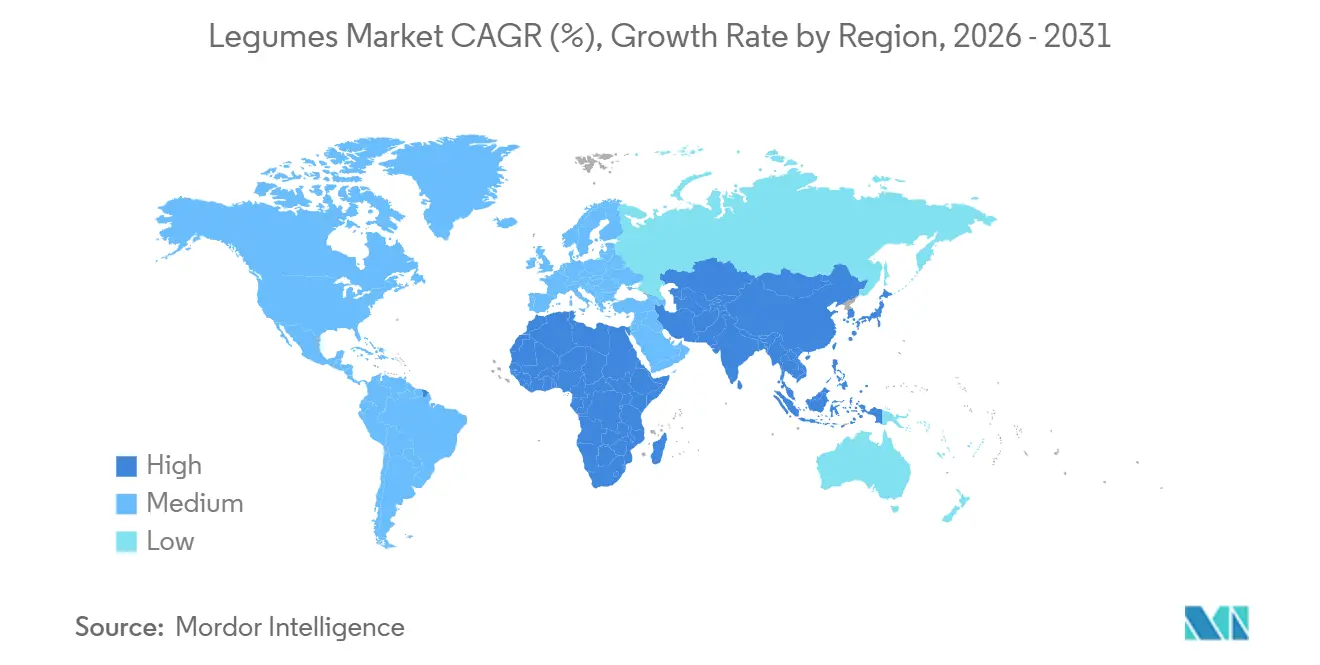
- By geography, Asia-Pacific led with 50.5% share of the legumes market size in 2025, while Africa is forecast to post the fastest 6.1% CAGR through 2031.
Note: Market size and forecast figures in this report are generated using Mordor Intelligence’s proprietary estimation framework, updated with the latest available data and insights as of January 2026.
Global Legumes Market Trends and Insights
Drivers Impact Analysis*
| Driver | (~) % Impact on CAGR Forecast | Geographic Relevance | Impact Timeline |
|---|---|---|---|
| Rising demand for legume-based aquafeed protein concentrates | +0.5% | China, Vietnam, Thailand, Norway, and Chile | Medium term (2-4 years) |
| Carbon-farming incentives for nitrogen-fixing pulse rotations | +0.6% | North America, Europe, Australia, and South America | Long term (≥ 4 years) |
| Surge in pulse-protein isolates for alternative dairy formulations | +0.4% | North America, Europe, and Asia-Pacific | Medium term (2-4 years) |
| Near-farm containerized pulse-processing capacity build-outs | +0.3% | Africa, South Asia, South America, and Central Asia | Short term (≤ 2 years) |
| Blockchain traceability premiums in certified sustainable trade | +0.2% | North America, Europe, Australia, South America, and Africa | Long term (≥ 4 years) |
| Heat- and drought-tolerant germplasm unlocking semi-arid acreage | +0.4% | Middle East, North Africa, Australia, South Asia, and South America | Long term (≥ 4 years) |
| Source: Mordor Intelligence | |||
Rising Demand for Legume-Based Aquafeed Protein Concentrates
Large feed manufacturers are blending 20-30% pea or lupin isolates into rations for shrimp, tilapia, and salmon to counter high fishmeal costs and meet sustainability scorecards. Lupin protein delivers up to 42% crude protein and maintains feed-conversion ratios on par with soybean meal in Atlantic salmon trials[3]Source: Commonwealth Scientific and Industrial Research Organisation, “Lupin Protein in Aquafeed,” csiro.au. Norway’s salmon farms and Chile’s trout industry are piloting faba-bean protein, while Asian hatcheries adopt pea concentrate at a commercial scale. As aquaculture output in the Asia-Pacific tops 70 million metric tons annually, incremental pulse demand boosts export values in the legumes market. Medium-term gains are projected as mills retrofit lines for pulse concentrates and regulatory approvals broaden ingredient lists.
Surge in Pulse-Protein Isolates for Alternative Dairy Formulations
More than 40 new chickpea-based yogurts and beverages launched across North America and Europe in 2025, capitalizing on neutral flavor and allergen-free labeling. Faba-bean isolates with 80–85% protein are moving into cream cheese substitutes, and lentil isolates feature in fortified drinks for iron and folate content. Asia-Pacific wet-fractionation plants in China and India are scaling capacity to supply global brands, redirecting export-grade pulses from commodity to ingredient channels. The shift increases value capture for processors and heightens ingredient competition within the legumes market.
Blockchain Traceability Premiums in Certified Sustainable Trade
Canadian exporters proved that blockchain-verified yellow peas and red lentils command 8–12% price premiums in Europe and the Middle East. Australian shippers integrated satellite imagery and soil-sensor data to automate sustainability reports. African cooperatives in Tanzania and Ethiopia are onboarding donor-funded platforms to enter organic and fair-trade channels. As digital lot tracking becomes a procurement prerequisite for multinational buyers, long-term adoption raises transparency standards across the legumes market.
Heat- and Drought-Tolerant Germplasm Unlocking Semi-Arid Acreage
The Commonwealth Scientific and Industrial Research Organization (CSIRO) released chickpea and lentil lines that yield 15–20% higher with under 400 millimeters of annual rainfall. India’s research institutes introduced cultivars that flower at temperatures above 35 °C, opening central and southern districts to pulse planting[4]Source: Indian Council of Agricultural Research, “Heat-Tolerant Chickpea Varieties,” icar.org.in. Morocco, Tunisia, and Jordan adopt similar genetic approaches to minimize irrigation requirements, while Argentina and Brazil expand into semi-arid zones. Long-term seed innovation enlarges the productive footprint and buffers climate risks for the legumes market.
Restraints Impact Analysis*
| Restraint | (~) % Impact on CAGR Forecast | Geographic Relevance | Impact Timeline |
|---|---|---|---|
| Moisture-driven mycotoxin losses in bulk storage chains | −0.3% | Africa, South Asia, tropical South America, and humid Middle East | Short term (≤ 2 years) |
| Fluctuating trade policies, such as quotas, tariffs, and export bans | −0.4% | Asia-Pacific, Middle East, and Africa | Medium term (2-4 years) |
| Limited mechanization and threshing efficiency in smallholder systems | −0.2% | Sub-Saharan Africa, South Asia, Central America, and Southeast Asia | Long term (≥ 4 years) |
| Phytosanitary import rejections tied to contaminant thresholds | −0.2% | Europe, North America, exporters in Africa, South Asia, and South America | Medium term (2-4 years) |
| Source: Mordor Intelligence | |||
Moisture-Driven Mycotoxin Losses in Bulk Storage Chains
Relative humidity above 70% in tropical warehouses allows Aspergillus fungi to produce aflatoxin B1 beyond Codex limits within weeks. European regulations cap aflatoxin at 2 µg/kg for direct consumption, triggering frequent rejections of African and South Asian cargoes in 2025[5]Source: European Commission, “Rapid Alert System for Food and Feed,” ec.europa.eu. Sub-Saharan farmers lacking hermetic bags lose up to 15% of volume, undercutting incomes and shortening the legumes market supply pipeline. Short-term mitigation hinges on humidity-controlled silos and affordable moisture barriers.
Fluctuating Trade Policies such as Quotas, Tariffs, and Export Bans
India’s 2024–2025 bans on chickpea and pigeon-pea exports disrupted long-term contracts with Middle Eastern importers, forcing them to pay 10–15% premiums for Myanmar or Tanzanian supplies. Russia’s pea quota shifted European buyers toward Canadian and Australian origins, even with higher freight costs. Policy swings elevate procurement uncertainty, depress forward contracting, and shave 0.4% percentage points from the global CAGR of the legumes market.
*Our forecasts treat driver/restraint impacts as directional, not additive. The impact forecasts reflect baseline growth, mix effects, and variable interactions.
Geography Analysis
Asia-Pacific is projected to dominate the legumes market, with a 50.5% market share in 2025. This dominance is attributed to extensive production capabilities and deeply ingrained dietary habits. The region benefits from large-scale cultivation, diverse crop cycles, and active intra-regional trade. Key producing countries significantly influence global supply balances, while rising domestic demand fueled by income growth and increased protein diversification, sustains strong internal consumption. Additionally, export-oriented activities enhance supply chain resilience, solidifying the region's central role in both production and trade.
Africa is the fastest-growing region in the legumes market, with market size projected to expand at a CAGR of 6.1% through 2031. This growth is driven by rapid population expansion, increased policy support for food security, and the integration of legumes into institutional nutrition programs. Enhanced agricultural extension services and improved post-harvest infrastructure are boosting yield quality and export readiness. Furthermore, the development of regionally competitive supply chains is enabling African producers to access higher-value international markets while meeting growing domestic demand.
North America and Europe contribute distinct yet complementary roles in the legumes market. North America is primarily export-oriented, supported by advanced farming practices and policy incentives promoting sustainable crop rotation. Processors in the region are increasingly targeting international markets to counterbalance stagnating domestic consumption. Europe, on the other hand, is characterized by policy-driven cultivation and a growing consumer preference for plant-based diets. Regulatory support and sustainability initiatives are fostering local production, while reliance on imports for specialty crops ensures continued participation in global trade.


Competitive Landscape
The legumes market is moderately fragmented, characterized by a mix of multinational agribusinesses, regional traders, and origin-focused aggregators that shape global competition. While a select group of leading companies accounts for a significant share of total revenue, the market structure continues to accommodate smaller and mid-sized players. Major firms are increasingly focusing on capital expansion and strategic investments to enhance their processing capabilities, particularly in protein isolation and value-added ingredient development. This trend reflects a shift toward capturing higher margins through downstream integration and meeting the evolving demands of food manufacturers.
Leading global players are advancing vertical integration strategies to secure supply chains and improve control over sourcing, processing, and distribution. Investments in processing infrastructure, especially in pulse fractionation and ingredient innovation, are enabling companies to align more closely with food manufacturers, particularly in plant-based applications. Additionally, large agribusiness groups are expanding their origination networks across multiple geographies, enhancing procurement resilience and improving access to diverse supply bases. These efforts are strengthening operational scale and enabling firms to respond more effectively to changing consumption patterns and industrial demand.
On a structural level, competitive differentiation in the legumes market is increasingly influenced by traceability, sustainability compliance, and digital integration. Technologies such as blockchain-based tracking and carbon verification are becoming essential for exporters seeking access to premium retail channels and compliance with stringent regulatory standards. Simultaneously, the emergence of decentralized processing models driven by smallholder cooperatives adopting modular milling and digital systems is intensifying competition by allowing regional players to move up the value chain. Consequently, the market is evolving into a more competitive yet dispersed landscape, where scale, transparency, and supply chain control are critical for long-term success.
Recent Industry Developments
- July 2025: Bunge Global SA completed its merger with Viterra Limited, forming a leading global agribusiness solutions company with extended reach in legumes origination and processing.
- June 2025: Ports of Indiana selected Louis Dreyfus Company to operate the Burns Harbor export facility, expanding capacity with 195.9 thousand metric tons of storage and strengthening Midwest access to global legumes trade.
- August 2024: India’s Council of Agricultural Research released 69 new pulse varieties within its 100-crop climate-resilient package.


Global Legumes Market Report Scope
Legumes are a group of plants that produce seeds in pods and belong to the Fabaceae (pea) family. They are widely grown for food, animal feed, and soil improvement due to their ability to fix nitrogen. The legumes market report is segmented by geography into North America, Europe, Asia-Pacific, Africa, and other regions. The report includes production analysis (volume), consumption analysis (value and volume), export analysis (value and volume), import analysis (value and volume), wholesale price trend analysis and forecast, list of key players, regulatory framework, logistics and infrastructure, and seasonality analysis. Market forecasts are provided in terms of value (USD) and volume (metric tons).
| North America | United States | Production Analysis (Area Harvested, Yield, Production Volume) |
| Consumption Analysis (Value and Volume) | ||
| Import Market Analysis (Value, Volume, Key Supplying Markets) | ||
| Export Market Analysis (Value, Volume, Key Destination Markets) | ||
| Wholesale Price Trend Analysis and Forecast | ||
| Regulatory Framework | ||
| List of Key Players | ||
| Logistics and Infrastructure | ||
| Seasonality Analysis | ||
| Canada | Production Analysis (Area Harvested, Yield, Production Volume) | |
| Consumption Analysis (Value and Volume) | ||
| Import Market Analysis (Value, Volume, Key Supplying Markets) | ||
| Export Market Analysis (Value, Volume, Key Destination Markets) | ||
| Wholesale Price Trend Analysis and Forecast | ||
| Regulatory Framework | ||
| List of Key Players | ||
| Logistics and Infrastructure | ||
| Seasonality Analysis | ||
| Mexico | Production Analysis (Area Harvested, Yield, Production Volume) | |
| Consumption Analysis (Value and Volume) | ||
| Import Market Analysis (Value, Volume, Key Supplying Markets) | ||
| Export Market Analysis (Value, Volume, Key Destination Markets) | ||
| Wholesale Price Trend Analysis and Forecast | ||
| Regulatory Framework | ||
| List of Key Players | ||
| Logistics and Infrastructure | ||
| Seasonality Analysis | ||
| Europe | Russia | Production Analysis (Area Harvested, Yield, and Production Volume) |
| Consumption Analysis (Consumption Value and Volume) | ||
| Import Market Analysis (Import Value, Volume, and Key Supplying Markets) | ||
| Export Market Analysis (Export Value, Volume, and Key Destination Markets) | ||
| Wholesale Price Trend Analysis & Forecast | ||
| Regulatory Framework | ||
| List of Key Players | ||
| Logistics and Infrastructure | ||
| Seasonality Analysis | ||
| Italy | Production Analysis (Area Harvested, Yield, and Production Volume) | |
| Consumption Analysis (Consumption Value and Volume) | ||
| Import Market Analysis (Import Value, Volume, and Key Supplying Markets) | ||
| Export Market Analysis (Export Value, Volume, and Key Destination Markets) | ||
| Wholesale Price Trend Analysis & Forecast | ||
| Regulatory Framework | ||
| List of Key Players | ||
| Logistic and Infrastructure | ||
| Seasonality Analysis | ||
| France | Production Analysis (Area Harvested, Yield, and Production Volume) | |
| Consumption Analysis (Consumption Value and Volume) | ||
| Import Market Analysis (Import Value, Volume, and Key Supplying Markets) | ||
| Export Market Analysis (Export Value, Volume, and Key Destination Markets) | ||
| Wholesale Price Trend Analysis & Forecast | ||
| Regulatory Framework | ||
| List of Key Players | ||
| Logistic and Infrastructure | ||
| Seasonality Analysis | ||
| Germany | Production Analysis (Area Harvested, Yield, and Production Volume) | |
| Consumption Analysis (Consumption Value and Volume) | ||
| Import Market Analysis (Import Value, Volume, and Key Supplying Markets) | ||
| Export Market Analysis (Export Value, Volume, and Key Destination Markets) | ||
| Wholesale Price Trend Analysis & Forecast | ||
| Regulatory Framework | ||
| List of Key Players | ||
| Logistic and Infrastructure | ||
| Seasonality Analysis | ||
| United Kingdom | Production Analysis (Area Harvested, Yield, and Production Volume) | |
| Consumption Analysis (Consumption Value and Volume) | ||
| Import Market Analysis (Import Value, Volume, and Key Supplying Markets) | ||
| Export Market Analysis (Export Value, Volume, and Key Destination Markets) | ||
| Wholesale Price Trend Analysis & Forecast | ||
| Regulatory Framework | ||
| List of Key Players | ||
| Logistic and Infrastructure | ||
| Seasonality Analysis | ||
| Netherlands | Production Analysis (Area Harvested, Yield, and Production Volume) | |
| Consumption Analysis (Consumption Value and Volume) | ||
| Import Market Analysis (Import Value, Volume, and Key Supplying Markets) | ||
| Export Market Analysis (Export Value, Volume, and Key Destination Markets) | ||
| Wholesale Price Trend Analysis & Forecast | ||
| Regulatory Framework | ||
| List of Key Players | ||
| Logistic and Infrastructure | ||
| Seasonality Analysis | ||
| Asia-Pacific | India | Production Analysis (Area Harvested, Yield, and Production Volume) |
| Consumption Analysis (Consumption Value and Volume) | ||
| Import Market Analysis (Import Value, Volume, and Key Supplying Markets) | ||
| Export Market Analysis (Export Value, Volume, and Key Destination Markets) | ||
| Wholesale Price Trend Analysis & Forecast | ||
| Regulatory Framework | ||
| List of Key Players | ||
| Logistic and Infrastructure | ||
| Seasonality Analysis | ||
| China | Production Analysis (Area Harvested, Yield, and Production Volume) | |
| Consumption Analysis (Consumption Value and Volume) | ||
| Import Market Analysis (Import Value, Volume, and Key Supplying Markets) | ||
| Export Market Analysis (Export Value, Volume, and Key Destination Markets) | ||
| Wholesale Price Trend Analysis & Forecast | ||
| Regulatory Framework | ||
| List of Key Players | ||
| Logistic and Infrastructure | ||
| Seasonality Analysis | ||
| Australia | Production Analysis (Area Harvested, Yield, and Production Volume) | |
| Consumption Analysis (Consumption Value and Volume) | ||
| Import Market Analysis (Import Value, Volume, and Key Supplying Markets) | ||
| Export Market Analysis (Export Value, Volume, and Key Destination Markets) | ||
| Wholesale Price Trend Analysis & Forecast | ||
| Regulatory Framework | ||
| List of Key Players | ||
| Logistic and Infrastructure | ||
| Seasonality Analysis | ||
| Thailand | Production Analysis (Area Harvested, Yield, and Production Volume) | |
| Consumption Analysis (Consumption Value and Volume) | ||
| Import Market Analysis (Import Value, Volume, and Key Supplying Markets) | ||
| Export Market Analysis (Export Value, Volume, and Key Destination Markets) | ||
| Wholesale Price Trend Analysis & Forecast | ||
| Regulatory Framework | ||
| List of Key Players | ||
| Logistic and Infrastructure | ||
| Seasonality Analysis | ||
| Vietnam | Production Analysis (Area Harvested, Yield, and Production Volume) | |
| Consumption Analysis (Consumption Value and Volume) | ||
| Import Market Analysis (Import Value, Volume, and Key Supplying Markets) | ||
| Export Market Analysis (Export Value, Volume, and Key Destination Markets) | ||
| Wholesale Price Trend Analysis & Forecast | ||
| Regulatory Framework | ||
| List of Key Players | ||
| Logistic and Infrastructure | ||
| Seasonality Analysis | ||
| South America | Brazil | Production Analysis (Area Harvested, Yield, and Production Volume) |
| Consumption Analysis (Consumption Value and Volume) | ||
| Import Market Analysis (Import Value, Volume, and Key Supplying Markets) | ||
| Export Market Analysis (Export Value, Volume, and Key Destination Markets) | ||
| Wholesale Price Trend Analysis & Forecast | ||
| Regulatory Framework | ||
| List of Key Players | ||
| Logistic and Infrastructure | ||
| Seasonality Analysis | ||
| Argentina | Production Analysis (Area Harvested, Yield, and Production Volume) | |
| Consumption Analysis (Consumption Value and Volume) | ||
| Import Market Analysis (Import Value, Volume, and Key Supplying Markets) | ||
| Export Market Analysis (Export Value, Volume, and Key Destination Markets) | ||
| Wholesale Price Trend Analysis & Forecast | ||
| Regulatory Framework | ||
| List of Key Players | ||
| Logistic and Infrastructure | ||
| Seasonality Analysis | ||
| Middle East | United Arab Emirates | Production Analysis (Area Harvested, Yield, and Production Volume) |
| Consumption Analysis (Consumption Value and Volume) | ||
| Import Market Analysis (Import Value, Volume, and Key Supplying Markets) | ||
| Export Market Analysis (Export Value, Volume, and Key Destination Markets) | ||
| Wholesale Price Trend Analysis & Forecast | ||
| Regulatory Framework | ||
| List of Key Players | ||
| Logistic and Infrastructure | ||
| Seasonality Analysis | ||
| Saudi Arabia | Production Analysis (Area Harvested, Yield, and Production Volume) | |
| Consumption Analysis (Consumption Value and Volume) | ||
| Import Market Analysis (Import Value, Volume, and Key Supplying Markets) | ||
| Export Market Analysis (Export Value, Volume, and Key Destination Markets) | ||
| Wholesale Price Trend Analysis & Forecast | ||
| Regulatory Framework | ||
| List of Key Players | ||
| Logistic and Infrastructure | ||
| Seasonality Analysis | ||
| Turkey | Production Analysis (Area Harvested, Yield, and Production Volume) | |
| Consumption Analysis (Consumption Value and Volume) | ||
| Import Market Analysis (Import Value, Volume, and Key Supplying Markets) | ||
| Export Market Analysis (Export Value, Volume, and Key Destination Markets) | ||
| Wholesale Price Trend Analysis & Forecast | ||
| Regulatory Framework | ||
| List of Key Players | ||
| Logistic and Infrastructure | ||
| Seasonality Analysis | ||
| Africa | Egypt | Production Analysis (Area Harvested, Yield, and Production Volume) |
| Consumption Analysis (Consumption Value and Volume) | ||
| Import Market Analysis (Import Value, Volume, and Key Supplying Markets) | ||
| Export Market Analysis (Export Value, Volume, and Key Destination Markets) | ||
| Wholesale Price Trend Analysis & Forecast | ||
| Regulatory Framework | ||
| List of Key Players | ||
| Logistic and Infrastructure | ||
| Seasonality Analysis | ||
| South Africa | Production Analysis (Area Harvested, Yield, and Production Volume) | |
| Consumption Analysis (Consumption Value and Volume) | ||
| Import Market Analysis (Import Value, Volume, and Key Supplying Markets) | ||
| Export Market Analysis (Export Value, Volume, and Key Destination Markets) | ||
| Wholesale Price Trend Analysis & Forecast | ||
| Regulatory Framework | ||
| List of Key Players | ||
| Logistic and Infrastructure | ||
| Seasonality Analysis | ||
| By Geography | North America | United States | Production Analysis (Area Harvested, Yield, Production Volume) |
| Consumption Analysis (Value and Volume) | |||
| Import Market Analysis (Value, Volume, Key Supplying Markets) | |||
| Export Market Analysis (Value, Volume, Key Destination Markets) | |||
| Wholesale Price Trend Analysis and Forecast | |||
| Regulatory Framework | |||
| List of Key Players | |||
| Logistics and Infrastructure | |||
| Seasonality Analysis | |||
| Canada | Production Analysis (Area Harvested, Yield, Production Volume) | ||
| Consumption Analysis (Value and Volume) | |||
| Import Market Analysis (Value, Volume, Key Supplying Markets) | |||
| Export Market Analysis (Value, Volume, Key Destination Markets) | |||
| Wholesale Price Trend Analysis and Forecast | |||
| Regulatory Framework | |||
| List of Key Players | |||
| Logistics and Infrastructure | |||
| Seasonality Analysis | |||
| Mexico | Production Analysis (Area Harvested, Yield, Production Volume) | ||
| Consumption Analysis (Value and Volume) | |||
| Import Market Analysis (Value, Volume, Key Supplying Markets) | |||
| Export Market Analysis (Value, Volume, Key Destination Markets) | |||
| Wholesale Price Trend Analysis and Forecast | |||
| Regulatory Framework | |||
| List of Key Players | |||
| Logistics and Infrastructure | |||
| Seasonality Analysis | |||
| Europe | Russia | Production Analysis (Area Harvested, Yield, and Production Volume) | |
| Consumption Analysis (Consumption Value and Volume) | |||
| Import Market Analysis (Import Value, Volume, and Key Supplying Markets) | |||
| Export Market Analysis (Export Value, Volume, and Key Destination Markets) | |||
| Wholesale Price Trend Analysis & Forecast | |||
| Regulatory Framework | |||
| List of Key Players | |||
| Logistics and Infrastructure | |||
| Seasonality Analysis | |||
| Italy | Production Analysis (Area Harvested, Yield, and Production Volume) | ||
| Consumption Analysis (Consumption Value and Volume) | |||
| Import Market Analysis (Import Value, Volume, and Key Supplying Markets) | |||
| Export Market Analysis (Export Value, Volume, and Key Destination Markets) | |||
| Wholesale Price Trend Analysis & Forecast | |||
| Regulatory Framework | |||
| List of Key Players | |||
| Logistic and Infrastructure | |||
| Seasonality Analysis | |||
| France | Production Analysis (Area Harvested, Yield, and Production Volume) | ||
| Consumption Analysis (Consumption Value and Volume) | |||
| Import Market Analysis (Import Value, Volume, and Key Supplying Markets) | |||
| Export Market Analysis (Export Value, Volume, and Key Destination Markets) | |||
| Wholesale Price Trend Analysis & Forecast | |||
| Regulatory Framework | |||
| List of Key Players | |||
| Logistic and Infrastructure | |||
| Seasonality Analysis | |||
| Germany | Production Analysis (Area Harvested, Yield, and Production Volume) | ||
| Consumption Analysis (Consumption Value and Volume) | |||
| Import Market Analysis (Import Value, Volume, and Key Supplying Markets) | |||
| Export Market Analysis (Export Value, Volume, and Key Destination Markets) | |||
| Wholesale Price Trend Analysis & Forecast | |||
| Regulatory Framework | |||
| List of Key Players | |||
| Logistic and Infrastructure | |||
| Seasonality Analysis | |||
| United Kingdom | Production Analysis (Area Harvested, Yield, and Production Volume) | ||
| Consumption Analysis (Consumption Value and Volume) | |||
| Import Market Analysis (Import Value, Volume, and Key Supplying Markets) | |||
| Export Market Analysis (Export Value, Volume, and Key Destination Markets) | |||
| Wholesale Price Trend Analysis & Forecast | |||
| Regulatory Framework | |||
| List of Key Players | |||
| Logistic and Infrastructure | |||
| Seasonality Analysis | |||
| Netherlands | Production Analysis (Area Harvested, Yield, and Production Volume) | ||
| Consumption Analysis (Consumption Value and Volume) | |||
| Import Market Analysis (Import Value, Volume, and Key Supplying Markets) | |||
| Export Market Analysis (Export Value, Volume, and Key Destination Markets) | |||
| Wholesale Price Trend Analysis & Forecast | |||
| Regulatory Framework | |||
| List of Key Players | |||
| Logistic and Infrastructure | |||
| Seasonality Analysis | |||
| Asia-Pacific | India | Production Analysis (Area Harvested, Yield, and Production Volume) | |
| Consumption Analysis (Consumption Value and Volume) | |||
| Import Market Analysis (Import Value, Volume, and Key Supplying Markets) | |||
| Export Market Analysis (Export Value, Volume, and Key Destination Markets) | |||
| Wholesale Price Trend Analysis & Forecast | |||
| Regulatory Framework | |||
| List of Key Players | |||
| Logistic and Infrastructure | |||
| Seasonality Analysis | |||
| China | Production Analysis (Area Harvested, Yield, and Production Volume) | ||
| Consumption Analysis (Consumption Value and Volume) | |||
| Import Market Analysis (Import Value, Volume, and Key Supplying Markets) | |||
| Export Market Analysis (Export Value, Volume, and Key Destination Markets) | |||
| Wholesale Price Trend Analysis & Forecast | |||
| Regulatory Framework | |||
| List of Key Players | |||
| Logistic and Infrastructure | |||
| Seasonality Analysis | |||
| Australia | Production Analysis (Area Harvested, Yield, and Production Volume) | ||
| Consumption Analysis (Consumption Value and Volume) | |||
| Import Market Analysis (Import Value, Volume, and Key Supplying Markets) | |||
| Export Market Analysis (Export Value, Volume, and Key Destination Markets) | |||
| Wholesale Price Trend Analysis & Forecast | |||
| Regulatory Framework | |||
| List of Key Players | |||
| Logistic and Infrastructure | |||
| Seasonality Analysis | |||
| Thailand | Production Analysis (Area Harvested, Yield, and Production Volume) | ||
| Consumption Analysis (Consumption Value and Volume) | |||
| Import Market Analysis (Import Value, Volume, and Key Supplying Markets) | |||
| Export Market Analysis (Export Value, Volume, and Key Destination Markets) | |||
| Wholesale Price Trend Analysis & Forecast | |||
| Regulatory Framework | |||
| List of Key Players | |||
| Logistic and Infrastructure | |||
| Seasonality Analysis | |||
| Vietnam | Production Analysis (Area Harvested, Yield, and Production Volume) | ||
| Consumption Analysis (Consumption Value and Volume) | |||
| Import Market Analysis (Import Value, Volume, and Key Supplying Markets) | |||
| Export Market Analysis (Export Value, Volume, and Key Destination Markets) | |||
| Wholesale Price Trend Analysis & Forecast | |||
| Regulatory Framework | |||
| List of Key Players | |||
| Logistic and Infrastructure | |||
| Seasonality Analysis | |||
| South America | Brazil | Production Analysis (Area Harvested, Yield, and Production Volume) | |
| Consumption Analysis (Consumption Value and Volume) | |||
| Import Market Analysis (Import Value, Volume, and Key Supplying Markets) | |||
| Export Market Analysis (Export Value, Volume, and Key Destination Markets) | |||
| Wholesale Price Trend Analysis & Forecast | |||
| Regulatory Framework | |||
| List of Key Players | |||
| Logistic and Infrastructure | |||
| Seasonality Analysis | |||
| Argentina | Production Analysis (Area Harvested, Yield, and Production Volume) | ||
| Consumption Analysis (Consumption Value and Volume) | |||
| Import Market Analysis (Import Value, Volume, and Key Supplying Markets) | |||
| Export Market Analysis (Export Value, Volume, and Key Destination Markets) | |||
| Wholesale Price Trend Analysis & Forecast | |||
| Regulatory Framework | |||
| List of Key Players | |||
| Logistic and Infrastructure | |||
| Seasonality Analysis | |||
| Middle East | United Arab Emirates | Production Analysis (Area Harvested, Yield, and Production Volume) | |
| Consumption Analysis (Consumption Value and Volume) | |||
| Import Market Analysis (Import Value, Volume, and Key Supplying Markets) | |||
| Export Market Analysis (Export Value, Volume, and Key Destination Markets) | |||
| Wholesale Price Trend Analysis & Forecast | |||
| Regulatory Framework | |||
| List of Key Players | |||
| Logistic and Infrastructure | |||
| Seasonality Analysis | |||
| Saudi Arabia | Production Analysis (Area Harvested, Yield, and Production Volume) | ||
| Consumption Analysis (Consumption Value and Volume) | |||
| Import Market Analysis (Import Value, Volume, and Key Supplying Markets) | |||
| Export Market Analysis (Export Value, Volume, and Key Destination Markets) | |||
| Wholesale Price Trend Analysis & Forecast | |||
| Regulatory Framework | |||
| List of Key Players | |||
| Logistic and Infrastructure | |||
| Seasonality Analysis | |||
| Turkey | Production Analysis (Area Harvested, Yield, and Production Volume) | ||
| Consumption Analysis (Consumption Value and Volume) | |||
| Import Market Analysis (Import Value, Volume, and Key Supplying Markets) | |||
| Export Market Analysis (Export Value, Volume, and Key Destination Markets) | |||
| Wholesale Price Trend Analysis & Forecast | |||
| Regulatory Framework | |||
| List of Key Players | |||
| Logistic and Infrastructure | |||
| Seasonality Analysis | |||
| Africa | Egypt | Production Analysis (Area Harvested, Yield, and Production Volume) | |
| Consumption Analysis (Consumption Value and Volume) | |||
| Import Market Analysis (Import Value, Volume, and Key Supplying Markets) | |||
| Export Market Analysis (Export Value, Volume, and Key Destination Markets) | |||
| Wholesale Price Trend Analysis & Forecast | |||
| Regulatory Framework | |||
| List of Key Players | |||
| Logistic and Infrastructure | |||
| Seasonality Analysis | |||
| South Africa | Production Analysis (Area Harvested, Yield, and Production Volume) | ||
| Consumption Analysis (Consumption Value and Volume) | |||
| Import Market Analysis (Import Value, Volume, and Key Supplying Markets) | |||
| Export Market Analysis (Export Value, Volume, and Key Destination Markets) | |||
| Wholesale Price Trend Analysis & Forecast | |||
| Regulatory Framework | |||
| List of Key Players | |||
| Logistic and Infrastructure | |||
| Seasonality Analysis | |||


Key Questions Answered in the Report
What is the projected value of the legumes market by 2031?
The legumes market size is forecast to reach USD 17.3 billion by 2031, growing at a 4.60% CAGR from 2026 to 2031.
Why are carbon-credit schemes important for pulse farmers?
Payments linked to nitrogen fixation lower growers’ financing costs and incentivize larger pulse acreage, supporting long-term supply growth.
How do blockchain platforms benefit pulse exporters?
End-to-end traceability helps verified shipments earn 8–12% premiums in sustainability-focused markets.
What is driving pulse protein demand in aquaculture?
Feed formulators replace costly fishmeal with pea and lupin concentrates to meet cost targets and sustainability metrics.
Page last updated on:


