
North America Peas Market Analysis by Mordor Intelligence
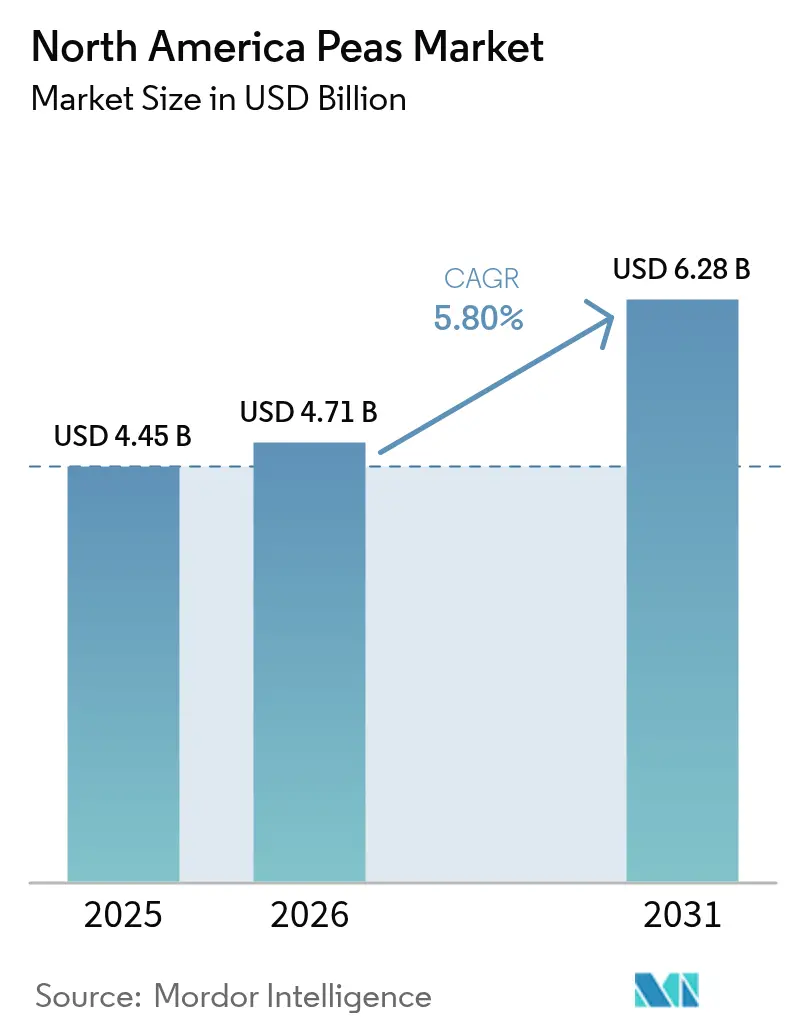
The North America peas market size is projected to expand from USD 4.45 billion in 2025 and USD 4.71 billion in 2026 to USD 6.28 billion by 2031, registering a CAGR of 5.80% between 2026 and 2031. Rapid adoption of pea protein isolates in dairy-alternative beverages and meat analogs, a pivot toward regenerative agriculture, and rising industrial demand for pea starch have lifted processor margins and encouraged acreage expansion across the northern Great Plains and Prairie provinces. Growth is also supported by the United States Department of Agriculture (USDA) Climate-Smart Commodities incentives that link verified soil-health outcomes to carbon-credit payments, thereby lowering production risk for growers. Regional processors are investing in dry-fractionation technology to improve protein yields, while tariffs applied in 2025 reshaped trade flows and nudged buyers to diversify their supply. Industrial buyers of biodegradable plastics are adding another layer of demand, tightening available supply during peak food-grade procurement windows.
Key Report Takeaways
- By geography, the United States held 62.1% of the North America peas market share in 2025, while Mexico is forecast to register a 7.4% CAGR through 2031.
Note: Market size and forecast figures in this report are generated using Mordor Intelligence’s proprietary estimation framework, updated with the latest available data and insights as of 2026.
North America Peas Market Trends and Insights
Drivers Impact Analysis*
| Driver | (~) % Impact on CAGR Forecast | Geographic Relevance | Impact Timeline |
|---|---|---|---|
| Rising demand for pea-based protein ingredients | +1.2% | United States and Canada, and with spillover to Mexico | Medium term (2-4 years) |
| Growing preference for flexitarian and plant-forward diets | +0.9% | United States and Canada urban centers, and emerging in Mexico | Medium term (2-4 years) |
| Expansion of pea use in gluten-free bakery and snacks | +0.7% | North America, strongest in United States | Short term (≤ 2 years) |
| Food-grade pea varieties supported by regenerative-agriculture incentives | +0.6% | United States Great Plains, and Canadian Prairies | Long term (≥ 4 years) |
| Demand from methyl-ester bio-based plastics value chain | +0.4% | United States and Canada industrial corridors | Long term (≥ 4 years) |
| Food security stockpiling by North American pet-food makers | +0.8% | United States, Canada, and Mexico | Short term (≤ 2 years) |
| Source: Mordor Intelligence | |||
Rising Demand for Pea-Based Protein Ingredients
Food manufacturers are adopting pea protein isolates and concentrates to diversify away from soy allergens and genetically modified organisms. Improved dry-fractionation and wet-milling now deliver protein content above 80%, while co-producing starch and fiber for industrial buyers[1]Source: Puris, “Regenerative Agriculture and Pea Protein Sourcing,” PURISPEA.COM. In 2025, Puris expanded its regenerative-sourcing network to 100,000 acres across North Dakota and Montana, ensuring traceable feedstock for its protein plants. Dairy-alternative and meat-analog brands specify pea isolates for their neutral flavor and superior emulsification, outperforming rice and hemp proteins in clean-label recipes. United States retail sales of products fortified with pea protein grew at double-digit rates during 2025, underscoring this structural shift.
Growing Preference for Flexitarian and Plant-Forward Diets
Flexitarian eating has grown rapidly, and an estimated 30% of United States adults self-identified as flexitarian in 2025, up from 25% two years earlier. Quick-service chains and meal-kit companies now routinely feature pea-protein menu items, guaranteeing steady ingredient offtake. Canada’s Protein Industries Canada supercluster has approved more than CAD 200 million (USD 145 million) in grants since 2024 to scale domestic processing. Mexico’s urban middle class is beginning to mirror this dietary pivot, with pea-protein imports filling demand gaps at local processors.
Expansion of Pea Use in Gluten-Free Bakery and Snacks
Pea flour and starch enhance texture, protein content, and shelf life in gluten-free baked goods and extruded snacks. United States bakeries increased pea-flour procurement by 15% in 2025 as they reformulated their bread and muffin lines. Food and Drug Administration (FDA) enforcement of gluten-free labeling under 21 CFR 101.91 demands verified ingredient traceability, elevating premiums for identity-preserved pea lots. This regulatory clarity is positioning certified gluten-free pea inputs as a high-margin niche within the broader North America peas market.
Food-Grade Pea Varieties Supported by Regenerative-Agriculture Incentives
The USDA Climate-Smart Commodities program allocates USD 3.1 billion in 2023 to projects that reward cover cropping, reduced tillage, and nitrogen-fixing rotations[2]Source: USDA, “USDA Announces Availability of USD 2.8 Billion in Funding for First Round of Projects Under Partnerships for Climate-Smart Commodities,” USDA.GOV. Peas naturally align, fixing atmospheric nitrogen and increasing soil organic matter, which strengthens growers’ eligibility for carbon-credit revenue. Pilot schemes in Montana and Saskatchewan now link credit issuance to verified pea acreage, encouraging long-term expansion of high-protein yellow varieties and stabilizing farm-gate supply for processors.
Restraints Impact Analysis*
| Restraint | (~) % Impact on CAGR Forecast | Geographic Relevance | Impact Timeline |
|---|---|---|---|
| Climatic yield variability in northern plains | -0.8% | United States northern Great Plains, and Canadian Prairies | Short term (≤ 2 years) |
| Tariff-driven price volatility in USMCA pulse trade | -0.6% | United States, Canada, and Mexico | Short term (≤ 2 years) |
| Increasing root-rot and Ascochyta blight incidence | -0.5% | United States and Canada pea-growing regions | Medium term (2-4 years) |
| Stricter phytosanitary residue limits on dry pulses | -0.3% | United States, Canada, and Mexico border crossings | Medium term (2-4 years) |
| Source: Mordor Intelligence | |||
Climatic Yield Variability in Northern Plains
Pea fields in Montana, North Dakota, Saskatchewan, and Alberta face wide yield swings tied to spring moisture and summer heat stress. During 2024, drought reduced Montana yields to 1,200 pounds per acre, well below the five-year average of 1,500 pounds[3]Source: North Dakota State University, “Ascochyta Blight of Field Pea,” NDSU.EDU. Excess rainfall in Saskatchewan delayed planting and elevated disease risk, complicating processor contracting and insurance coverage. Climate modeling points to more extreme weather events before 2030, embedding production volatility into the North America peas market outlook.
Tariff-Driven Price Volatility in USMCA Pulse Trade
Reciprocal tariff measures imposed in early 2025 disrupted historical pulse trade patterns within North America, with the United States applying 25% duties on Canadian dry pea imports and China levying 100% tariffs on Canadian pulses in March 2025, as per Statistics Canada. These actions compressed Canadian farm-gate prices and forced growers to seek alternative export markets in India, Bangladesh, and the Philippines. United States processors benefited from lower import costs but faced uncertainty about the duration of tariffs and potential retaliation, complicating long-term sourcing strategies. Mexico's pea imports from the United States and Canada became subject to intensified customs inspections under USMCA (United States-Mexico-Canada Agreement) rules-of-origin verification, adding logistical delays and compliance expenses that elevated landed costs for Mexican buyers.
*Our forecasts treat driver/restraint impacts as directional, not additive. The impact forecasts reflect baseline growth, mix effects, and variable interactions.
Geography Analysis
The United States accounted for 62.1% of the North America peas market share in 2025, driven by strong infrastructure and consistent production levels. Dry pea production experienced steady growth, with states such as North Dakota and Montana increasing acreage and improving yields. Imports from Canada addressed processing gaps in the United States. However, reciprocal tariffs introduced in 2025 raised landed costs, prompting an increase in domestic acreage. USDA Climate-Smart initiatives linked carbon credits to verified pea rotations, mitigating weather-related risks and enhancing grower income. Additionally, stricter gluten-free regulations improved traceability, boosting demand for identity-preserved lots.
Mexico is projcted to grow at a 7.4% CAGR from 2026 to 2031, positioning it as the fastest-growing sub-market in North America. Imports account for over 80% of consumption, as processors meet demand for plant-based foods and pet nutrition. COFEPRIS (Comisión Federal para la Protección contra Riesgos Sanitarios) has enhanced residue testing protocols, which, while delaying border clearance, have improved quality assurance. Rising disposable incomes and the adoption of urban flexitarian diets in cities such as Mexico City, Guadalajara, and Monterrey are driving sustained demand growth through 2031. Urbanization and growing health awareness are further boosting demand for plant-based proteins, including pea-based products.
Canada remains a leading global producer of pulses, with Saskatchewan accounting for the majority of pulse cultivation and serving as a hub for research, grain handling, and ingredient processing. In 2024, the country's pea harvest saw a significant increase, driven by favorable growing conditions and efficient logistics. Canadian peas are associated with lower greenhouse gas emissions compared to international alternatives, making them attractive to sustainability-conscious markets. Non-GMO and organic certifications allow suppliers to command premiums in specialty markets. However, tariff uncertainties in key markets such as China are prompting Canadian exporters to explore alternative trade routes, particularly in Southeast Asia and South America.
Regulatory Landscape
In the United States, whole dry peas and processed pea products move under established USDA Agricultural Marketing Service (AMS) grade standards (covering fresh, frozen, canned, and whole dry peas), which set common quality language for contracting across food, ingredient, and export channels. Food use is further shaped by FDA oversight under FSMA preventive controls requirements for facilities handling and processing dry pulses, while USDA APHIS governs permitting and movement requirements for regulated genetically engineered organisms under 7 CFR part 340.
In Canada, pea grading and export requirements are governed under the Canada Grain Act and Canada Grain Regulations, administered by the Canadian Grain Commission (CGC). Export-grade determination is supported by CGC grading guides and primary export grade tables for peas. For new varieties, the Canadian Food Inspection Agency (CFIA) sets the environmental safety assessment criteria for Plants with Novel Traits (PNTs) via Directive 94-08 and Directive 2009-09, which influences variety approvals and the trait pipeline feeding Prairie and cross-border supply programs.
Value Chain Analysis
The North America peas value chain starts with seed and agronomy (variety selection, inoculants, crop protection, and on-farm storage), followed by primary handling through elevators, cleaning, and grading to meet buyer specifications on splits, moisture, and foreign material. Western Canada remains a core origin for exportable volumes and ingredient feedstock, supported by the Canadian Grain Commission grading framework and harvest quality monitoring, while the United States origin base expands in the northern Great Plains and select irrigated states as processors pursue shorter-haul, identity-preserved sourcing.
Midstream value addition increasingly centers on fractionation and specialty processing that converts yellow peas into protein isolates and concentrates, alongside starch and fiber streams for food, pet food, and industrial customers. Trade associations (Pulse Canada, the Canadian Pulse and Special Crops Trade Association, and USA Pulses) coordinate market access and standards alignment, but logistics remain a swing factor, as containerized exports are sensitive to terminal throughput and disruption risk at major gateways such as Vancouver and Montreal. Downstream, distribution splits between bulk export channels, North American food manufacturing, and ingredient users in plant-based foods and industrial applications, with phytosanitary checks and residue testing influencing border clearance times and working-capital needs.
Competitive Landscape
The North America peas market includes companies such as AGT Food and Ingredients, Roquette, and Ingredion, which operate integrated fractionation facilities and maintain contracts with growers across the Great Plains and Prairies. These companies play a significant role in ensuring a steady supply of peas for various applications. Additionally, Puris and Burcon NutraScience collaborate with contract growers to enhance dry-fractionation capacity, aiming to increase protein yield while minimizing water usage. This approach not only improves efficiency but also supports sustainable practices. Regional cooperatives compete by offering organic and identity-preserved sourcing options to meet the growing demand for traceable, high-quality products.
Supply concentration in Saskatchewan and Alberta, which produce more than 80% of Canada's peas, heightens vulnerability to weather shocks. Processors diversify procurement into Montana, North Dakota, and emerging Midwest acreage to mitigate risk. Technology adoption revolves around precision agriculture tools for nitrogen management and disease scouting, alongside blockchain traceability pilots that document carbon footprint and phytosanitary compliance.
White-space growth lies in bio-based plastics and industrial starch. Roquette’s CAD 45 million (USD 32 million) Manitoba bio-refinery will extract pea starch for methyl-ester synthesis, catering to renewable plastics clients. Puris patented a dry-fractionation process that boosts protein yield 12 % and creates fiber suited for bio-composites. Sustainability certifications and carbon-credit linkage are emerging as competitive differentiators as consumer scrutiny of supply chains intensifies.
Market Opportunities and Future Outlook
Processing-led demand expansion creates whitespace for higher-value pea fractions beyond food, particularly where processors can monetize co-products (starch and fiber) alongside protein. Commissioning activity around Louis Dreyfus Company’s Yorkton, Saskatchewan pea protein isolate facility (producing pea protein, pea fiber, and pea starch) and Roquette’s large-scale Manitoba pea processing footprint indicates active capacity and product development efforts that widen the addressable end-market set for North American yellow peas.
Upstream, genetics and traceability programs support opportunities in higher-protein, functionality-targeted varieties that improve fractionation economics and contract reliability for identity-preserved supply. Protein Industries Canada’s genomic-selection platform works with GIFS Ag Tech Enterprise Inc. and DL Seeds, offering an industry-backed pathway to shorten breeding cycles for traits linked to yield, protein content, and processing performance. On the trade side, the 2025 tariff-driven reshaping of North American pulse flows and subsequent tariff actions affecting pea derivatives reinforce an opportunity for diversified export destinations and more domestic and regional offtake (food, pet food, and industrial), reducing reliance on any single external market.
Recent Industry Developments
- June 2026: Protein Industries Canada announced two Strengthening the Canadian Supply Chain projects, including work with Farm Girl and Body Energy Club to reformulate products using Canadian-sourced pea protein. The activity links ingredient pull-through to domestic processing and creates more structured demand signals for pea protein suppliers and contract growers.
- March 2026: Louis Dreyfus Company initiated commissioning of its pea protein isolate production facility in Yorkton, Saskatchewan, designed to produce pea protein alongside pea fiber and proprietary pea starch. Bringing an additional integrated processor online in the Prairies increases regional procurement options for yellow peas and expands the availability of locally produced pea ingredients for North American food and nutrition manufacturers.
- July 2024: AGT Foods inaugurated a new extrusion facility in North Dakota to support value-added pulse and pea processing. The expansion strengthens in-region capability to convert raw peas into higher-margin ingredients, supporting shorter supply chains for North American plant-based food applications.


Research Methodology Framework and Report Scope
Market Definition and Coverage
For this study, the North America peas market is defined as the value linked to peas traded and consumed across the region, using a consistent view of volumes, trade flows, and price signals across key pea forms.
Scope exclusions: We exclude downstream processed ingredient markets that are priced and sold mainly as pea protein isolates, starches, or fibers rather than as peas.
Segmentation Overview
- By Geography
- North America
- United States
- Production Analysis (Area Harvested, Yield, and Production Volume)
- Consumption Analysis (Consumption Value and Volume)
- Import Market Analysis (Import Value, Volume, and Key Supplying Markets)
- Export Market Analysis (Export Value, Volume, and Key Destination Markets)
- Wholesale Price Trend Analysis and Forecast
- Regulatory Framework
- List of Key Players
- Logistics and Infrastructure
- Seasonality Analysis
- Canada
- Production Analysis (Area Harvested, Yield, and Production Volume)
- Consumption Analysis (Consumption Value and Volume)
- Import Market Analysis (Import Value, Volume, and Key Supplying Markets)
- Export Market Analysis (Export Value, Volume, and Key Destination Markets)
- Wholesale Price Trend Analysis and Forecast
- Regulatory Framework
- List of Key Players
- Logistics and Infrastructure
- Seasonality Analysis
- Mexico
- Production Analysis (Area Harvested, Yield, and Production Volume)
- Consumption Analysis (Consumption Value and Volume)
- Import Market Analysis (Import Value, Volume, and Key Supplying Markets)
- Export Market Analysis (Export Value, Volume, and Key Destination Markets)
- Wholesale Price Trend Analysis and Forecast
- Regulatory Framework
- List of Key Players
- Logistics and Infrastructure
- Seasonality Analysis
- United States
- North America
Data Sources, Market Sizing, and Validation
Desk Research
Desk research set the factual base for the model, especially on how pea supply and demand moves through production, imports, exports, and wholesale pricing in North America. We used public agricultural statistics and trade series to lock the direction and magnitude of volumes before layering value assumptions on top.
Sources that were especially useful included official crop, area, and yield releases from agencies such as USDA and Statistics Canada, trade and tariff line data from sources such as UN Comtrade and national customs statistics, and price series published by official market reporting bodies where available. We also reviewed peer-reviewed agronomy and food science journals for context on planting trends and usage, along with company filings, investor presentations, association websites, and reputed business press for demand cues. For targeted cross-checks, we used paid subscriptions that support company financials and intelligence, news and financials, patent databases, and shipment-level import-export records. The sources mentioned above are illustrative, and many other references were also used for data collection, validation, and clarification during the work.
Primary Interviews and Surveys
Primary work focused on validating what the desk data cannot fully explain, specifically pricing logic, channel mix, and how supply shifts translate into realized value. We spoke with growers, traders, processors, and large buyers, and we also checked assumptions with logistics and distribution stakeholders so the final model reflects contracting practices and seasonality patterns across the region.
Distribution of primary research fieldwork respondents
| Company type | Respondent position |
|---|---|
| Top tier: 34% | CXOs: 13% |
| Mid tier: 52% | Functional/Unit leaders: 31% |
| Smaller Players: 14% | Managers: 56% |
Market-Sizing & Forecasting
Sizing starts with top-down and bottom-up logic, where production and net trade series are used to reconstruct an available supply pool for North America and then converted into value using wholesale price timing. When a year looked unusually volatile, we relied first on the most consistent official volume series and then tightened the price window used in the value conversion.
To keep the totals realistic, results were corroborated with selective bottom-up approximations, such as sampled price-times-volume checks by pea form, distributor channel checks, and sanity tests against supplier and buyer revenue exposures where disclosures were available. Key model inputs included planted area and yields, import and export volumes by tariff line, wholesale price movements through the season, inventory and carryover signals where reported, and food versus feed pull indicated by buyer conversations. For forecasting, we used scenario analysis tied to acreage intentions, yield normalization, and price outlook, and the forward path was aligned to primary feedback on planting economics and end-use demand. Where smaller cross-border flows were not fully visible in one data cut, gaps were handled through trade balancing and price banding so year-to-year movements stayed consistent.
Data Validation & Update Cycle
Validation is done through multiple checks so the model stays aligned to observable market behavior. We compare outputs against independent signals like trade balances, year-to-year price shifts, and known supply events, and then investigate any variance that looks out of pattern before the figures are signed off.
Before sign off, the work goes through stepwise internal reviews, and any weak assumption triggers a re-contact with a relevant respondent group for quick confirmation. Reports are refreshed annually, with interim updates when material events occur, such as sharp acreage swings, policy changes that alter trade flows, or major price shocks. Right before delivery, an analyst performs a fresh pass so clients receive the latest updated view.
Mordor Intelligence's North America Peas Market Size Measured Against Other Published Estimates
Published market sizes for peas in North America can look far apart, even when the topic sounds identical, because the included pea forms and the pricing point in the chain are not always treated the same way. Year selection also matters, since peas are exposed to harvest variability and trade-driven price swings that can move value quickly.
Production totals, import and export volumes, and wholesale price trend checks are the evidence that keeps Mordor Intelligence tied to a peas-only value pool across the United States, Canada, and Mexico, which reduces drift from retail markups and pea derivative revenues. Another common gap driver is whether a source limits coverage to dry peas consumption only, or counts a broader basket that includes additional pea forms and related trade value. Differences also appear when currency conversion timing and inflation assumptions are applied unevenly, or when older estimates are not refreshed after major supply changes.
Benchmark comparison
| Source | Market Size | Gaps in Research Methodology |
|---|---|---|
| Mordor Intelligence | USD 4.45 B (2025) | |
| Regional Consultancy A | USD 1.50 B (2024) | Anchors the model to a different base year and a narrower product and channel reading, which can undercount bulk trade-linked value and can miss years with higher export-led pricing. |
| Trade Journal B | USD 0.47 B (2024) | Restricts coverage to dry peas consumption value and excludes margin layers, so it will not match a broader peas market view that also reflects other forms and trade-linked value. |
Taken together, the spread is mostly explained by product coverage and where pricing is captured in the chain, followed by the year used for normalization. By keeping steps traceable to volumes and prices and then confirming assumptions through buyer and seller feedback, the final market size stays easier to reproduce and interpret for planning.


Key Questions Answered in the Report
How large will pea sales become in North America by 2031?
The North America peas market is forecast to reach USD 6.28 billion by 2031, expanding at a 5.80% CAGR from 2026.
Which country dominates regional pea volume?
The United States held 62.1% of the market share in 2025, supported by 0.93 million metric tons harvested in Montana and North Dakota.
Why are processors favoring pea protein over soy?
Pea protein is non-allergenic, non-GMO, and qualifies for clean-label claims, meeting rising flexitarian and dairy-alternative demand.
How are tariffs affecting cross-border pea trade?
Reciprocal duties imposed in 2025 raised landed costs and redirected Canadian exports from China to South Asia, while U.S. buyers boosted domestic contracts.
What role does regenerative agriculture play in pea supply?
USDA Climate-Smart funding links carbon credits to verified pea acreage, providing growers extra revenue and encouraging sustainable rotations.
Page last updated on:


 Your data is secure and never sold or shared.


