IT Operations Management Market Size and Share
Market Overview
| Study Period | 2020 - 2031 |
|---|---|
| Market Size (2026) | USD 40.67 Billion |
| Market Size (2031) | USD 71.82 Billion |
| Growth Rate (2026 - 2031) | 12.05% CAGR |
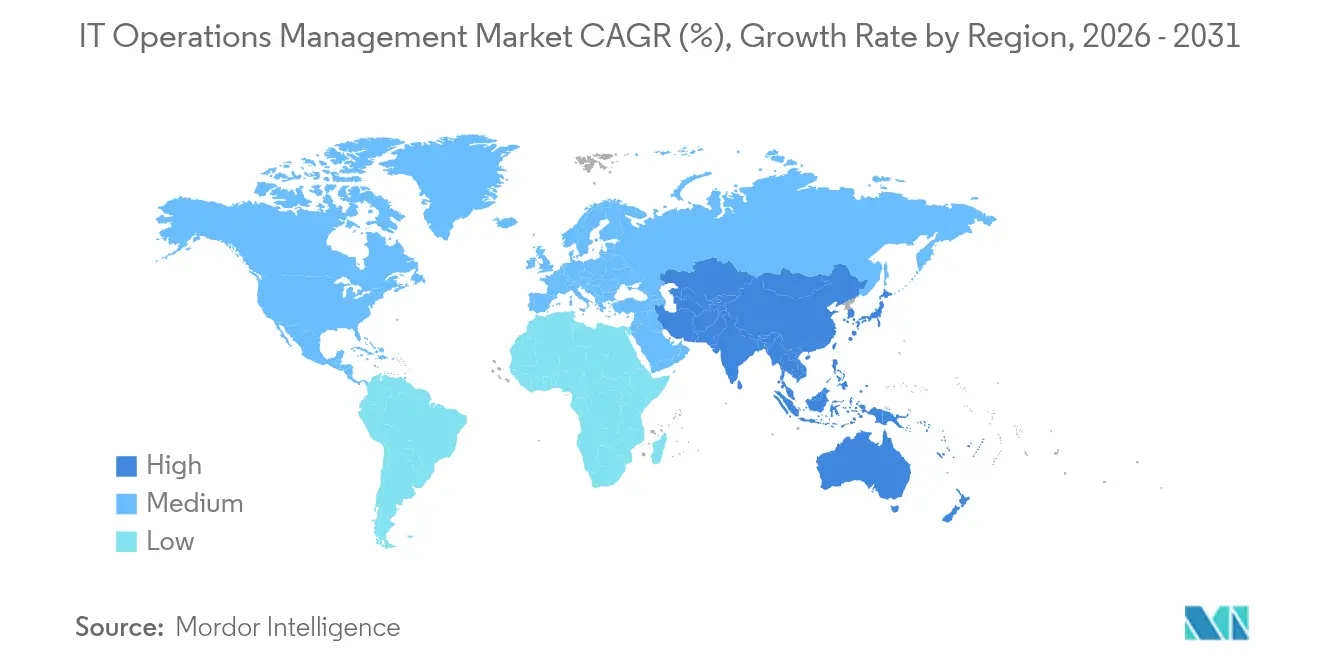
| Fastest Growing Market | Asia Pacific |
| Largest Market | North America |
| Market Concentration | Low |
Major Players *Disclaimer: Major Players sorted in no particular order Image © Mordor Intelligence. Reuse requires attribution under CC BY 4.0. | |
IT Operations Management Market Analysis by Mordor Intelligence
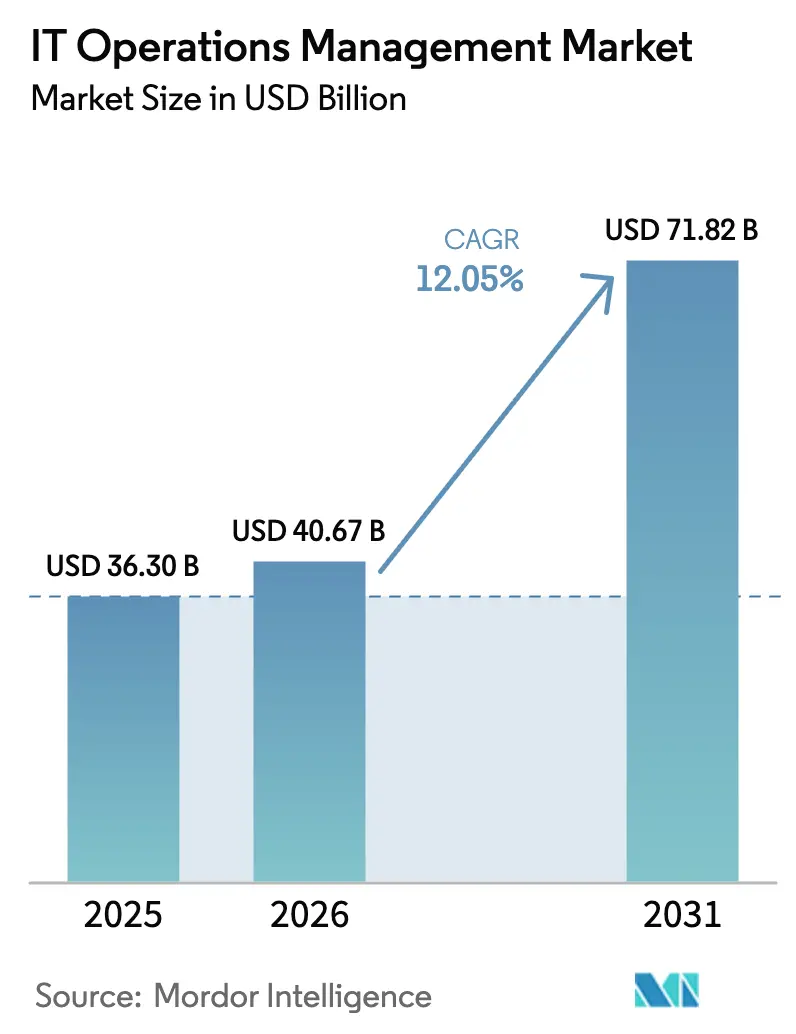
IT operations management market size in 2026 is estimated at USD 40.67 billion, growing from 2025 value of USD 36.3 billion with 2031 projections showing USD 71.82 billion, growing at 12.05% CAGR over 2026-2031. Enterprises are accelerating investment as cloud, edge, and 5G deployments multiply system complexity. Predictive analytics and intelligent automation now underpin day-to-day operations, enabling proactive incident prevention, faster root-cause identification, and autonomous remediation. Energy-aware monitoring is gaining prominence as companies align IT with carbon-neutrality goals. Meanwhile, open standards such as OpenTelemetry are easing data consolidation across disparate platforms, though spiraling telemetry volumes and shortages of AIOps talent temper near-term growth.
Key Report Takeaways
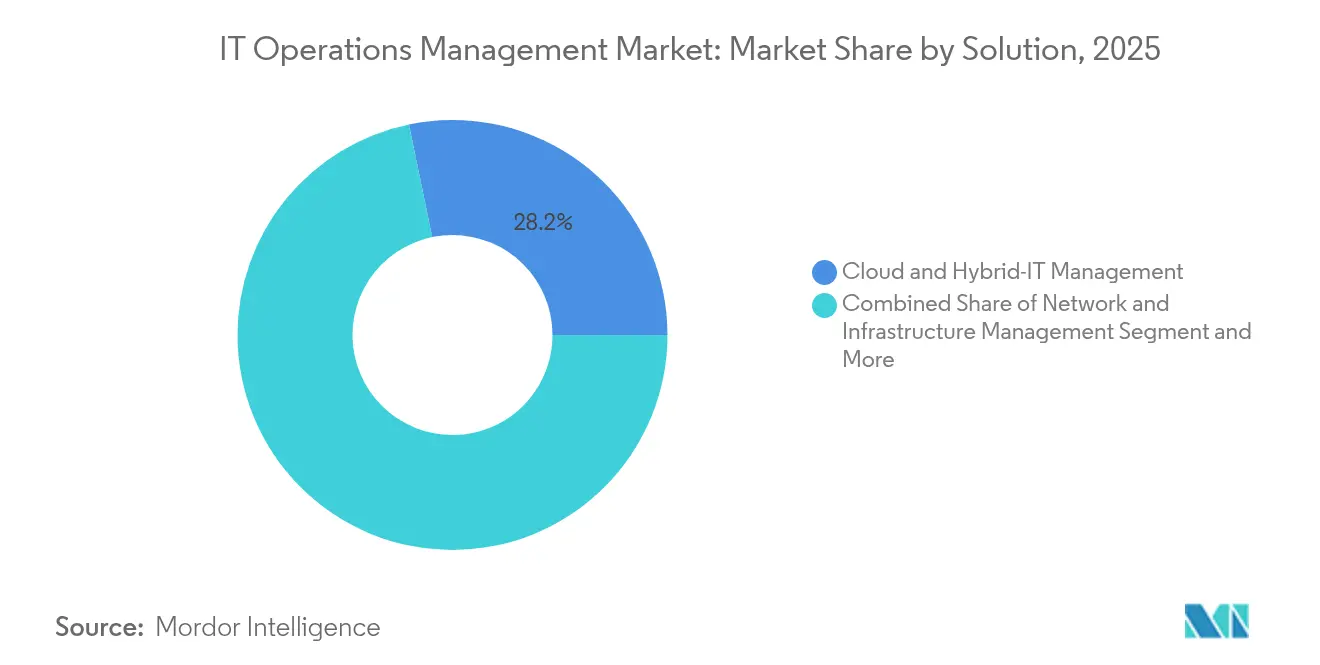
- By solution type, Cloud and Hybrid-IT Management led with 28.25% of IT operations management market share in 2025, while IT Operations Analytics posted the highest 18.65% CAGR outlook.
- By deployment model, cloud-based platforms accounted for 61.35% of the IT operations management market size in 2025 and are projected to grow at 18.45% CAGR to 2031.
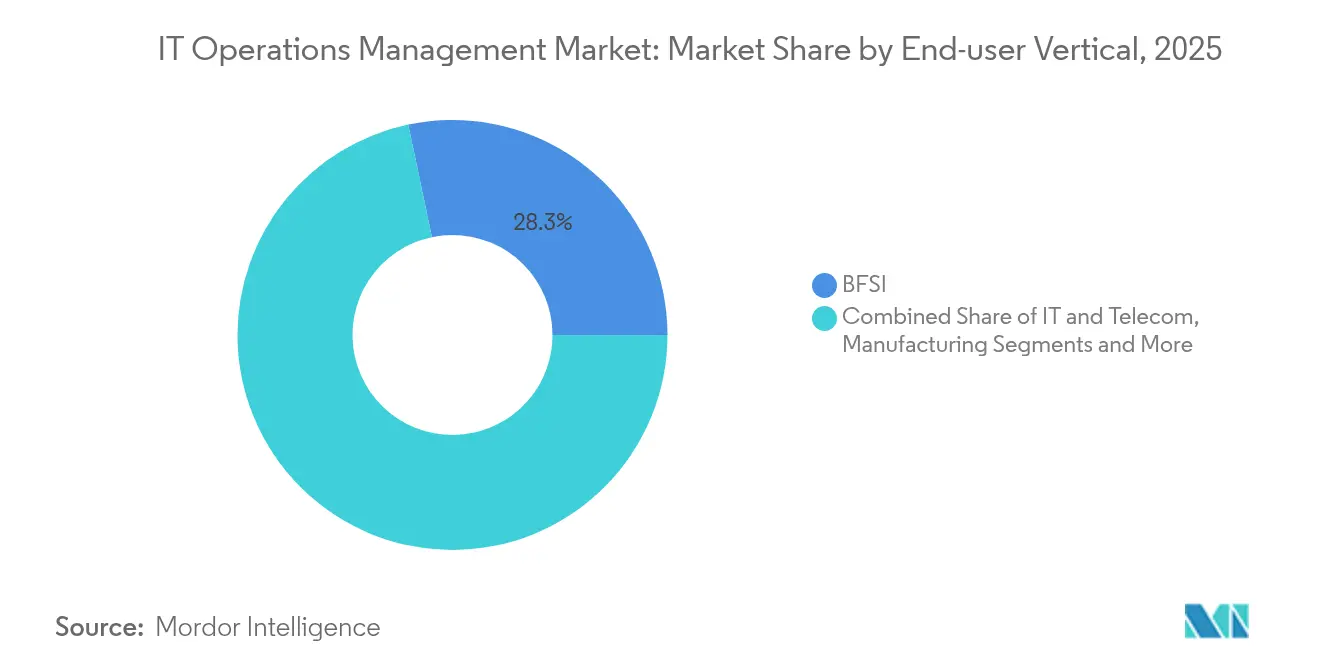
- By end-user vertical, BFSI contributed 28.30% revenue share in 2025; Healthcare and Life Sciences is advancing at a 15.35% CAGR through 2031.
- By organisation size, large enterprises held 71.20% of the IT operations management market share in 2025, whereas SMEs record the fastest 14.10% CAGR.
- By geography, North America captured 38.50% of 2025 revenue; APAC is forecast to remain the fastest-expanding region with a 13.95% CAGR.
Note: Market size and forecast figures in this report are generated using Mordor Intelligence’s proprietary estimation framework, updated with the latest available data and insights as of 2026.
Global IT Operations Management Market Trends and Insights
Drivers Impact Analysis*
| Driver | (~) % Impact on CAGR Forecast | Geographic Relevance | Impact Timeline |
|---|---|---|---|
| Cloud and Hybrid-IT sprawl elevates monitoring complexity | +2.8% | Global, North America and Europe lead | Medium term (2-4 years) |
| Shift from ITSM to AIOps for predictive incident response | +3.2% | North America and Europe core, APAC accelerating | Short term (≤ 2 years) |
| Edge and 5G roll-outs demanding real-time observability | +2.1% | APAC core, spill-over to North America and Europe | Medium term (2-4 years) |
| Sustainability mandates driving energy-aware tooling | +1.4% | Europe leading, North America following | Long term (≥ 4 years) |
| GPU-dense AI clusters need new performance baselines | +1.8% | Global, concentrated in major cloud regions | Short term (≤ 2 years) |
| Vendor-agnostic OpenTelemetry adoption | +1.2% | Global enterprise uptake | Medium term (2-4 years) |
| Source: Mordor Intelligence | |||
Cloud and Hybrid-IT Sprawl Elevates Monitoring Complexity
Hybrid architectures spanning 3–5 public-cloud providers plus on-premises estates now dominate enterprise roadmaps. Each additional environment multiplies telemetry streams, creating blind spots that lengthen mean-time-to-resolution by up to 60%. Unified observability platforms able to stitch together metrics, traces, and logs from microservices at scale therefore become core to operational resilience. AWS’s USD 5 billion investment in new infrastructure across Thailand illustrates the pace of cloud expansion that fuels demand for broader visibility.[1]Amazon Web Services, “AWS Launches Infrastructure Region in APAC, Plans US$5 Billion Thailand Investment,” erp.today
Shift from ITSM to AIOps for Predictive Incident Response
Ticket-based workflows are giving way to machine-learning models that surface anomalies before users notice. Enterprises deploying AIOps report 80% reductions in manual triage and 20%+ ROI gains from lower downtime.[2]John Anthos, “Now GA: New Relic AI (NRAI),” New Relic, newrelic.com Utilities and energy firms lead adoption as always-on infrastructure mandates zero-tolerance for outages. The paradigm shift is propelling the IT operations management market toward self-healing capabilities that reallocate human effort to strategic engineering tasks.
Edge and 5G Roll-outs Demanding Real-Time Observability
Edge nodes supporting latency-sensitive workloads require sub-5 ms visibility loops. Centralized tools struggle with the volume and speed, driving innovation in lightweight agents capable of local analytics and conditional alerting. Ericsson’s partnership with Supermicro spotlights hardware–software convergence designed specifically for distributed AI and ultra-low-latency monitoring.[3]Ericsson Newsroom Staff, “Ericsson and Supermicro Advance Enterprise Connectivity for Edge AI Systems,” Ericsson, ericsson.com
Sustainability Mandates Driving Energy-Aware Tooling
Data centers consume nearly 3% of global electricity, prompting regulators and boards to mandate granular power tracking. Modern platforms now display watts, PUE, and carbon intensity adjacent to performance charts, enabling teams to schedule non-critical jobs during renewable-generation peaks. Microsoft’s procurement of 23.6 million MWh in renewables underscores how sustainability metrics have become first-class operational KPIs.[4]Microsoft CSR Team, “Sustainability,” microsoft.com
Restraints Impact Analysis*
| Restraint | (~) % Impact on CAGR Forecast | Geographic Relevance | Impact Timeline |
|---|---|---|---|
| Upfront spending on data pipelines and licenses strains budgets | -2.1% | Global, hitting SMEs hardest | Short term (≤ 2 years) |
| Scarcity of seasoned SRE and DevSecOps professionals | -1.8% | Global, most acute in APAC and other emerging markets | Medium term (2-4 years) |
| Strict data-residency rules curb cross-border log sharing for AI models | -1.3% | EU, China and other sovereignty-focused jurisdictions | Long term (≥ 4 years) |
| Sovereign-cloud mandates force localized ITOA variants | -0.9% | EU, China, India and countries enforcing digital-sovereignty mandates | Long term (≥ 4 years) |
| Source: Mordor Intelligence | |||
Legacy Tool Silos Inhibit Single-Pane Visibility
Many enterprises still juggle 5–10 monitoring products. Custom connectors and duplicated alert workflows inflate operational overhead, delaying unified rollouts. In APAC, 61% of organizations manage at least five tools simultaneously, prompting consolidation programs that can span years and absorb scarce engineering cycles.
Rising Observability Data Costs Squeeze ROI Calculations
Telemetry volumes from containerized microservices grow faster than budgets. Wasabi’s 2025 survey found 50% of APAC firms delayed projects due to escalating storage and egress fees. Faced with runaway invoices, some teams downsample or shorten retention, risking blind spots that can negate the promise of full-stack observability.
*Our forecasts treat driver/restraint impacts as directional, not additive. The impact forecasts reflect baseline growth, mix effects, and variable interactions.
Segment Analysis
By Solution: Analytics Spurs Next-Generation Transformation
Cloud and Hybrid-IT Management held a 28.25% IT operations management market share in 2025 as enterprises sought consistent governance across multi-cloud estates. Demand is sustained by continuous migration waves and the inclusion of edge locations in the same visibility envelope. Meanwhile, IT Operations Analytics is projected to expand at a 18.65% CAGR, elevating the IT operations management market size for intelligent platforms that correlate events, forecasts saturation points, and trigger automated Workflows. Vendors embed large-language-model-driven insights to democratize troubleshooting for non-specialist staff, effectively flattening learning curves.
Complementary modules such as Application Performance Monitoring shift emphasis from code-level tracing to end-to-end user-journey mapping, while Configuration and Change Management exploits policy-as-code to reduce drift. Automation and Orchestration components grow in tandem, enabling auto-scaling and self-healing actions without human clicks. Collectively, these changes reshape procurement priorities as buyers bundle analytics with remedial automation under a single subscription.


By Deployment Model: Cloud-Native Dominance Accelerates
Cloud-hosted subscriptions represented 61.35% of 2025 revenue, translating to the largest component of IT operations management market size for consumption-based offerings. With 18.45% CAGR expected to 2031, elasticity, lower CapEx, and offloaded maintenance continue to attract adopters. Hybrid patterns persist where data residency and latency requirements dictate local processing, yet even these deployments often rely on cloud control planes for policy management.
On-premise roll-outs slow but do not vanish, especially inside regulated sectors. Edge-oriented deployment options emerge as containers running within factory floors or cell-tower shelters forward summaries when bandwidth allows. OpenTelemetry adherence ensures collected data remains portable no matter where collectors run, preserving procurement flexibility.
By End-User Vertical: Healthcare Leads Growth Curve
BFSI retained 28.30% revenue share in 2025 due to stringent uptime and audit mandates that compel banks to invest heavily in monitoring. However, Healthcare and Life Sciences is forecast at 15.35% CAGR, swelling the IT operations management market size for patient-safety-critical analytics that track equipment telemetry and electronic health-record latency. Real-time edge monitoring inside hospitals supports tele-ICU solutions and IoT medical devices handling sensitive data.
Manufacturing embraces Industry 4.0, wiring shop-floor PLCs into unified dashboards that correlate OT and IT metrics. Retail chains integrate in-store point-of-sale data with e-commerce site telemetry to secure omnichannel experiences, while public agencies modernize ageing infrastructures under digital-government mandates. Each vertical brings bespoke compliance obligations that vendors increasingly address through pre-packaged rule sets.
By Organisation Size: Automation Lowers Barriers for SMEs
Large enterprises commanded 71.20% of 2025 spending, leveraging scale to negotiate enterprise-wide licenses covering global footprints. Rigorous governance demands multi-tenant architectures, granular role-based access controls, and custom connectors, features readily met by incumbents. Nonetheless, usage-based pricing and SaaS delivery democratize access, propelling a 14.10% CAGR inside the SME cohort.
SMEs use cloud-native bundles to sidestep infrastructure upkeep, relying on guided setup wizards and AI-generated recommendations to offset skills gaps. Studies show automation raises SME productivity by 30% and trims manual error rates by 25%, reinforcing the ROI narrative. Managed-service partners further accelerate adoption by bundling monitoring with remediation, giving smaller firms enterprise-grade resilience without headcount expansion.
Geography Analysis
North America accounted for 38.50% revenue in 2025, anchored by deep cloud penetration, mature vendor ecosystems, and strong cybersecurity frameworks. Federal modernization grants and critical-infrastructure protection mandates amplify spending on observability platforms that integrate compliance evidence into continuous-monitoring dashboards. Sustainability pledges from firms such as Microsoft and Apple add further impetus as carbon-accounting features become board-level metrics.
APAC is projected to deliver a 13.95% CAGR through 2031, the fastest worldwide. Japan headlines regional investment, with 71% of firms boosting operations budgets to automate processes and adopt AI observability. Cloud build-outs by hyperscalers—epitomized by AWS spending in Thailand—lower entry costs for emerging businesses across ASEAN markets, widening the addressable base. Yet fragmentation persists: 61% of APAC companies still juggle five or more monitoring tools, and outage costs can exceed USD 19.07 million annually in high-growth economies.
Europe maintains a steady trajectory, driven by stringent data-protection and green-computing directives. The European Commission’s EUR 8 billion green-bond issuance underscores policy support for energy-efficient IT footprints. Hybrid deployment demand rises as enterprises balance GDPR compliance with the scalability of regional cloud hubs. Industrial automation projects across Germany, France, and the Nordics tie ITOM adoption to smart-factory rollouts, expanding addressable spend on platforms that fuse OT and IT telemetry.

Competitive Landscape
Market concentration is moderate. ServiceNow, Dynatrace, Datadog, and Splunk anchor the top tier by combining full-stack telemetry ingestion with AI-driven insights. Dynatrace recorded 19% fiscal-year revenue growth and now serves roughly 4,100 customers across 105 countries. Incumbents differentiate through anomaly-detection algorithms, topology discovery, and automated remediation features integrated into ITSM workflows.
Strategic alliances intensify. RapDev reached ServiceNow Elite status and captured Datadog Partner-of-the-Year honors for the fourth year, demonstrating the ecosystem’s importance in scaling enterprise rollouts. Edge-centric partnerships such as Ericsson–Supermicro combine hardware with observability layers built for low-latency sites, opening niches where generalist platforms face performance constraints. Private-equity activity remains vibrant; Thoma Bravo’s USD 10.55 billion acquisition of Boeing’s Digital Aviation Solutions exemplifies the high valuations commanded by domain-specific monitoring assets.
OpenTelemetry adoption reshapes competitive moats by weakening proprietary agent lock-in and enabling best-of-breed back-end substitution. Smaller challengers exploit this shift with usage-based pricing that appeals to cost-sensitive buyers, especially SMEs. Sustainability analytics stands out as an emerging wedge: vendors integrating carbon dashboards alongside CPU metrics win mindshare among European corporates bound by disclosure regulations. As AI capabilities commoditize, differentiation pivots toward pretrained models tuned for vertical contexts and low-code automation that slashes mean-time-to-restore during high-severity events.
IT Operations Management Industry Leaders
ServiceNow
BMC Software, Inc
SolarWinds Worldwide, LLC
Splunk Inc (Cisco Systems Inc)
IBM
- *Disclaimer: Major Players sorted in no particular order

Recent Industry Developments
- June 2025: New Relic launched its industry-first AI Assistant for observability (NRAI), integrating agentic AI with GitHub Copilot and ServiceNow to automate IT operations workflows.
- June 2025: Ericsson and Supermicro announced a collaboration to accelerate Edge AI deployment, marrying 5G connectivity with edge-optimized servers for real-time data processing.
- May 2025: SCSK Asia Pacific partnered with Cato Networks to roll out SASE services for 15 Southeast Asian corporations by FY 2027.
- April 2025: Boeing agreed to sell parts of its Digital Aviation Solutions business to Thoma Bravo for USD 10.55 billion.


Research Methodology Framework and Report Scope
Market Definitions and Key Coverage
Our study treats the IT Operations Management (ITOM) market as all licensed or subscription-based software platforms and managed modules that monitor, automate, and optimize the health, capacity, and cost of on-premise, cloud, and hybrid IT estates, including AIOps, observability, configuration, and event correlation tools. According to Mordor Intelligence, the 2025 addressable value for this software-led market stands at USD 36.30 billion.
Scope exclusion: hardware appliances, pure consulting projects, and generic help-desk ticketing are kept outside the boundary.
Segmentation Overview
- By Service Type
- On-Page SEO
- Off-Page / Link-Building SEO
- Technical SEO
- Local and Hyperlocal SEO
- E-commerce / Marketplace SEO
- Voice and Visual Search SEO
- Video and Image SEO
- By Organization Size
- Small and Medium Enterprises
- Large Enterprises
- By End-User Industry
- E-commerce and Retail
- IT and Telecom
- Hospitality and Travel
- Real Estate and Construction
- Healthcare and Life-Sciences
- BFSI
- Education
- Media and Entertainment
- Others
- By Service Model
- Subscription / Retainer
- Project-Based
- Hourly-Based
- Performance / Outcome-Based
- By Access Channel
- Desktop Search
- Mobile Search
- Voice Search
- By Geography
- North America
- United States
- Canada
- Mexico
- South America
- Brazil
- Argentina
- Rest of South America
- Europe
- Germany
- United Kingdom
- France
- Italy
- Spain
- Rest of Europe
- Asia-Pacific
- China
- India
- Japan
- South Korea
- Australia and New Zealand
- Rest of Asia-Pacific
- Middle East
- Israel
- Saudi Arabia
- United Arab Emirates
- Turkey
- Rest of Middle East
- Africa
- South Africa
- Nigeria
- Egypt
- Rest of Africa
- North America
Detailed Research Methodology and Data Validation
Primary Research
Mordor analysts interviewed platform architects, DevOps leaders, and channel distributors across North America, Europe, and fast-growing APAC hubs. Conversations verified price bands, deployment mix shifts toward SaaS, and real-world replacement cycles. Then, surveyed buyers highlighted deal size variance between large banks and mid-sized retailers. These insights bridged gaps left by documents and sharpened model assumptions.
Desk Research
We first mapped publicly available benchmarks from statistical portals such as the US Bureau of Labor Statistics (IT labor costs), Eurostat (enterprise cloud adoption), and UN Comtrade (server and switch trade codes), which hint at infrastructure scale. Trade bodies like the Cloud Native Computing Foundation, the IT Service Management Forum, and the Global Data Center Association supplied adoption ratios for Kubernetes, ITSM, and edge nodes that feed demand multipliers. Company 10-Ks, earnings calls, and investor decks revealed vendor license mix and average selling price ranges, while patent analytics from Questel showed the pace of AIOps innovation. Factiva news feeds rounded out growth triggers such as recent outages and new compliance rules. This list is illustrative; many other open and paid references informed our desk work.
Market-Sizing & Forecasting
A top-down read of enterprise IT spending baselines, linked to cloud workload penetration and IT staff-to-server ratios, delivers the first cut. Supplier roll-ups and sampled ASP × active-node counts provide selective bottom-up checks. Key variables tracked include: • number of cloud-managed VMs, • average incidents per device, • share of observability pipelines using OpenTelemetry, • regional GDPR-like regulation count, • median IT wage inflation that nudges automation ROI.
We forecast through multivariate regression, letting those drivers steer growth paths and scenario bands, while gap-handling fills missing vendor revenue with peer-group medians before final triangulation.
Data Validation & Update Cycle
Outputs pass a two-step peer review, anomaly flags trigger reruns, and variance above three percentage points against external benchmarks leads to re-contact with select experts. The model refreshes annually, with interim updates for material vendor acquisitions or regulatory shifts. A last-mile analyst sweep occurs just before client delivery.
Why Mordor's IT Operations Management Baseline Is Dependable
Published figures often diverge because every firm slices the market by slightly different modules, currency bases, and refresh cadences.
Key gap drivers are visible in scope breadth; some studies fold in adjacent ITSM modules, treatment of service revenue, and currency year applied for conversions, which explains why others land high or low next to our disciplined software-only view and yearly recalibration.
Benchmark comparison
| Market Size | Anonymized source | Primary gap driver |
|---|---|---|
| USD 36.30 B (2025) | Mordor Intelligence | - |
| USD 56.34 B (2024) | Regional Consultancy A | Bundles broader IT management suites and counts maintenance services |
| USD 52.34 B (2023) | Global Consultancy B | Uses list prices without discounting and mixes cloud ITSM with ITOM |
| USD 25.00 B (2023) | Industry Analyst C | Focuses only on core monitoring tools, omits AIOps and observability add-ons |
In sum, by anchoring the baseline to clearly stated modules, verified price-volume pairs, and a transparent top-down and bottom-up reconciliation, Mordor Intelligence supplies decision-makers a balanced, traceable reference point they can rely on as strategies evolve.


Key Questions Answered in the Report
What is the current value of the IT operations management market?
The market stands at USD 40.67 billion in 2026 and is projected to reach USD 71.82 billion by 2031.
Which solution segment is expanding fastest?
IT Operations Analytics leads growth, registering a 18.65% CAGR through 2031 within the IT operations management market.
Why are SMEs adopting ITOM platforms rapidly?
Cloud-native delivery and AI-driven automation lower upfront costs and skill barriers, driving a 14.10% CAGR among SMEs between 2026 and 2031.
Which region shows the highest growth rate?
APAC is forecast to expand at 13.95% CAGR, buoyed by large-scale cloud investments and digital-transformation initiatives.
How are sustainability goals influencing ITOM investments?
Corporations now prioritize energy-aware monitoring to track power use and carbon emissions, aligning IT operations with ESG targets.
What role does OpenTelemetry play in ITOM strategies?
The open standard unifies metrics, traces, and logs, reducing integration friction and mitigating vendor lock-in across hybrid environments.
Page last updated on:


