
IT Outsourcing (ITO) Market Size and Share
Market Overview
| Study Period | 2020 - 2031 |
|---|---|
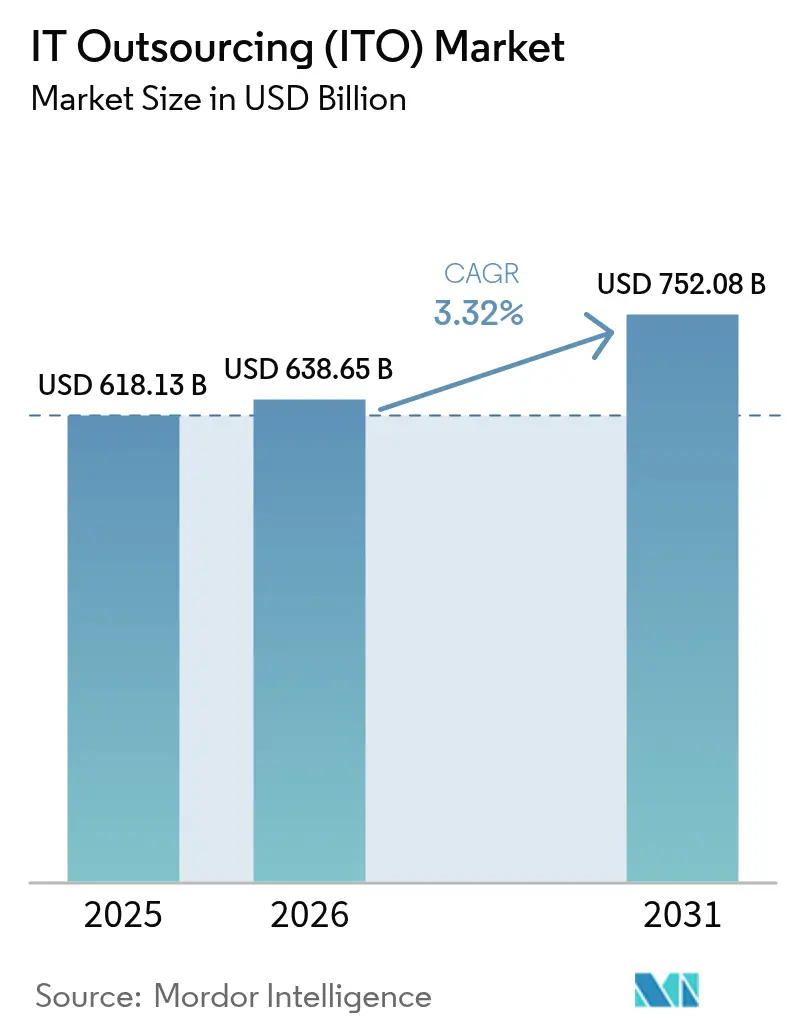
| Market Size (2026) | USD 638.65 Billion |
| Market Size (2031) | USD 752.08 Billion |
| Growth Rate (2026 - 2031) | 3.32% CAGR |
| Fastest Growing Market | Asia Pacific |
| Largest Market | North America |
| Market Concentration | Medium |
Major Players *Disclaimer: Major Players sorted in no particular order Image © Mordor Intelligence. Reuse requires attribution under CC BY 4.0. | |
IT Outsourcing (ITO) Market Analysis by Mordor Intelligence
The IT outsourcing market size was valued at USD 618.13 billion in 2025 and estimated to grow from USD 638.65 billion in 2026 to reach USD 752.08 billion by 2031, at a CAGR of 3.32% during the forecast period (2026-2031). The measured trajectory mirrors the sector’s maturation as generative AI automation reshapes labor-intensive delivery models, spurring new AI-enabled services while compressing traditional headcount-driven contracts. Geopolitical tensions are prompting enterprises to diversify sourcing footprints in response to sovereign-cloud mandates and data-residency rules, leading many buyers to blend offshore, nearshore, and onshore centers for risk mitigation. The cybersecurity talent shortfall of 4.8 million positions worldwide is creating premium demand for managed detection and response offerings. Consolidation is accelerating: recent deals such as Cognizant’s USD 1.3 billion Belcan purchase and Capgemini’s negotiations to acquire WNS illustrate how scale players absorb niche specialists to deepen AI capabilities and broaden portfolios. Cloud-managed services are gaining prominence as enterprises struggle to govern hybrid, multicloud estates, while outcome-based pricing gains favor for its alignment with measurable business results.
Key Report Takeaways
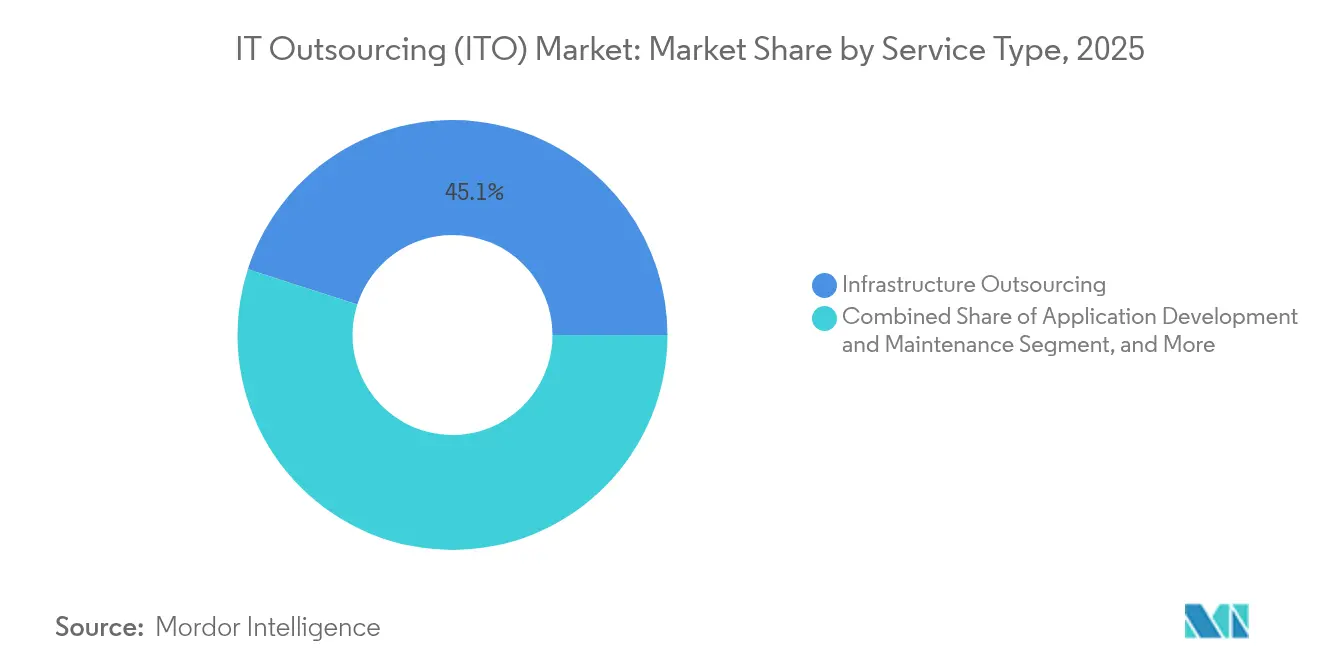
- By service type, infrastructure outsourcing led with 45.05% of IT outsourcing market share in 2025; cloud-managed services is projected to expand at a 3.44% CAGR through 2031.
- By organization size, large enterprises accounted for 67.25% share of the IT outsourcing market size in 2025, whereas SMEs are advancing at a 3.96% CAGR to 2031.
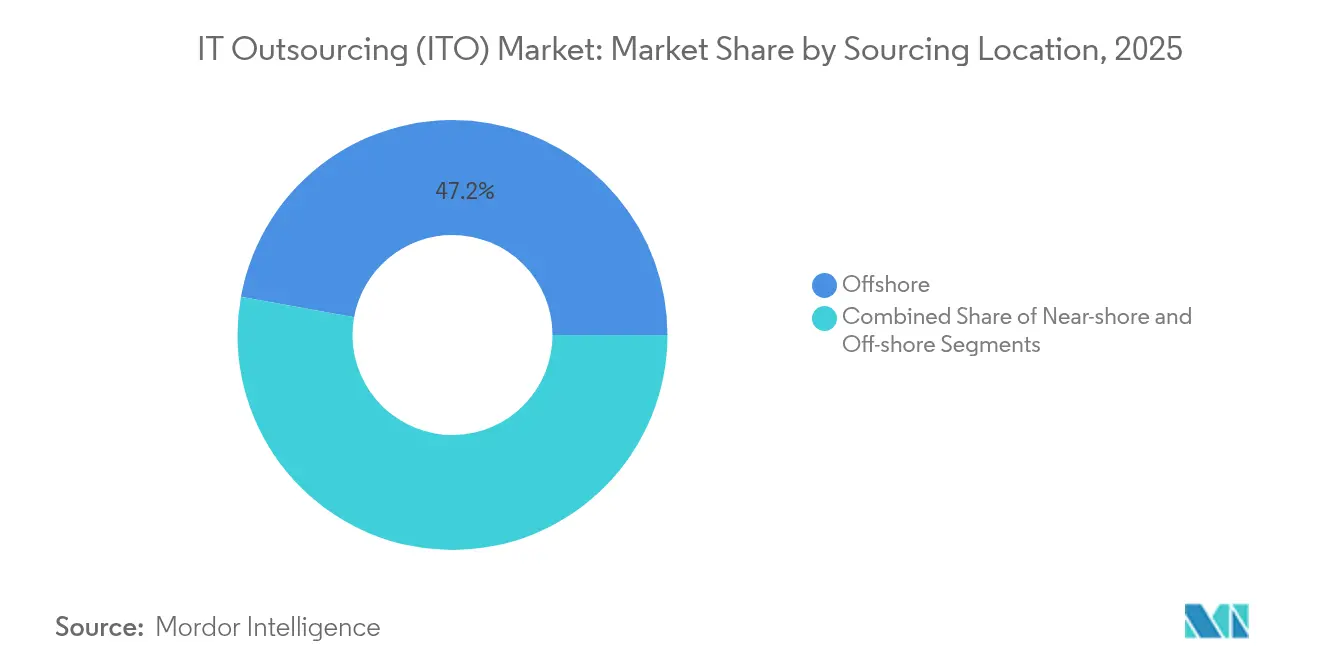
- By sourcing location, offshore centers held 47.15% share of the IT outsourcing market size in 2025; nearshore arrangements are progressing at a 5.12% CAGR through 2031.
- By end-user industry, BFSI captured 25.18% of IT outsourcing market share in 2025, while healthcare and life sciences is set to rise at a 5.46% CAGR to 2031.
- By geography, North America accounted for 24.12% share of the IT outsourcing market size in 2025, whereas Asia-Pacificis set to rise at a 3.66% CAGR to 2031.
Note: Market size and forecast figures in this report are generated using Mordor Intelligence’s proprietary estimation framework, updated with the latest available data and insights as of 2026.
Global IT Outsourcing (ITO) Market Trends and Insights
Drivers Impact Analysis*
| Driver | (~) % Impact on CAGR Forecast | Geographic Relevance | Impact Timeline |
|---|---|---|---|
| Cloud-native application modernisation demand | +0.8% | Global, with concentration in North America and Europe | Medium term (2-4 years) |
| GenAI-enabled service-desk automation | +0.6% | Global, early adoption in North America and Asia-Pacific | Short term (≤ 2 years) |
| Integration of AI and automation in DevOps outsourcing | +0.5% | Global, led by North America and Europe | Medium term (2-4 years) |
| Talent-scarcity in cybersecurity and observability | +0.4% | Global, acute in North America and Europe | Long term (≥ 4 years) |
| Rise of sovereign-cloud and data-residency mandates | +0.3% | Europe, Asia-Pacific, with spillover to other regions | Long term (≥ 4 years) |
| Vendor shift to outcome-based pricing models | +0.2% | Global, early adoption in North America | Medium term (2-4 years) |
| Source: Mordor Intelligence | |||


Cloud-native Application Modernization Demand
Enterprises are re-architecting monolithic systems into microservices, containers, and serverless functions, which opens sizable engagements for platform engineering, Kubernetes orchestration, and event-driven design. Providers increasingly deliver outcome-based contracts that guarantee performance, cost targets, and scalability rather than billing for effort, particularly in highly regulated verticals such as financial services and healthcare where compliance adds complexity.[1]SHRM Editorial, “Geopolitical Tensions Are Shifting Global Talent Strategies,” shrm.org Cultural change management complements the technical shift, and external partners frequently guide agile processes that internal teams cannot easily instill.
GenAI-enabled Service-desk Automation
Generative AI is cutting Level 1 ticket volumes by up to 40% and trimming mean-time-to-resolution by 25% through intelligent routing and self-healing scripts. Virtual assistants now grasp context across multiple systems, drive personalized responses, and predict incidents before users notice disruption. Providers must, however, pair automation with human oversight for complex security issues that demand contextual judgment.
Integration of AI and Automation in DevOps Outsourcing
Machine-learning models embedded in CI/CD pipelines automate code review, testing, and infrastructure provisioning, allowing service partners to promise faster releases with predictive failure analysis and intelligent rollback. AI-driven infrastructure-as-code optimizes resource allocation across multicloud estates, while autonomous observability pinpoints root causes and triggers remediation without manual intervention.
Talent-scarcity in Cybersecurity and Observability
Premium skills in zero-trust frameworks, cloud security architecture, and AI-based threat hunting remain scarce, driving managed security service contracts that blend human experts with AI orchestration to achieve scale.[2]ISC2, “2024 Cybersecurity Workforce Study,” isc2.orgObservability follows a parallel path as enterprises outsource complex telemetry management to ensure full-stack visibility across hybrid environments.
Restraints Impact Analysis*
| Restraint | (~) % Impact on CAGR Forecast | Geographic Relevance | Impact Timeline |
|---|---|---|---|
| Rising geopolitical tensions disrupting offshore delivery centers | -0.4% | Global, concentrated impact on US-China, EU-Russia corridors | Medium term (2-4 years) |
| Escalating IP-theft and ransomware insurance costs | -0.3% | Global, with higher impact in North America and Europe | Short term (≤ 2 years) |
| Volatility in hyperscaler egress pricing | -0.2% | Global, affecting multi-cloud strategies | Short term (≤ 2 years) |
| AI-enabled code-generation reducing outsourcing scope | -0.2% | Global, early impact in North America and Europe | Medium term (2-4 years) |
| Source: Mordor Intelligence | |||
Escalating IP-theft and Ransomware Insurance Costs
Increasing cyber incidents raise premiums and narrow coverage, forcing enterprises to add encryption, access monitoring, and segregated development zones that inflate project costs EY. Buyers now demand providers carry higher insurance limits and submit to regular penetration tests, a hurdle that disadvantages smaller vendors and fuels consolidation.
Rising Geopolitical Tensions Disrupting Offshore Delivery Centers
Data localization laws, export controls, and trade restrictions are pushing 37% of multinationals to diversify delivery footprints beyond single-country dependencies, lengthening procurement cycles and driving preference for shorter, flexible contracts.[3]Accenture, Beyond Uptime: Fueling innovation with infrastructure management,” accenture.comProviders respond by expanding nearshore and onshore hubs, but this adds capital expenditure and erodes historical cost advantages.
*Our forecasts treat driver/restraint impacts as directional, not additive. The impact forecasts reflect baseline growth, mix effects, and variable interactions.
Segment Analysis
By Service Type: Infrastructure Dominance Faces Cloud Disruption
Infrastructure outsourcing commanded 45.05% of the IT outsourcing market in 2025 due to enterprises’ reliance on resilient data center operations that need continuous monitoring and regulatory compliance. Cloud-managed services, however, are pacing the field with a 3.44% CAGR as organizations confront the complexity of hybrid estates spanning AWS, Azure, Google Cloud, and private environments. Providers now bundle unified management platforms that sequence workloads by cost, latency, and compliance preferences, challenging the boundaries between traditional infrastructure management and emerging multicloud orchestration.
Demand for application development and maintenance is being reshaped by low-code and AI-assisted development, pushing vendors to differentiate through domain knowledge and integration expertise. Edge computing and AI model lifecycle services sit in the “Others” bucket and represent nascent yet high-margin opportunities. As cloud adoption rises, incumbents pivot to automated site-reliability-engineering services that deliver guaranteed service-level objectives using AI-driven self-healing, thereby protecting infrastructure revenue streams against price compression.


By Organization Size: SME Acceleration Challenges Enterprise Dominance
Large enterprises retained 67.25% of spending in 2025 as their complex legacy estates require deep architectural know-how, yet SMEs are expanding faster at a 3.96% CAGR. Outcome-based contracts resonate with smaller firms because they align IT spending to tangible business outcomes instead of headcount. Cloud-native vendors lower entry barriers with self-service portals and automated provisioning, giving SMEs on-demand access to AI, analytics, and cybersecurity capabilities once exclusive to Fortune 500 budgets. This democratization of technology widens the total addressable IT outsourcing market and pressures established providers to create modular, standardized offerings that scale down economically without compromising margin.
By Sourcing Location: Nearshore Gains Amid Offshore Resilience
Offshore hubs like India and the Philippines preserved 47.15% of 2025 revenue owing to labor cost advantages of up to 60% over onshore options. Nearshore centers, however, are growing at 5.12% CAGR as enterprises seek time-zone alignment and cultural affinity. Mexico, Costa Rica, and Colombia benefit from United States-Mexico-Canada Agreement provisions, which streamline data transfer and intellectual-property protections, fostering real-time agile collaboration.
Hybrid sourcing models now distribute workloads according to risk tolerance and talent availability. Critical security functions may stay onshore, customer experience platforms shift nearshore for language alignment, and scalable engineering tasks continue offshore. Providers invest in delivery-center diversification to counter geopolitical shocks, while automation reduces sensitivity to wage inflation in high-cost jurisdictions.
By End-user Industry: Healthcare Surge Challenges BFSI Leadership
BFSI accounted for 25.18% of IT outsourcing market revenue in 2025 as core banking, insurance policy administration, and regulatory reporting require 24/7 uptime and bulletproof security. The sector’s sophisticated demands sustain premium pricing for providers with deep domain credentials. This growth stems from stringent data-protection laws such as HIPAA and evolving clinical-trial digitization norms. Retail, manufacturing, and media also present opportunities as they embed IoT, smart-factory analytics, and content-personalization engines into business models. Providers capturing vertical expertise differentiate through accelerators, regulatory toolkits, and pre-configured data models, driving cross-sell potential across industry portfolios.
Geography Analysis
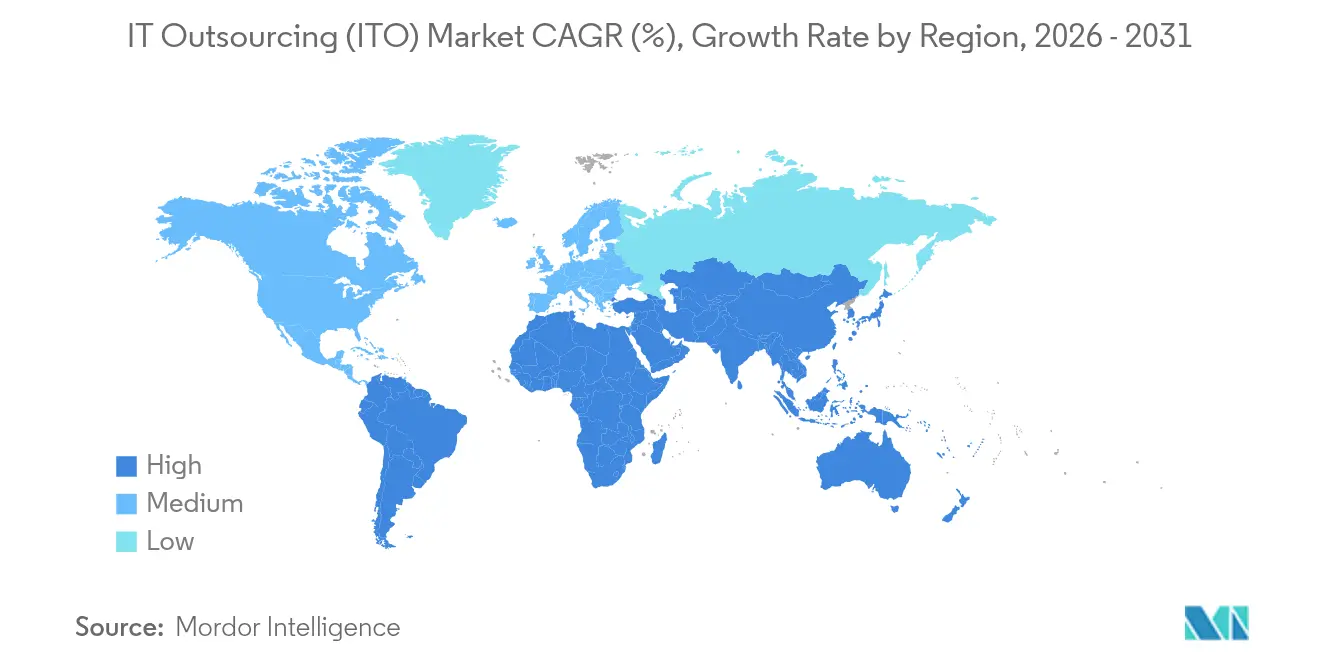
North America’s 24.12% share confirms its status as the prime adopter of AI and cloud modernization initiatives that demand seasoned providers. United States enterprises are renegotiating legacy contracts toward outcome-based terms that stipulate cost-per-transaction or revenue uplift metrics, reducing labor-arbitrage exposure. Canadian firms prioritize zero-trust security frameworks and sovereign cloud instances to comply with stringent privacy acts. Mexican nearshore centers expand agile pods and DevOps capabilities, reducing project latency and enhancing cultural alignment for US clients.
Asia-Pacific’s 3.66% CAGR stems from India’s continued dominance and rising contributions from ASEAN economies. Vietnam, Indonesia, and Malaysia are nurturing engineering talent pipelines through government incentives and academic partnerships, positioning themselves as secondary hubs for application development and testing. Japan and South Korea outsource next-generation network operations and edge-cloud orchestration to compensate for local workforce gaps, and Australia increases demand for managed cybersecurity and cloud FinOps services.
Europe combines stringent data-protection mandates with an appetite for digital sovereignty. Local providers form alliances with hyperscalers to launch region-specific sovereign cloud zones. Germany, France, and the Netherlands drive sectoral cloud migration while insisting on in-country data processing. The United Kingdom, despite Brexit, remains a hub for financial-services outsourcing, emphasizing resilience testing and operational-risk controls. Eastern Europe’s software-engineering clusters offer high-end R&D outsourcing but navigate geopolitical uncertainty through diversification agreements with Western European clients.
Mordor Intelligence provides coverage of the it outsourcing (ito) market across other key regional markets. Detailed country-level analysis extends to United States incorporating local coverage and market participation, as required.

Regulatory Landscape
The IT outsourcing market is increasingly shaped by cross-border data, cybersecurity, and operational-resilience obligations that affect contract structures, audit rights, and delivery-location decisions. In the European Union, the Data Act (Regulation (EU) 2023/2854) entered into application on 12 September 2025 and introduces requirements that affect data processing services, including portability and switching-related provisions that vendors must reflect in SLAs and exit plans. This adds pressure on providers supporting hybrid and multicloud estates to standardize interoperability and handover processes for regulated buyers.
At the same time, national and sector-level measures are tightening governance of third-party risk and critical infrastructure services. The UK published the Cybersecurity and Resilience (Network and Information Systems) Bill on 12 November 2025 to update the NIS framework, reinforcing security and resilience expectations for digital service delivery. Trade and supply-chain policy also intersects with outsourced infrastructure operations: the United States introduced semiconductor tariffs effective 15 January 2026 with carve-outs tied to specific use-cases such as U.S. data centers, increasing compliance tracking requirements for providers bundling infrastructure, procurement, and managed services across global delivery models.
Competitive Landscape
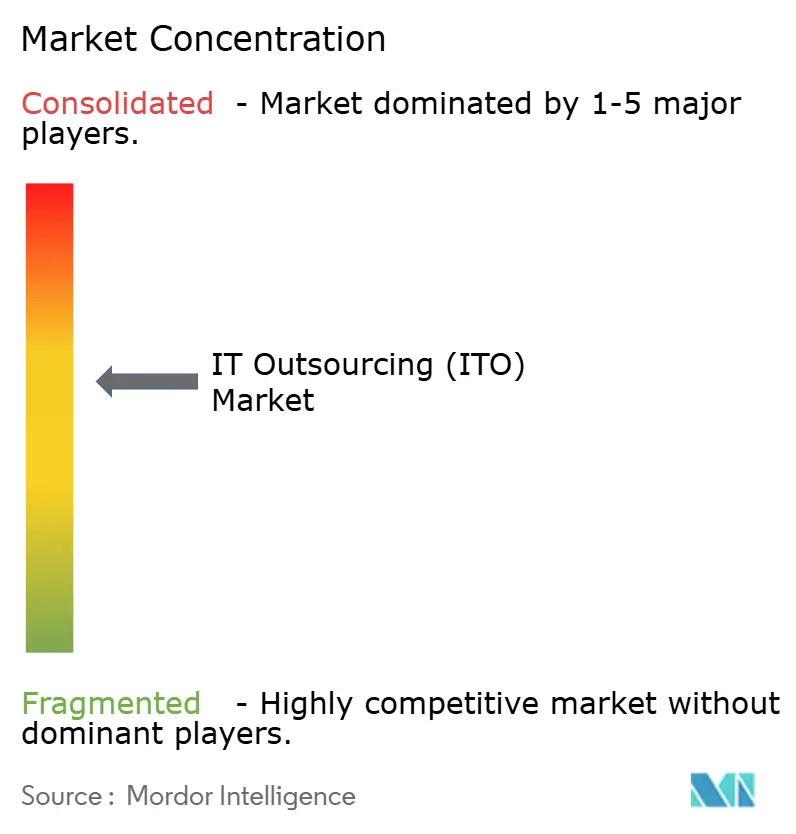
Global revenue concentration is moderate as the top 10 vendors control nearly 40% of spending. Accenture, TCS, and Infosys exploit global delivery centers, expansive portfolios, and automation platforms to anchor multiyear transformation programs. Cognizant, through its Belcan acquisition, adds aerospace-engineering depth and AI-driven digital-product design services, while Capgemini’s pursuit of WNS signals a push into domain-rich business-process management.
Cloud hyperscalers expand professional services arms, blending infrastructure consumption with advisory offerings that squeeze traditional integrators. Meanwhile, niche players such as EPAM Systems, Globant, and Endava use agile product studios and design thinking to win digital-native clients. Providers stake competitive advantage on proprietary AI platforms that automate delivery, with some claiming productivity gains exceeding 30%. Sustainability credentials and transparent carbon reporting are emerging differentiators as European buyers embed environmental criteria into RFPs.
Acquisition velocity is set to persist as firms seek scarce cybersecurity skills and regional delivery footprints. Private-equity investment is rising in mid-tier MSPs, signaling confidence in margin expansion via automation and vertical specialization. White-space opportunities include quantum-computing readiness assessments, edge-AI lifecycle management, and green-IT optimization services that help clients achieve net-zero commitments without sacrificing performance.
IT Outsourcing (ITO) Industry Leaders
IBM Corporation
DXC Technologies
Accenture PLC
NTT Corporation
Infosys Limited
- *Disclaimer: Major Players sorted in no particular order

Market Opportunities and Future Outlook
Cloud switching, portability, and resilience mandates are creating room for vendors that can productize compliance-ready operations across multicloud estates. The EU Data Act application from September 2025, including constraints on switching-related charges through the transition period ending 12 January 2027, is pushing buyers to focus more on exit readiness, interoperability, and standardized migration runbooks, which supports demand for cloud-managed services that combine governance, FinOps, and audit evidence. In the public sector, the UK Cabinet Office issued PPN 024 in June 2026, requiring a Public Interest Test for central government outsourcing contracts above GBP 1 million, which raises the value of transparent delivery models, security controls, and clear justification for external sourcing.
AI-led operating models are also creating whitespace in network and workplace outsourcing where providers can tie outcomes to automation rather than staffing levels. In July 2026, HCLTech announced a USD 1.14 billion, 5.5-year engagement with a Europe-headquartered Fortune Global 50 (reported as Mercedes-Benz) to run digital workplace and enterprise networks, and TCS won a multi-year ABB contract for AI-driven network operations delivered as network-as-a-service, reinforcing procurement appetite for managed, self-healing operations. Buyer-led portfolio realignments further support carve-outs and partnership-led transitions, including CGI and Telia announcing in June 2026 the transfer of Telia's cloud and capacity services for enterprise customers in Finland to CGI, which acts as a deal template where incumbents assume people, platforms, and service obligations under long-term delivery agreements.
Recent Industry Developments
- July 2026: HCLTech signed a seven-year agreement with The Guardian Life Insurance Company of America for AI-powered modernization across technology and operations and agreed to acquire Guardian India, a global capability center with about 2,000 employees. The move strengthens HCLTech's long-term delivery capacity and embeds a client-specific operating model that supports managed services at scale. It also highlights the use of GCC acquisitions to secure talent and continuity for large, multi-year outsourcing relationships.
- June 2026: IBM and Google Cloud announced an expanded partnership, including a new Google Cloud Practice aimed at taking AI into production and modernizing core systems using IBM Consulting Advantage alongside Google Cloud's Gemini Enterprise Agent Platform. This expands the hyperscaler-aligned delivery model for application and infrastructure modernization work commonly packaged within large outsourcing engagements. It also raises the competitive bar for service providers to build repeatable, AI-assisted delivery assets that reduce time-to-value for clients.
- April 2025: Capgemini entered advanced talks to acquire WNS Holdings to deepen business process management and analytics capabilities for global clients. The transaction theme underlines continued consolidation among scale providers seeking domain breadth and data-led transformation capabilities that can be bundled with IT outsourcing contracts. It also signals rising strategic value of vertical process expertise as buyers pursue end-to-end, outcome-linked service models.


Research Methodology Framework and Report Scope
Market Definition and Coverage
We define the IT outsourcing market as the revenues earned by third party providers for delivering outsourced IT services to enterprises under contract, including managed operations and project work.
Scope exclusions: This sizing excludes in-house IT labor, informal freelancing, resale-only hardware revenue, and pure business process outsourcing that does not have an IT service component.
Segmentation Overview
- By Service Type
- Infrastructure Outsourcing
- Application Development and Maintenance
- Cloud-Managed Services
- Others
- By Organization Size
- Small and Medium Enterprises
- Large Enterprises
- By Sourcing Location
- On-shore
- Near-shore
- Off-shore
- By End-user Industry
- BFSI
- Healthcare and Life-Sciences
- Media and Telecommunications
- Retail and E-commerce
- Manufacturing
- Others
- By Geography
- North America
- United States
- Canada
- Mexico
- South America
- Brazil
- Argentina
- Rest of South America
- Europe
- United Kingdom
- Germany
- France
- Italy
- Spain
- Rest of Europe
- Asia-Pacific
- China
- Japan
- South Korea
- India
- Australia
- Rest of Asia-Pacific
- Middle East and Africa
- Middle East
- Saudi Arabia
- United Arab Emirates
- Turkey
- Rest of Middle East
- Africa
- South Africa
- Nigeria
- Egypt
- Rest of Africa
- Middle East
- North America
Data Sources, Market Sizing, and Validation
Desk Research
Desk research was used to set clear market boundaries and to build the first set of inputs around IT spend, outsourcing adoption, and regional demand patterns. We relied on public sources such as the US Bureau of Labor Statistics (for IT employment and wage direction), OECD ICT indicators (for digital intensity and enterprise adoption), the International Telecommunication Union (for connectivity and broadband context), World Bank datasets (for macro and services-sector baselines), and WTO services trade statistics (for cross-border services signals).
To convert these signals into a workable market model, we also reviewed company annual reports, investor presentations, and contract announcements carried in business press. We further used association or standards bodies that publish outsourcing and service management guidance. Where needed, a paid subscription database was used for structured company financials, deal and news tracking, and patent lookups linked to automation and cloud operations themes. The examples above are not exhaustive, and many other public and paid sources were also referred to for data collection, validation, and clarification checks.
Primary Interviews and Surveys
Primary interviews and surveys were used to test what desk research cannot fully answer, including current deal mix, pricing movement, contract lengths, and what portion of IT work is being shifted to on-shore, near-shore, and off-shore delivery. We spoke with a balanced set of respondents across service providers, sourcing advisors, and enterprise buyers, and we ensured coverage across the Americas, EMEA, and APAC so regional delivery realities were not averaged out too early.
Distribution of primary research fieldwork respondents
| Company type | Respondent position | Region |
|---|---|---|
| Top tier: 30% | CXOs: 14% | APAC: 39% |
| Mid tier: 56% | Functional/Unit leaders: 28% | EMEA: 35% |
| Smaller Players: 14% | Managers: 58% | Americas: 26% |
Market-Sizing & Forecasting
Market sizing starts with a top-down build that reconstructs the addressable outsourcing pool from enterprise IT spending patterns and then allocates it using outsourcing penetration by region, industry, and organization size. Once that first cut is ready, it is checked with selective bottom-up approximations, where sampled provider revenue exposure, deal values seen in public disclosures, and channel checks help adjust totals and avoid over-counting.
A few market fingerprints that shape the model include average contract duration and renewal cycles, the split between run operations and change programs, delivery location mix (on-shore, near-shore, off-shore), cloud-managed services attach rates, and wage inflation in key delivery hubs that impacts realized pricing. When primary feedback pointed to missing coverage in smaller contracts and mid-market buying, we applied gap factors based on the observed deal-size distribution and then re-tested these factors with additional interviews.
For forecasting, we use scenario analysis supported by a light multivariate check, where growth is linked to enterprise IT budget direction, cloud migration pace, macro activity in large buyer industries, and sourcing strategy shifts (including vendor consolidation versus multi-sourcing). Forecast assumptions are finalized only after the direction and magnitude are confirmed by respondents who manage active outsourcing programs.
Data Validation & Update Cycle
Outputs are validated through a multi-step review where model totals are compared against independent demand signals, and then the drivers are inspected when the story does not align with what buyers and providers report. We also run variance checks across regions and service types so that one outsized assumption does not silently tilt the full market.
Before sign-off, analysts re-check currency treatment, time alignment of inputs, and extreme year-on-year moves, and re-contact is triggered when a large discrepancy remains unexplained. Reports are refreshed annually, with interim updates when material events occur, and a final pre-delivery review is done so clients receive the latest updated view.
Mordor Intelligence's IT Outsourcing Market Size Versus Other Published Estimates
Published market size numbers for IT outsourcing often differ because each publisher counts a slightly different service bundle, chooses different base years, and applies its own assumptions on pricing and contract mix. Differences also show up when some models lean heavily on reported large-deal values, while others try to capture the long tail of smaller managed services work that is less visible in public data.
In our checks, the biggest gap drivers were whether cloud-managed services are treated as part of outsourcing or kept in a separate cloud services bucket, how on-shore versus off-shore revenue is allocated when delivery is blended, and whether adjacent categories such as IT enabled BPO are included. Currency conversion timing and refresh cadence also matter because large multi-year contracts get repriced and renewed at different points in the year, which can move the current-year value even if volumes look stable.
Benchmark comparison
| Source | Market Size | Gaps in Research Methodology |
|---|---|---|
| Mordor Intelligence | USD 618.13 B (2025) | |
| Industry Research Publisher A | USD 395.76 B (2025) | Uses a narrower count that appears to under-represent managed operations and longer-term application maintenance, and it can also treat some cloud-managed work as a separate market, which lowers the total. |
| Data Aggregator B | USD 369.31 B (2024) | Anchors on a 2024 base with a tighter service definition (mainly infrastructure and application outsourcing), and it can miss smaller contracts and blended delivery revenue that is not consistently disclosed in public sources. |
The spread in the table mainly comes from service scope, what is treated as IT outsourcing versus an adjacent bucket, and then from how deal visibility is handled in smaller and mid-market contracts. When cloud-managed services are counted only when delivered under an outsourcing contract and cross-checked with delivery mix and renewal behavior, the total stays tied to the outsourceable demand pool, which is the approach applied by Mordor Intelligence.


Key Questions Answered in the Report
What is the current value of the IT outsourcing market?
The IT outsourcing market is valued at USD 638.65 billion in 2026 and is projected to reach USD 752.08 billion by 2031.
Which service segment is growing the fastest?
Cloud-managed services lead growth with a projected 3.44% CAGR through 2031 as enterprises grapple with hybrid multicloud complexity.
Why are nearshore locations gaining traction?
Nearshore centers offer time-zone overlap, cultural affinity, and reduced geopolitical risk while maintaining meaningful cost advantages.
How is generative AI influencing outsourcing contracts?
GenAI automates service-desk functions and DevOps tasks, enabling outcome-based contracts that tie provider fees to tangible business results.
Which industry vertical shows the highest outsourcing growth potential?
Healthcare and life sciences is expected to grow at a 5.46% CAGR thanks to telehealth demand, AI-enabled diagnostics, and strict compliance requirements.
What primary challenge threatens continued outsourcing growth?
Escalating cybersecurity insurance costs and heightened data-protection regulations increase delivery complexity and may slow contract expansion.
Page last updated on:




