Market Overview
| Study Period | 2020 - 2031 |
|---|---|
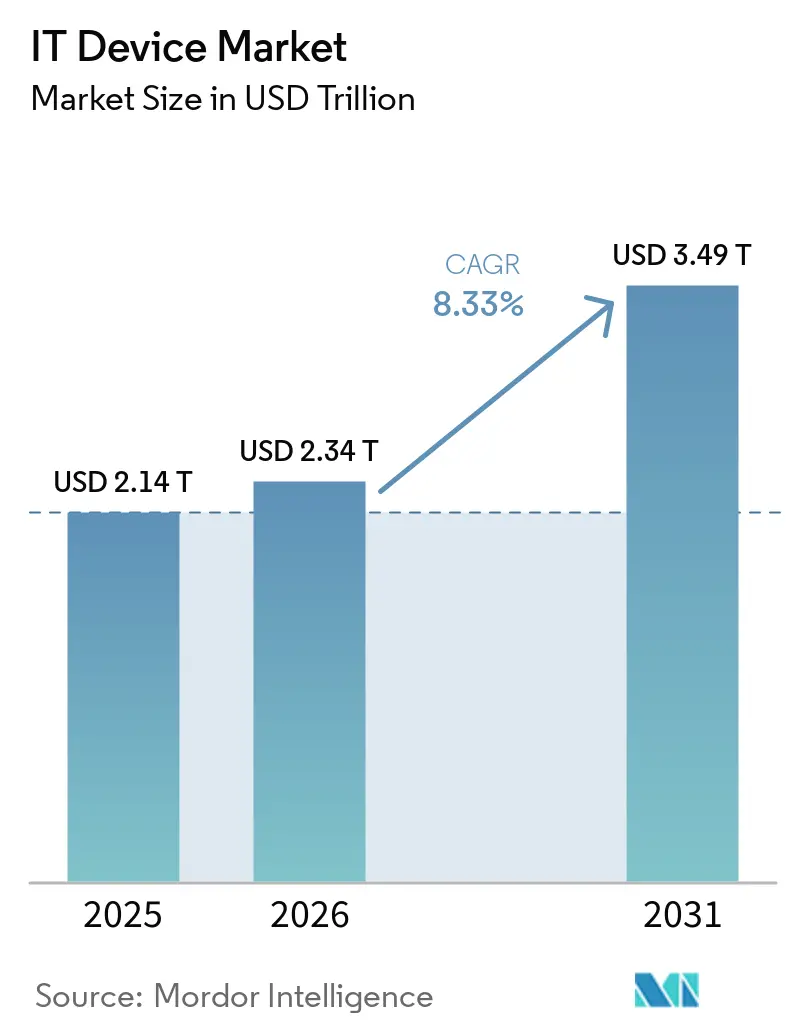
| Market Size (2026) | USD 2.34 Trillion |
| Market Size (2031) | USD 3.49 Trillion |
| Growth Rate (2026 - 2031) | 8.33% CAGR |
| Fastest Growing Market | Asia Pacific |
| Largest Market | North America |
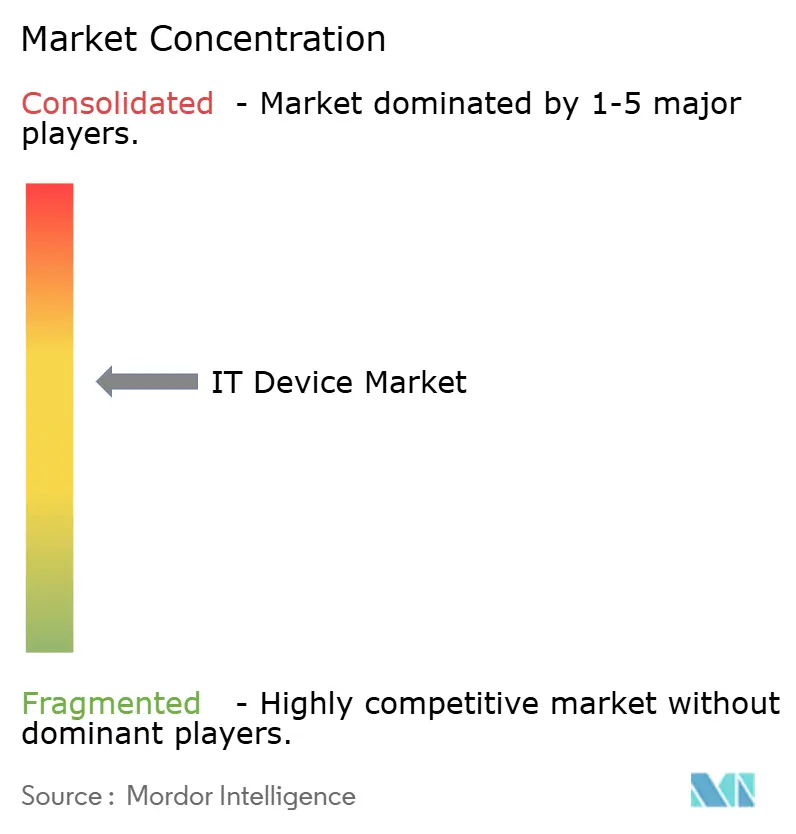
| Market Concentration | Medium |
Major Players *Disclaimer: Major Players sorted in no particular order Image © Mordor Intelligence. Reuse requires attribution under CC BY 4.0. | |
IT Device Market Analysis by Mordor Intelligence
The IT device market size is expected to increase from USD 2.14 trillion in 2025 to USD 2.345 trillion in 2026 and reach USD 3.49 trillion by 2031, growing at a CAGR of 8.33% over 2026-2031. Structural shifts in computing favor on-device artificial intelligence, while supply-chain realignments diversify semiconductor sourcing beyond Taiwan. Edge-AI neural processors, 5G standalone deployments, and enterprise extended-reality training platforms are driving replacement demand that exceeds historical refresh cycles. At the same time, European and selected Asian regulations on repairability and battery longevity shorten product lifespans, pulling upgrades forward even in saturated segments. Geopolitical export controls complicate access to leading-edge chips, yet parallel manufacturing footprints in India, Vietnam, and the United States are buffering price swings and ensuring component continuity for the IT device market.
Key Report Takeaways
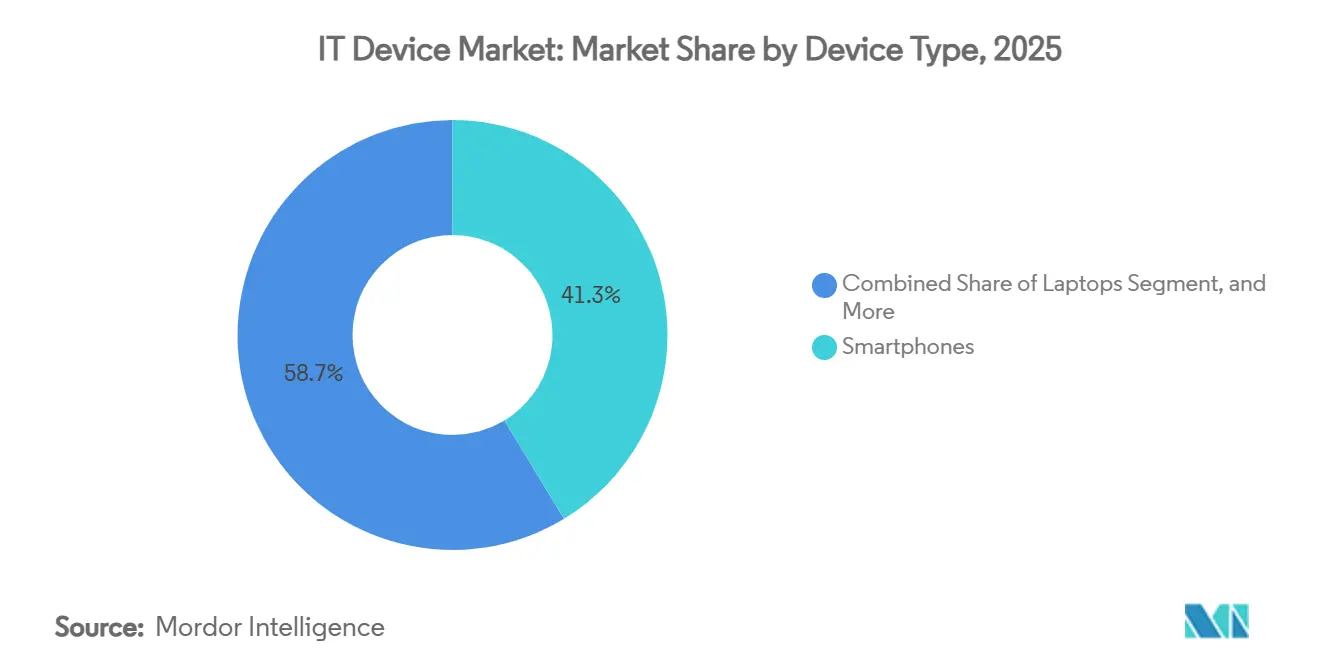
- By device type, smartphones led the IT device market with 41.32% share in 2025, and wearables are the fastest-growing device category, advancing at a 9.73% CAGR through 2031.
- By end user, consumer applications accounted for 52.64% of 2025 revenue, while healthcare is projected to expand at a 9.53% CAGR through 2031.
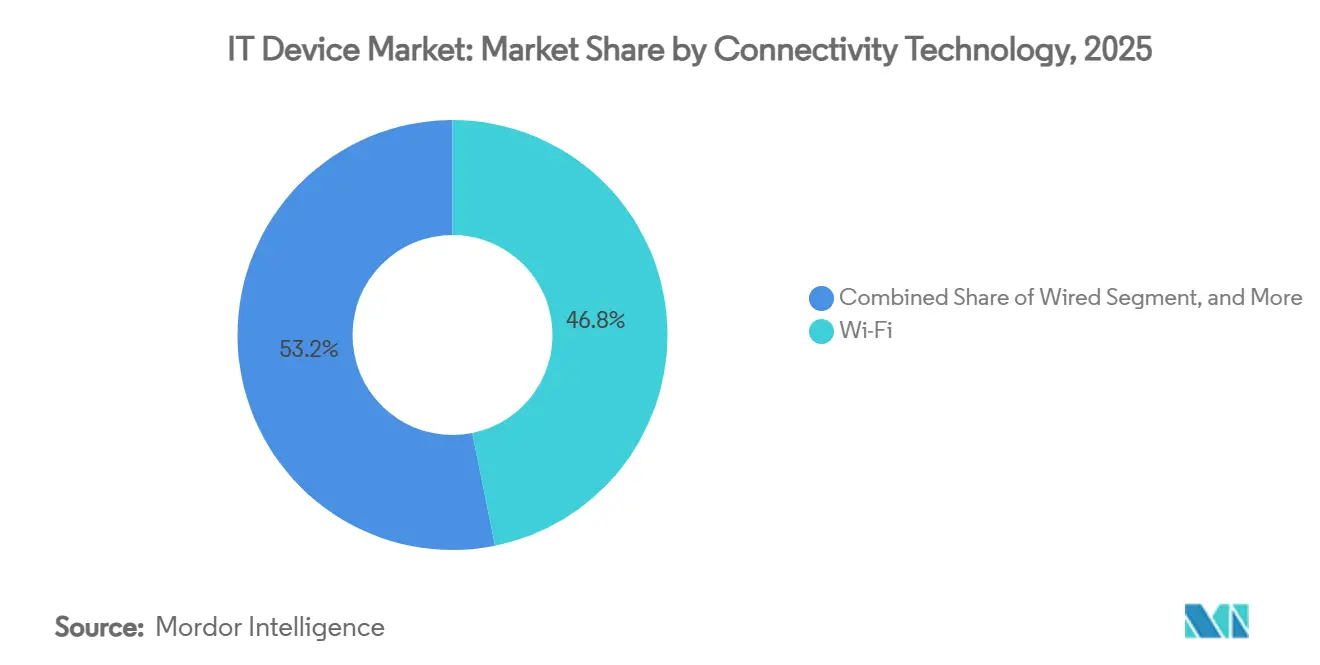
- By connectivity technology, Wi-Fi accounted for 46.83% of 2025 shipments, whereas cellular 4G and 5G solutions are set to grow at a 9.33% CAGR over the forecast period.
- By distribution channel, online retail accounted for 37.29% of the 2025 value, and the channel is accelerating at a 9.13% CAGR through 2031.
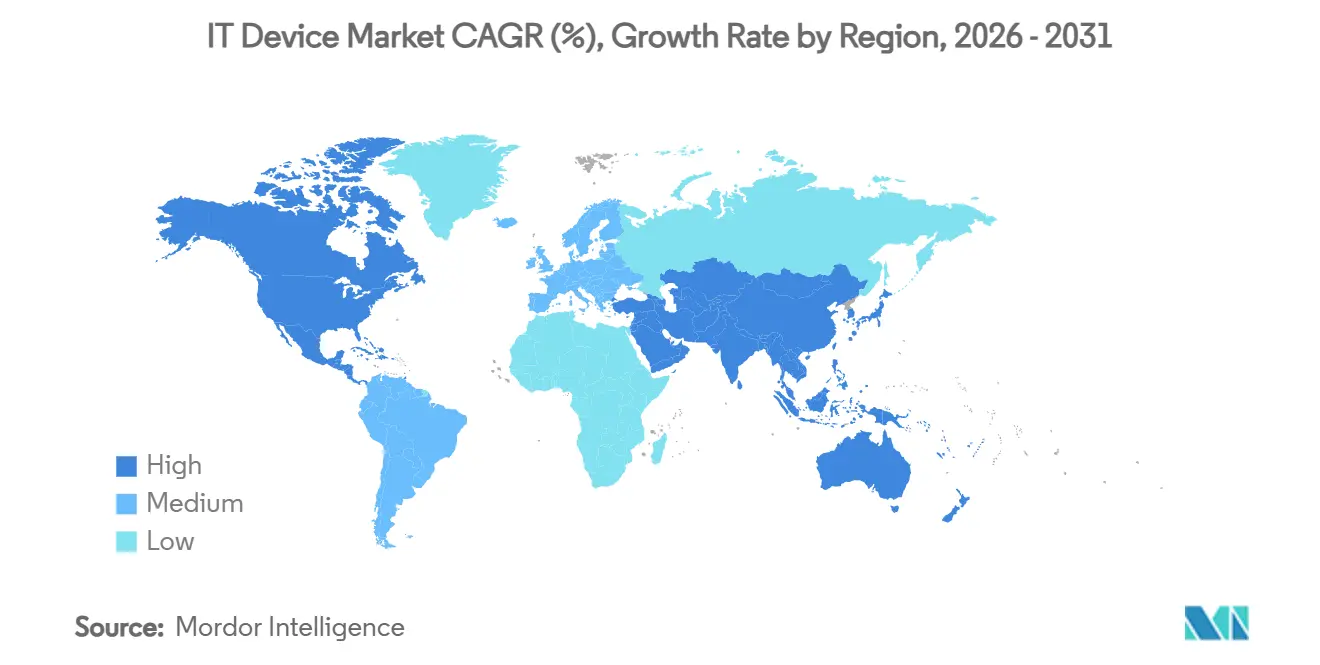
- By geography, North America accounted for 34.98% of global 2025 sales, yet Asia-Pacific is forecast to lead expansion with a 9.38% CAGR through 2031.
Note: Market size and forecast figures in this report are generated using Mordor Intelligence’s proprietary estimation framework, updated with the latest available data and insights as of January 2026.
Global IT Device Market Trends and Insights
Drivers Impact Analysis*
| Driver | (~) % Impact on CAGR Forecast | Geographic Relevance | Impact Timeline |
|---|---|---|---|
| Edge-AI Chip Integration Enabling On-Device Processing | +1.8% | Global, early adoption in North America and Asia-Pacific | Medium term (2-4 years) |
| Accelerating 5G Roll-Outs Boosting Device Refresh Cycles | +1.5% | Asia-Pacific core, spill-over to Europe and Middle East | Short term (≤ 2 years) |
| Hybrid Work Models Sustaining Multi-Device Demand | +1.2% | North America and Europe, selective Asia-Pacific urban hubs | Medium term (2-4 years) |
| Emergence of XR-Ready Wearables for Enterprise Training | +0.9% | North America and Europe defense, healthcare, enterprise | Long term (≥ 4 years) |
| Growing E-Waste Regulations Spurring Modular Designs | +0.7% | European Union, expanding into Asia-Pacific | Long term (≥ 4 years) |
| Semiconductor Supply Diversification Mitigating Price Volatility | +0.5% | Global, with shifts to India, Vietnam, United States | Medium term (2-4 years) |
| Source: Mordor Intelligence | |||
Edge-AI Chip Integration Enabling On-Device Processing
Neural processing units are migrating from data centers into mainstream smartphones, laptops, and tablets, bringing real-time inference for generative artificial intelligence without cloud latency. Qualcomm’s Snapdragon X2 Elite hits 50 TOPS, while Arm’s Ethos-U85 microNPU targets always-on wearables. Data-sovereignty laws in the European Union and China require sensitive data to be stored on local devices, pushing enterprises to demand hardware that can run quantized large-language models directly. Google’s Coral Edge TPU, added to Android handsets, achieved 4-millisecond object-detection latency, a tenfold improvement over cloud paths.[1]Google, “Coral Edge TPU,” coral.ai Device replacement cycles now pivot on AI accelerator capabilities because legacy processors cannot efficiently support modern inference workloads.
Accelerating 5G Roll-Outs Boosting Device Refresh Cycles
GSMA recorded 17.6% global penetration of 5G standalone cores by late 2025, delivering median download speeds 40% higher than those of non-standalone builds. Ookla confirmed consistent sub-20-millisecond latency in South Korea and parts of the United States, unlocking cloud gaming and augmented-reality use cases. Although Allianz found consumers did not upgrade solely for 5G, enterprises are replacing ruggedized tablets and scanners to meet real-time inventory and autonomous vehicle demands. Private 5G in factories and ports raises the baseline specifications for mobile computers, injecting incremental volumes into the IT device market.
Hybrid Work Models Sustaining Multi-Device Demand
Workwize showed 96% of firms had hybrid policies in 2025, with employees using an average of 2.3 devices. Enterprise Technology Research found that 42% of companies plan to boost endpoint budgets in 2026. Zero-trust architecture mandates full-disk encryption and biometric authentication, nudging companies to cycle laptops more quickly than desktops. Extended lifespans for monitors and peripherals offset some volumes, yet supporting both home and office setups lifts aggregate shipments. For enterprises, total cost of ownership now encompasses security certifications, device management, and employee experience rather than only hardware pricing.
Emergence of XR-Ready Wearables for Enterprise Training
Extended-reality headsets such as Varjo’s XR-4 Secure Edition meet defense procurement standards, while HTC’s VIVE Focus 3 serves industrial simulations. The market for XR headsets has experienced significant growth, with unit shipments increasing 18.1% year over year to 14.3 million in Q1 2025. Enterprise buyers value low-latency graphics rendered locally by on-device GPUs and NPUs, which minimize motion sickness and protect proprietary data. As training budgets shift from classroom modules to immersive modules, organizations view XR wearables as cost-effective for complex maintenance and safety drills. These pilots expand the addressable market for IT devices beyond consumer entertainment.
Restraints Impact Analysis*
| Restraint | (~) % Impact on CAGR Forecast | Geographic Relevance | Impact Timeline |
|---|---|---|---|
| Geopolitical Export Controls Limiting Advanced Chip Access | -1.4% | China primary, ripple across Asia-Pacific and Middle East | Short term (≤ 2 years) |
| Intensifying Second-Hand Device Ecosystem Cannibalizing New Sales | -1.1% | North America and Europe mature markets, spreading to Asia-Pacific | Medium term (2-4 years) |
| Consumer Device Saturation in Developed Economies | -0.9% | North America, Western Europe, Japan, South Korea | Long term (≥ 4 years) |
| Rising Cybersecurity Certification Costs for OEMs | -0.6% | Global, driven by European Cyber Resilience Act | Medium term (2-4 years) |
| Source: Mordor Intelligence | |||
Geopolitical Export Controls Limiting Advanced Chip Access
The United States Bureau of Industry and Security capped unlicensed shipments above 300 TOPS or 1,200 TOPS/mm² in October 2024, forcing chipmakers to build detuned variants for China.[2]Bureau of Industry and Security, “Export Controls on Advanced Computing and Semiconductor Manufacturing Items,” bis.doc.gov Distributors in Southeast Asia now require end-use verification, delaying deliveries and adding compliance overhead. Huawei disclosed a 18% surge in component costs in 2025, while its premium phones lag two process nodes behind global leaders. Chinese OEMs are accelerating domestic fabrication plans, yet leading-edge parity remains three to five years away, restraining premium device innovation and tempering the IT device market’s global upside.
Intensifying Second-Hand Device Ecosystem Cannibalizing New Sales
Trade-in programs keep smartphones alive for more than four years, undercutting new mid-tier models. Best Buy’s certified pre-owned revenue rose 15% year-over-year in fiscal 2026, and Apple data signals refurbishment uptake exceeding original forecasts. Right-to-repair mandates in California and the European Union slash aftermarket part prices, making repairs mainstream. While circularity aligns with sustainability goals, it diverts demand from fresh production, compressing margins for original equipment manufacturers and reshaping channel inventory strategies inside the IT device market.
*Our forecasts treat driver/restraint impacts as directional, not additive. The impact forecasts reflect baseline growth, mix effects, and variable interactions.
Segment Analysis
By Device Type: Wearables Narrow the Gap With Smartphones
Wearables posted the highest growth at a 9.73% CAGR, while smartphones retained 41.32% of the 2025 value in the IT device market. Meta commanded 50.8% of global XR headset shipments, proving consumer familiarity now extends into enterprise pilots. Cellular-enabled health monitors such as Withings BeamO Pro merge medical utility with consumer convenience, widening addressable use cases. Foldable phones priced above USD 1,500 create a super-premium niche, but their volumes remain small relative to mainstream models. Meanwhile, printers confront digital substitution, with new growth limited to industrial labels and 3D prototyping. External storage migrates to solid-state solutions as Seagate and Western Digital phase out legacy mechanical drives in favor of high-capacity nearline offerings.
Tablets and laptops experience divergent dynamics. Cloud productivity minimizes the need for high-spec desktops in non-technical roles, yet hybrid work catalyzes ultralight laptop upgrades to support video collaboration. Qualcomm’s Snapdragon X2 Elite enables fanless enterprise laptops, challenging x86 incumbency and extending daily battery life beyond 20 hours. Desktops withdraw into gaming and workstation niches where discrete graphics and open architecture outweigh mobility. Wearables, however, diversify into fitness, professional, and industrial variants, reinforcing specialization across device categories inside the IT device market.


By End-User Industry: Healthcare Devices Scale Connectivity
Consumer spending accounted for 52.64% of revenue in 2025, but healthcare outpaced all verticals with a 9.53% CAGR through 2031. The IT device market share for cloud-connected medical equipment is accelerating as hospitals deploy continuous monitoring systems, projected to reach USD 120.6 billion by 2029. Philips partnered with Respiree to embed FDA-cleared cardio-respiratory sensors into wearables, while Cisco’s Wi-Fi 7 backbone aggregates patient data in real time.[3]Philips, “Philips and Respiree Partnership Announcement,” philips.com Government procurement focuses on cybersecurity-validated hardware, and education budgets shift from pandemic peaks to steady Chromebook replacements. Industrial and manufacturing users install ruggedized tablets integrated with private 5G for autonomous vehicle coordination and quality control.
Enterprise buyers maintain multi-device setups in hybrid work environments, demanding biometric security and endpoint management. Software-as-a-medical-device fast-tracks approvals, tightening feedback loops between clinicians and developers. Consumer saturation in developed regions pushes volume gains toward emerging markets, yet premium device demand remains resilient, preserving value growth. Overall, the healthcare and enterprise segments collectively drive margin expansion in the IT device market.
By Connectivity Technology: Cellular Stakes Out Mobile Dominance
Wi-Fi accounted for 46.83% of 2025 shipments, but cellular 4G and 5G connections are set to grow at a 9.33% CAGR, opening recurring revenue streams for operators. GSMA projects that 5G will account for 80% of European mobile links by 2030. Standalone 5G cuts signaling overhead, delivering battery efficiency that resonates with heavy mobile users. Bluetooth remains ubiquitous for peripheral tethering, and Bluetooth Low Energy proliferates in health trackers and industrial sensors. Near-field communication remains essential for payments, though its growth moderates. Wired interfaces persist in specialized content-creation rigs where latency tolerance is low.
The complementary relationship between Wi-Fi and cellular defines product design. Laptops rely on Wi-Fi 7 for sustained gigabit throughput in offices, while smartphones toggle seamlessly to standalone 5G outdoors. Always-connected personal computers with embedded SIMs target executives who value uninterrupted collaboration. This blended network approach reinforces user expectations for continuous connectivity within the IT device market.
By Distribution Channel: Online Retail Locks in Post-Pandemic Gains
Online retail accounted for 37.29% of 2025 sales and is expanding at a 9.13% CAGR through 2031 as consumers prize doorstep delivery and transparent pricing. Amazon captured 31% of United States electronics purchases versus Best Buy’s 27%. Best Buy’s holiday online penetration peaked at 39%, and its emerging marketplace model invites third-party sellers, mirroring Amazon logistics while exploiting trusted service networks. High-consideration items such as premium smartphones and gaming rigs still drive in-store visits for tactile evaluation, yet click-and-collect bridges online research and physical pickup.
Direct sales play a significant role in enterprise settings, offering tailored solutions that include customization and service-level agreements, which are often beyond the scope of mass retailers. These agreements ensure that enterprise customers receive devices configured to their specific needs and dedicated support services. Value-added resellers (VARs) further enhance this ecosystem by integrating hardware with software solutions and managed services, catering specifically to the requirements of small- and medium-sized businesses (SMBs). This approach allows SMBs to access comprehensive IT solutions without the need for extensive in-house expertise. The contrast between consumer e-commerce platforms and enterprise direct procurement highlights the distinct purchasing priorities within the IT device market. While consumers prioritize convenience and competitive pricing, enterprises focus on reliability, scalability, and long-term support, creating a clear division in market dynamics
Geography Analysis
North America accounted for 34.98% of 2025 revenue, underpinned by premium device demand and hybrid-work hardware upgrades. Workwize documented employees averaging 2.3 endpoints, a metric that pushes replacement volumes even as lifespans edge upward. Endpoint security investments bolster average selling prices, and cross-border e-commerce funnels United States offerings into Canada and Mexico at competitive rates. Regulatory scrutiny remains focused on data privacy rather than hardware import duties, sustaining smooth intra-regional trade.
Asia-Pacific, forecast to grow at 9.38% through 2031, benefits from both manufacturing migration and burgeoning middle-class demand. India’s production-linked incentive scheme approved USD 45 billion in electronics exports, drawing Foxconn and Samsung to expand capacity. Vietnam’s USD 174 billion in electronics exports illustrate diversification away from China, though reliance on external demand exposes it to swings in global trade policy. The region’s personal computer shipments are expected to rebound once memory constraints ease, reinforcing hardware flows that feed the local IT device market.
Europe experiences measured gains amid economic uncertainty, with robust regulatory triggers for device replacement. The European Union’s ecodesign rules, effective June 2025, mandate seven-year spare-parts availability and visible repairability scores, rendering many pre-2022 models non-compliant.[4]European Commission, “Ecodesign for Sustainable Products Regulation,” ec.europa.eu Manufacturers that respond with modular designs gain an early-mover edge, while retailers manage mixed inventories to meet compliance deadlines. South America concentrates growth in Brazil, where smartphone adoption is expanding, and Argentina, where government digital initiatives are procuring education tablets. Middle East and Africa advance from smaller bases, with Gulf Cooperation Council countries deploying 5G networks that elevate enterprise hardware specifications, while African markets favor budget smartphones aligned with purchasing power.

Competitive Landscape
Six vendors account for approximately 80% of the business laptop market, indicating moderate concentration in this segment. However, the smartphone and tablet markets remain more fragmented, with strong competition from regional players. Apple and Samsung continue to lead the premium smartphone segment, capitalizing on their proprietary silicon technologies and ecosystem integration to maintain profit margins exceeding 40%. Xiaomi leverages local manufacturing capabilities in India to cater to cost-conscious consumers, while Huawei focuses on domestic chip design to mitigate the impact of export restrictions. The integration of vertical silicon solutions, such as Qualcomm’s Snapdragon and Apple’s M-series chips, highlights how performance and power efficiency are being enhanced across various device categories.
Ruggedized wearables are emerging as a significant growth opportunity, with products like DigiLens ARGO smart glasses and Zebra handheld devices addressing the needs of warehouse logistics and field maintenance operations. Modular smartphones are gaining traction, particularly in response to European ecodesign regulations. Fairphone has taken the lead in this space, but the segment presents opportunities for larger brands to scale. The certified pre-owned device market adds complexity to pricing strategies, as refurbished flagship models increasingly compete with new mid-tier devices, potentially cannibalizing their sales. Retail dynamics are also evolving, with Best Buy expanding its third-party product listings and Amazon leveraging its logistics capabilities to strengthen its position. These changes are reshaping channel negotiations for manufacturers operating within the IT device market.
Technology roadmaps across the industry are converging on key areas such as neural processing advancements, 5G standalone network compatibility, and adherence to sustainability standards. Vendors that successfully integrate hardware, software, and cloud services are creating comprehensive ecosystems that enhance user retention by increasing switching costs. Start-ups in regions like India and Southeast Asia are entering niche device segments, supported by local government incentives. However, these companies often face challenges in achieving scale due to a lack of proprietary silicon technologies or an extensive service ecosystem.
IT Device Industry Leaders
Lenovo Group Limited
Dell Inc.
Samsung Electronics Co., Ltd.
Apple Inc.
HP Inc.
- *Disclaimer: Major Players sorted in no particular order

Recent Industry Developments
- April 2026: Apple committed USD 500 million to expand its Bangalore research center, focusing on optimizing neural processing units for on-device artificial intelligence in future iPhone and MacBook models.
- February 2026: Samsung Electronics announced a USD 18 billion semiconductor fabrication facility in Taylor, Texas, with 3-nanometer process production slated for 2027.
- January 2026: Dell Technologies partnered with Microsoft to bundle Copilot artificial intelligence capabilities and 12-month Microsoft 365 subscriptions into Latitude and Precision laptops for enterprise clients.
- December 2025: Lenovo acquired a 30% stake in DigiLens for USD 85 million to secure waveguide optics for industrial smartglasses.


Global IT Device Market Report Scope
The IT Device Market encompasses the global production, distribution, and consumption of computing and connected hardware devices designed for data processing, communication, storage, and digital interaction across consumer and enterprise environments. This market includes a wide range of personal and organizational computing devices such as smartphones, laptops, desktops, tablets, wearables, printers, peripherals, and external storage devices.
The IT Device Market Report is Segmented by Device Type (Smartphones, Laptops, Desktops, Tablets, Wearables, Printers and Peripherals, and External Storage Devices), End-User Industry (Consumer, Enterprise, Government, Education, Healthcare, and Industrial and Manufacturing), Connectivity Technology (Wired, Wi-Fi, Cellular 4G and 5G, Bluetooth, and Near-Field Communication), Distribution Channel (Online Retail, Offline Retail, Direct Sales, and Value-Added Resellers), and Geography (North America, South America, Europe, Asia-Pacific, and Middle East and Africa). The Market Forecasts are Provided in Terms of Value (USD).
By Device Type
| Smartphones |
| Laptops |
| Desktops |
| Tablets |
| Wearables |
| Printers and Peripherals |
| External Storage Devices |
By End-User Industry
| Consumer |
| Enterprise |
| Government |
| Education |
| Healthcare |
| Industrial and Manufacturing |
By Connectivity Technology
| Wired |
| Wi-Fi |
| Cellular (4G/5G) |
| Bluetooth |
| Near-Field Communication |
By Distribution Channel
| Online Retail |
| Offline Retail |
| Direct Sales |
| Value-Added Resellers |
By Geography
| North America | United States | |
| Canada | ||
| Mexico | ||
| South America | Brazil | |
| Argentina | ||
| Rest of South America | ||
| Europe | United Kingdom | |
| Germany | ||
| France | ||
| Italy | ||
| Spain | ||
| Rest of Europe | ||
| Asia-Pacific | China | |
| Japan | ||
| India | ||
| South Korea | ||
| Rest of Asia-Pacific | ||
| Middle East and Africa | Middle East | United Arab Emirates |
| Saudi Arabia | ||
| Rest of Middle East | ||
| Africa | South Africa | |
| Egypt | ||
| Rest of Africa | ||
| By Device Type | Smartphones | ||
| Laptops | |||
| Desktops | |||
| Tablets | |||
| Wearables | |||
| Printers and Peripherals | |||
| External Storage Devices | |||
| By End-User Industry | Consumer | ||
| Enterprise | |||
| Government | |||
| Education | |||
| Healthcare | |||
| Industrial and Manufacturing | |||
| By Connectivity Technology | Wired | ||
| Wi-Fi | |||
| Cellular (4G/5G) | |||
| Bluetooth | |||
| Near-Field Communication | |||
| By Distribution Channel | Online Retail | ||
| Offline Retail | |||
| Direct Sales | |||
| Value-Added Resellers | |||
| By Geography | North America | United States | |
| Canada | |||
| Mexico | |||
| South America | Brazil | ||
| Argentina | |||
| Rest of South America | |||
| Europe | United Kingdom | ||
| Germany | |||
| France | |||
| Italy | |||
| Spain | |||
| Rest of Europe | |||
| Asia-Pacific | China | ||
| Japan | |||
| India | |||
| South Korea | |||
| Rest of Asia-Pacific | |||
| Middle East and Africa | Middle East | United Arab Emirates | |
| Saudi Arabia | |||
| Rest of Middle East | |||
| Africa | South Africa | ||
| Egypt | |||
| Rest of Africa | |||


Key Questions Answered in the Report
How large will the IT device market be by 2031?
The IT device market size is projected to reach USD 3.49 trillion by 2031, reflecting an 8.33% CAGR from 2026-2031.
Which device segment is growing the fastest?
Wearables lead growth with a 9.73% CAGR through 2031, driven by extended-reality training and health monitoring demand.
What region is expected to post the highest growth?
Asia-Pacific is forecast to grow at 9.38% annually to 2031, benefiting from manufacturing migration and rising consumer adoption.
How are 5G standalone networks affecting device demand?
Standalone 5G improves download speeds and battery life, spurring enterprise upgrades of rugged tablets and scanners for real-time applications.
Why are healthcare applications important to future sales?
Healthcare devices are projected to rise at a 9.53% CAGR as hospitals deploy cloud-connected monitoring equipment and secure wearables.
How is the second-hand ecosystem influencing new device shipments?
Certified pre-owned programs extend smartphone lifespans to more than four years, diverting demand from new mid-tier models and compressing margins.
Page last updated on:


