IT Operation Analytics (ITOA) Market Size and Share
Market Overview
| Study Period | 2020 - 2031 |
|---|---|
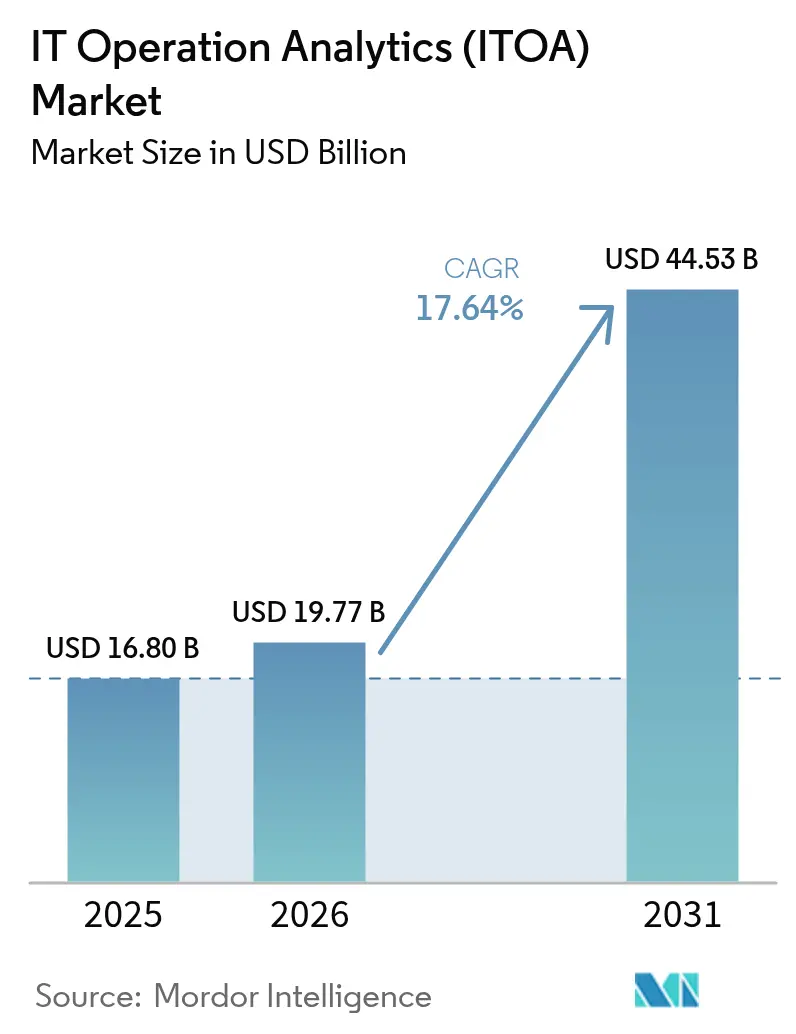
| Market Size (2026) | USD 19.77 Billion |
| Market Size (2031) | USD 44.53 Billion |
| Growth Rate (2026 - 2031) | 17.64% CAGR |
| Fastest Growing Market | Asia Pacific |
| Largest Market | North America |
| Market Concentration | Medium |
Major Players *Disclaimer: Major Players sorted in no particular order Image © Mordor Intelligence. Reuse requires attribution under CC BY 4.0. | |
IT Operation Analytics (ITOA) Market Analysis by Mordor Intelligence
The IT operations analytics market size was valued at USD 16.8 billion in 2025 and estimated to grow from USD 19.77 billion in 2026 to reach USD 44.53 billion by 2031, at a CAGR of 17.64% during the forecast period (2026-2031). Expansion is powered by enterprises re-tooling from reactive monitoring to AI-enabled operational intelligence that prevents costly outages in increasingly hybrid and multi-cloud estates. Cloud deployment is the default architecture because it eliminates hardware overhead and permits elastic scaling, while predictive analytics de-risks business-critical workloads by turning raw telemetry into early-warning signals. Intensifying regulatory scrutiny in financial services and heightened cyber-risk across critical infrastructure further amplify adoption. Market momentum is reinforced by strategic M&A, notably Cisco’s USD 28 billion purchase of Splunk, which marries deep-packet visibility with advanced analytics to create end-to-end insight platforms.
Key Report Takeaways
- By deployment, cloud models commanded 70.72% revenue in 2025; on-premises options trail but are projected to grow just 9.1% CAGR as compliance-driven users maintain local control.
- By application, security and network monitoring led with 28.60% of the IT operations analytics market share in 2025, while AIOps and root-cause analytics are poised for 23.86% CAGR to 2031.
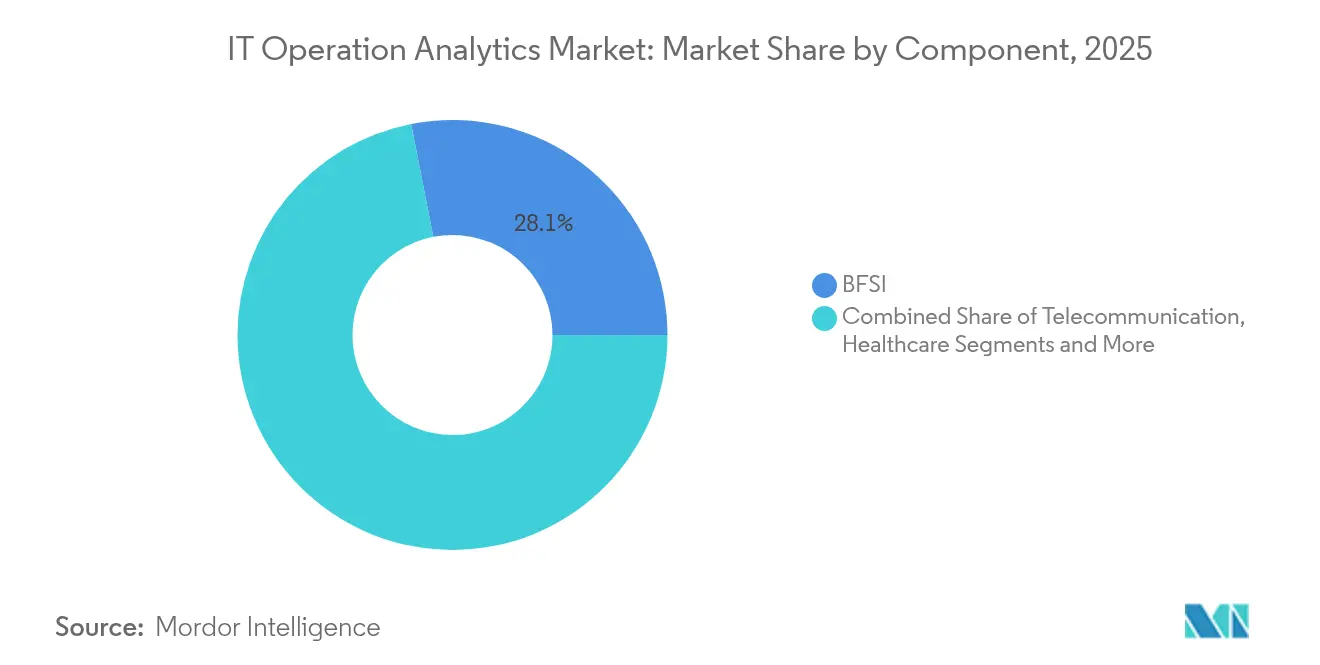
- By end-user industry, BFSI held 28.08% revenue share in 2025; government workloads are forecast to expand at 22.3% CAGR through 2031.
- By analytics type, predictive models accounted for 31.70% of the IT operations analytics market size in 2025, whereas behavior analytics is projected to post 24.4% CAGR.
- By geography, North America captured 37.00% revenue in 2025, yet Asia-Pacific is accelerating at 19.1% CAGR on the back of manufacturing digitization and smart-city programs SAS.
Note: Market size and forecast figures in this report are generated using Mordor Intelligence’s proprietary estimation framework, updated with the latest available data and insights as of 2026.
Market Trends and Insights
Drivers Impact Analysis of IT Operation Analytics (ITOA) Market*
| Driver | (~) % Impact on CAGR Forecast | Geographic Relevance | Impact Timeline |
|---|---|---|---|
| Cloud-native observability adoption accelerates real-time ITOA demand | +4.2% | Global, highest in North America & EU | Medium term (2–4 years) |
| Rapid shift from siloed ITOM tools to unified AIOps suites | +3.8% | Global, led by large enterprises | Medium term (2–4 years) |
| Need for predictive outage prevention in hybrid-cloud estates | +3.1% | Global, multi-cloud operators | Short term (≤ 2 years) |
| FinOps mandates push cost-aware analytics adoption | +2.4% | North America & EU, expanding in APAC | Long term (≥ 4 years) |
| Source: Mordor Intelligence | |||
Cloud-Native Observability Adoption Accelerates Real-Time ITOA Demand
Cloud-first architectures fragment workloads across containers, serverless functions and edge nodes, making unified telemetry indispensable. Organizations that implement modern observability platforms record 45% faster mean-time-to-resolution than users of legacy tools. Integrated pipelines stream logs, metrics and traces into a single data plane, where machine-learning models flag anomalies and launch auto-remediation. Tight coupling with DevOps workflows lets engineers catch performance regressions before production cut-overs. Together these capabilities lift service reliability while shrinking incident noise, propelling the IT operations analytics market forward.
Rapid Shift from Siloed ITOM Tools to Unified AIOps Suites
Enterprises historically juggled 15–20 standalone monitoring products, breeding alert fatigue and blind spots. Consolidated AIOps suites collapse those silos and apply AI for event correlation, cutting manual operational effort by 90% and shrinking incident resolution time 21%.[1]New Relic, “AI in Observability: Advancing System Monitoring and Performance,” newrelic.comCentralized insight also trims vendor overhead and licensing complexity. As hybrid architectures multiply data sources, one-stop suites that fuse infrastructure, application and business metrics become essential, squeezing single-function vendors and reinforcing platform plays that dominate the IT operations analytics market.
Need for Predictive Outage Prevention in Hybrid-Cloud Estates
Hybrid estates blend legacy data centers with public cloud, raising failure modes that reactive alerting misses. Predictive engines mine historical incidents to surface emerging risk patterns so teams can patch during maintenance windows.[2]Eaton, “Remote Monitoring Service for Mission-Critical IT,” eaton.com Eaton’s PredictPulse service showcases the model by supplying 24/7 health checks that avert unexpected interruptions and lower downtime 30–40%. Given that an hour of outage can exceed USD 1 million for large firms, proactive prevention remains a core reason the IT operations analytics market expands at double-digit rates.
FinOps Mandates Push Cost-Aware Analytics Adoption
As cloud bills swell, CFOs demand granular usage insight and charge-back governance. Platforms that marry resource telemetry with real-time cost attribution help companies trim operating expenses 30–40% by rightsizing capacity and scheduling off-peak workloads. FinOps frameworks are embedding directly into AIOps dashboards, aligning engineering actions with fiscal policy. The cross-disciplinary value proposition broadens buyer personas, adding finance stakeholders to the IT operations analytics market.
Restraints Impact Analysis of IT Operation Analytics (ITOA) Market*
| Restraint | (~) % Impact on CAGR Forecast | Geographic Relevance | Impact Timeline |
|---|---|---|---|
| High initial data-engineering & licensing costs | -2.1% | Global, toughest on SMEs | Short term (≤ 2 years) |
| Shortage of site-reliability / DevSecOps skillsets | -1.8% | Global, acute in APAC | Medium term (2–4 years) |
| Source: Mordor Intelligence | |||
High Initial Data-Engineering & Licensing Costs
Standing up full-scale analytics pipelines can top USD 10 million once data lakes, stream processors and AI tooling are counted. Fee structures that charge per node or per GB scale linearly with infrastructure growth, constraining budget predictability. Smaller enterprises see total cost of ownership absorb 15–20% of annual IT spend, delaying entry into the IT operations analytics market. Cloud SaaS models soften capex, but long-term subscription totals can still rival on-premise expense.
Shortage of Site-Reliability / DevSecOps Skillsets
Modern AIOps demands specialists who juggle Kubernetes, CI/CD, security automation and machine-learning pipelines. Talent remains sparse and commands premiums of 40–50% over classic operations roles. Regional gaps are widest in Asia-Pacific, lengthening deployment cycles and inflating consulting fees. Limited human capital therefore restrains near-term adoption velocity within the IT operations analytics market.
*Our forecasts treat driver/restraint impacts as directional, not additive. The impact forecasts reflect baseline growth, mix effects, and variable interactions.
IT Operation Analytics (ITOA) Market Segment Analysis
By Deployment:
Cloud Dominance Accelerates Platform ConsolidationCloud deliveries secured 70.72% of the IT operations analytics market share in 2025 and are forecast to rise at 21.95% CAGR through 2031, underscoring buyer preference for managed services that eliminate hardware upkeep. This model slashes deployment lead-times by up to 60% and aligns capacity with volatile telemetry loads, directly enlarging the IT operations analytics market size by USD 15.1 billion over the forecast window. In contrast, on-premise options persist in heavily regulated verticals that must anchor data within jurisdictional borders.
Financial institutions and public agencies retain local stacks for sovereignty mandates, yet even these users increasingly adopt hybrid blends that shuttle non-sensitive workloads to SaaS AIOps platforms. Hyperscalers strengthen their advantage by embedding observability hooks directly into infrastructure-as-code templates, further consolidating buyer spend. At the edge, lightweight collectors push summaries to cloud cores, preserving low latency while retaining centralized analytics governance.


By Application:
Security Monitoring Drives AIOps IntegrationSecurity and network monitoring constituted 28.60% of the IT operations analytics market in 2025 as cyberattacks exploit operational weak points before signature-based tools trigger. Converged SecOps dashboards that correlate packet flows with application traces detect anomalies 50% faster than siloed models, reinforcing the IT operations analytics market size premium attached to risk mitigation.
AIOps-centric root-cause analytics is the fastest riser, clocking 23.86% CAGR, as AI-driven clustering collapses duplicate alerts and pinpoints origin faults. Infrastructure monitoring matures toward predictive capacity planning, while business service monitoring links SLO breaches to revenue impact, a feature prized by digital retailers during flash-sale peaks. Telecom operators harness 5G network data-analytics functions to lower total cost of ownership 45%, illuminating the breadth of use cases spanning the IT operations analytics market.
By End-User Industry:
BFSI Leadership Drives Regulatory ComplianceBFSI captured 28.08% revenue in 2025 because downtime directly jeopardizes customer trust and invites regulatory sanction. Consistent 24x7 uptime needs predictive insight that only sophisticated analytics can supply, allowing the sector to invest earliest and deepest in the IT operations analytics market.
Government entities, however, represent the quickest riser with projected 22.3% CAGR as modernization funds shift budgets away from legacy maintenance toward insight-driven operations. Healthcare, telecom and manufacturing each weave IT and OT data to uphold patient safety, optimize 5G performance or orchestrate Industry 4.0 automation respectively, broadening the IT operations analytics industry footprint across verticals.
By Analytics Type:
Predictive Intelligence Transforms OperationsPredictive engines held 31.70% of 2025 revenue, anchoring the proactive culture reshaping the IT operations analytics market. Combined ML models slash unplanned downtime up to 40% by flagging anomalies hours before user impact, directly converting into USD-denominated savings for mission-critical operators.
Behavior analytics now posts the strongest trajectory at 24.4% CAGR because understanding user journeys across micro-services reveals latent friction that infrastructure graphs miss. Root-cause, visual and conversational analytics round out the stack, each benefitting from shared data pipes and continuous-learning algorithms that uplift collective accuracy.
Geography Analysis
North America IT Operation Analytics (ITOA) Market
North America led the IT operations analytics market with 37.00% revenue in 2025, buoyed by mature DevOps cultures, well-funded venture ecosystems and federal programs that subsidize cloud migration. Flagship vendors such as Splunk, IBM and ServiceNow enjoy dense enterprise install bases, so regional growth pivots from greenfield deployments toward value-added AI extensions and cross-domain integrations. Regulatory pushes for zero-trust architectures further elevate analytics budgets, though overall expansion moderates as first-wave projects reach optimization stage.
APAC IT Operation Analytics (ITOA) Market
Asia-Pacific is the fastest-growing geography, projected at 19.1% CAGR to 2031. Governments position AI adoption as a lever for industrial competitiveness, prompting manufacturers to integrate shop-floor OT streams with IT telemetry for predictive maintenance rollouts. AI investment intentions exceed 20% budget growth among 43% of enterprises, feeding a sizeable pipeline of analytics demand. Edge-native architectures, abundant engineering talent and vibrant start-up ecosystems offset skills shortages in advanced SRE disciplines, cementing the region as a primary engine of the IT operations analytics market.
Europe IT Operation Analytics (ITOA) Market
Europe balances innovation with strict data-sovereignty rules, requiring platforms to localize processing while enabling federated analysis across borders. Legislation such as the Digital Operational Resilience Act shapes procurement criteria toward auditability and governance, prompting vendors to add policy-aware data-routing features. Sustainability directives create incremental use cases as enterprises leverage analytics to track energy consumption and carbon footprints within data centers. Despite slower macro-economic growth, compliance-driven spending keeps the IT operations analytics market vibrant across the continent.


Competitive Landscape
The IT operations analytics market is moderately fragmented. Platform leaders such as Cisco (post-Splunk), IBM, ServiceNow and Broadcom-VMware are expanding through acquisitions that aggregate logging, tracing and network visibility under one roof. Cisco’s landmark USD 28 billion Splunk deal explicitly fuses deep-packet inspection with AI-based security analytics, underlining the strategic premium on integrated data planes.
Cloud hyperscalers intensify rivalry by embedding observability pipelines into native services and bundling them at aggressive price points. Amazon Web Services, Microsoft Azure and Google Cloud each now ship dashboards that auto-discover resources, crowding independent vendors in core infrastructure monitoring. Patent filings show a shift toward causal-graph engines that predict service degradation pathways, evident in recent USPTO approvals that quantify AIOps capability maturity.[3]U.S. Patent and Trademark Office, “Patentee Index,” patentsgazette.uspto.gov
Niche players carve white-space through vertical specialization—edge analytics for smart-factories, HIPAA-grade monitoring for healthcare or NWDAF-based insight for telecom—winning deals where domain context outweighs horizontal breadth. Open-source stacks such as Elastic surge in smaller enterprises that prize cost control, reporting USD 347 million Q1 FY2025 revenue on strong cloud uptake Elastic. Overall, sustained M&A and hyperscaler bundling will keep competitive dynamics fluid throughout the forecast horizon.
IT Operation Analytics (ITOA) Industry Leaders
IBM Corp.
Splunk Inc.
ServiceNow Inc.
Dynatrace Inc.
VMware Inc. (Broadcom)
- *Disclaimer: Major Players sorted in no particular order

IT Operation Analytics (ITOA) Market Companies Covered in this Report
- Splunk Inc.
- IBM Corporation
- ServiceNow Inc.
- VMware Inc. (Broadcom)
- Dynatrace Inc.
- Oracle Corporation
- BMC Software Inc.
- Micro Focus Intl. plc
- Cisco Systems Inc.
- AppDynamics LLC
- Elastic N.V.
- SAS Institute Inc.
- New Relic Inc.
- PagerDuty Inc.
- Datadog Inc.
- SolarWinds Corp.
- ManageEngine (Zoho)
- OpsRamp Inc.
- Evolven Software
- XpoLog Ltd.

Recent Industry Developments in IT Operation Analytics (ITOA) Market
- June 2025: Broadcom reported USD 15 billion quarterly revenue, with AI semiconductor sales up 46% YoY, reinforcing semiconductor ties to analytics growth
- May 2025: European regulators criticized Broadcom’s VMware pricing model as anti-competitive, spotlighting risks tied to consolidation strategies CRN.
- February 2025: Cisco posted USD 14 billion Q2 FY2025 revenue with AI infrastructure orders surpassing USD 350 million, signaling robust demand for AI-ready networks
- January 2025: GlobalFoundries announced USD 16 billion to expand U.S. semiconductor fabrication, easing hardware supply bottlenecks that influence on-prem analytics deployments
- November 2024: Cisco closed its USD 28 billion acquisition of Splunk, creating a unified network-plus-observability powerhouse


IT Operation Analytics (ITOA) Market Report Scope and Research Methodology
Market Definition and Coverage
Our study defines the IT Operations Analytics market as every commercial software license, subscription, or managed-service fee that helps enterprises ingest, correlate, and analyze telemetry from networks, servers, applications, and cloud resources to predict, detect, and resolve operational incidents. The frame captures pure-play ITOA and integrated AIOps modules sold to end users across all industry verticals and geographies.
Tools limited to business intelligence dashboards, one-off log parsers, or bespoke internal scripts are outside the scope.
Segments Covered in This Report
- By Deployment
- Cloud-based
- On-premise
- By Application
- Application Monitoring
- Business and IT-Service Monitoring
- Infrastructure Monitoring
- Network and Security Monitoring
- By End-user Industry
- BFSI
- Healthcare
- Telecommunication
- Retail and E-commerce
- Industrial / Manufacturing
- Government and Public Sector
- By Analytics Type
- Predictive Analytics
- Root-Cause Analytics
- Visual / Dashboard Analytics
- Behavior Analytics
- By Geography (Cross-segmentation)
- North America
- United States
- Canada
- Mexico
- Europe
- United Kingdom
- Germany
- France
- Italy
- Rest of Europe
- Asia-Pacific
- China
- Japan
- India
- South Korea
- Rest of Asia
- Middle East
- Israel
- Saudi Arabia
- United Arab Emirates
- Turkey
- Rest of Middle East
- Africa
- South Africa
- Egypt
- Rest of Africa
- South America
- Brazil
- Argentina
- Rest of South America
- North America
Data Sources, Market Sizing, and Validation
Primary Research
Mordor analysts interviewed platform architects in North America, Europe, and Asia Pacific alongside procurement heads in BFSI, telecom, and healthcare. Guided dialogues clarified typical license constructs, emerging AIOps use cases, average seats per environment, and price realization, closing gaps left by desk work and refining model assumptions.
Desk Research
We started with public datasets that anchor enterprise IT spend and digital workload shifts, such as U.S. Bureau of Labor Statistics ICT spending tables, Eurostat cloud adoption surveys, OECD Digital Economy indicators, and FCC broadband capacity releases. Trade groups like the Cloud Native Computing Foundation and DevOps Institute feed trend breakpoints on containerized workloads and skills gaps. Company filings, investor decks, and reputable press rounded out vendor revenue splits. Where granular splits were missing, query pulls from D&B Hoovers and news traces on Dow Jones Factiva supplied directional clues. The sources listed are illustrative; many additional publications were consulted to validate and contextualize findings.
Market-Sizing & Forecasting
A top-down reconstruction begins with enterprise software expenditure by vertical, filtered through observability and incident-management penetration ratios before applying ITOA adoption shares. Select bottom-up checks (vendor revenue roll-ups, channel ASP × estimated nodes) align totals. Key variables include cloud workload share, average data-ingest volumes, security event frequency, subscription ASP trends, and AIOps penetration uplift. Forecasts rely on multivariate regression that links these drivers to historic spend patterns; then scenario analysis adjusts for macro or regulatory shocks.
Data Validation & Update Cycle
Outputs pass two-level analyst review, variance tests against independent IT spend trackers, and recontact of experts when anomalies surface. Models refresh annually, with interim updates for material events; a final sweep occurs immediately before release so clients receive the latest view.
How Mordor Intelligence's IT Operation Analytics (ITOA) Market Size Compares to Other Published Estimates
Published figures frequently diverge because firms mix AIOps suites, broader ITOM stacks, or even services revenue. Mordor narrows scope to pure ITOA software revenue, converts at constant 2024 dollars, and refreshes models every twelve months, which keeps our baseline grounded and current.
Key gap drivers include some studies that bundle implementation services, others that extrapolate global totals from limited vendor surveys, and many that apply single-year currency rates that distort multi-region data. Our disciplined variable selection and dual-path validation mitigate such skews.
Benchmark comparison
| Market Size | Anonymized source | Primary gap driver |
|---|---|---|
| USD 16.8 billion (2025) | Mordor Intelligence | - |
| USD 26.8 billion (2024) | Global Consultancy A | Includes services plus AIOps platforms, uses aggressive cloud-data multiplier |
| USD 15.02 billion (2024) | Industry Publisher B | Relies on vendor surveys only and single-point currency conversion |
Taken together, the comparison shows that Mordor's clearly bounded scope, annual refresh cadence, and twin validation paths deliver a balanced, transparent baseline managers can replicate and trust for planning decisions.


Key Questions Answered in the Report
What is driving growth in the IT operations analytics market through 2031?
Enterprise migration to hybrid and multi-cloud infrastructures, demand for predictive outage prevention, and consolidation of monitoring tools into AI-powered AIOps suites together propel a 17.64% CAGR.
Which deployment model is most popular today?
Cloud-based platforms dominate with 70.72% revenue share in 2025 because they reduce hardware overhead and allow elastic scaling.
Why is Asia-Pacific the fastest-growing region?
Manufacturing digitization, smart-city investments and government-backed AI programs push the region to a projected 19.1% CAGR.
How does predictive analytics add value to IT operations?
Predictive engines cut unplanned downtime 30–40% by detecting risk patterns early, saving enterprises significant outage-related costs.
Which industry vertical spends the most on IT operations analytics?
Banking, financial services and insurance leads with 28.08% market share due to strict uptime mandates and regulatory compliance requirements.
Page last updated on:


