IoT Enabled Packaging Market Size and Share
Market Overview
| Study Period | 2019 - 2030 |
|---|---|
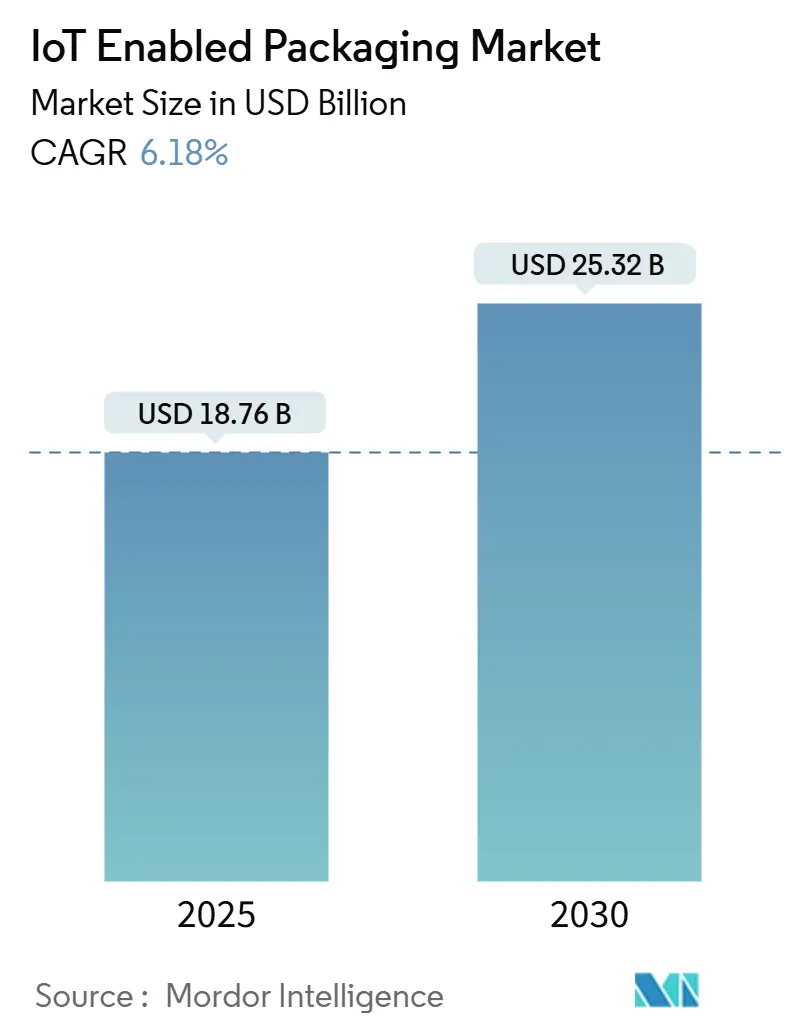
| Market Size (2025) | USD 18.76 Billion |
| Market Size (2030) | USD 25.32 Billion |
| Growth Rate (2025 - 2030) | 6.18% CAGR |
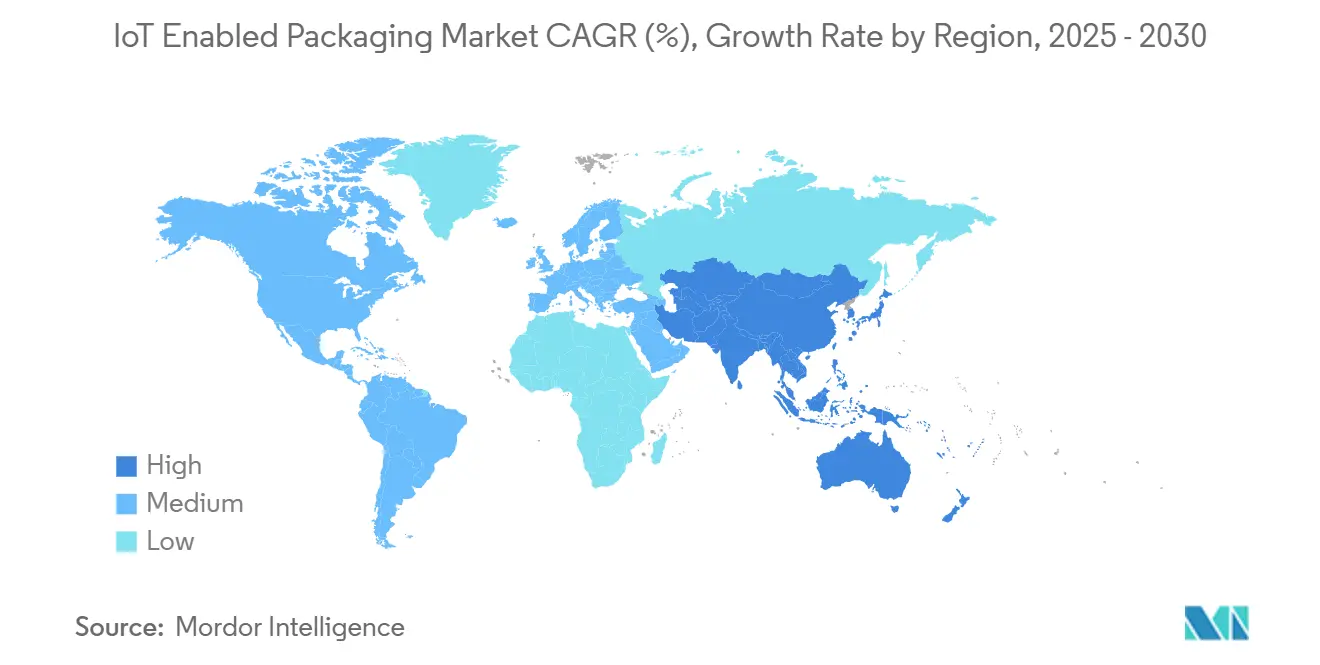
| Fastest Growing Market | Asia Pacific |
| Largest Market | North America |
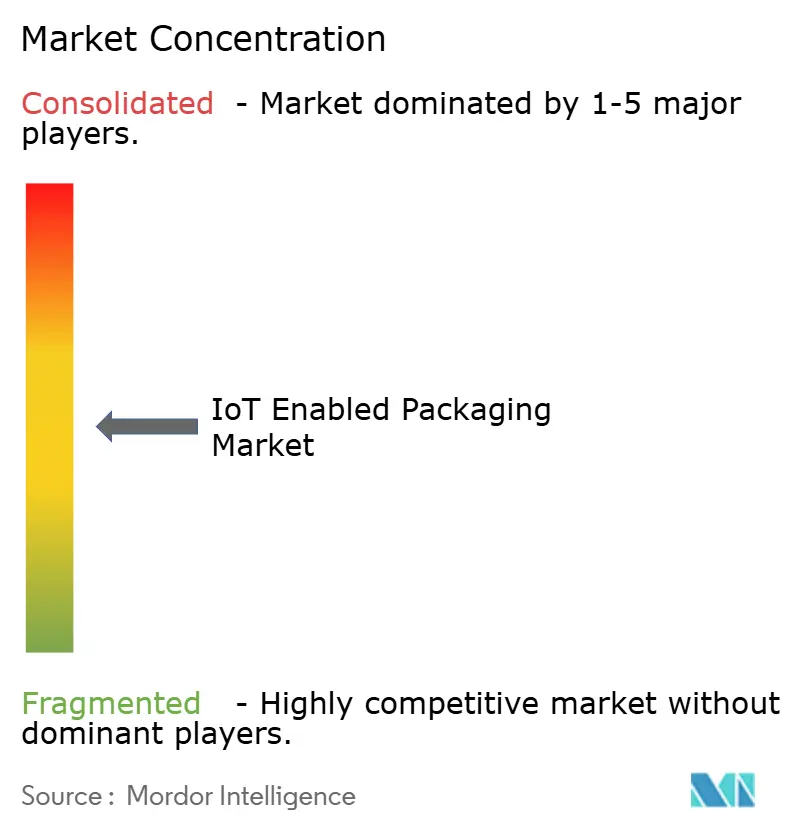
| Market Concentration | Medium |
Major Players *Disclaimer: Major Players sorted in no particular order Image © Mordor Intelligence. Reuse requires attribution under CC BY 4.0. | |
IoT Enabled Packaging Market Analysis by Mordor Intelligence
The IoT enabled packaging market size is projected to reach USD 25.32 billion by 2030, reflecting a 6.18% CAGR from USD 18.76 billion in 2025. Smart labels, sensors, and cloud analytics are becoming embedded in packaging, converting boxes, bottles, and pallets into data-generating assets that streamline inventory accuracy, reduce shrinkage, and support real-time sustainability reporting. Adoption accelerates where regulatory pressure overlaps with e-commerce growth, particularly in the food, pharmaceutical, and premium cosmetics sectors. Energy-harvesting RFID tags and smartphone-scannable QR codes lower hardware costs, while predictive analytics platforms turn raw signals into actionable insights.[1]IEEE, “RFID Technology and Applications,” ieeexplore.ieee.org Competitive differentiation now rests on linking packaging intelligence with enterprise resource planning and blockchain-based traceability.
Key Report Takeaways
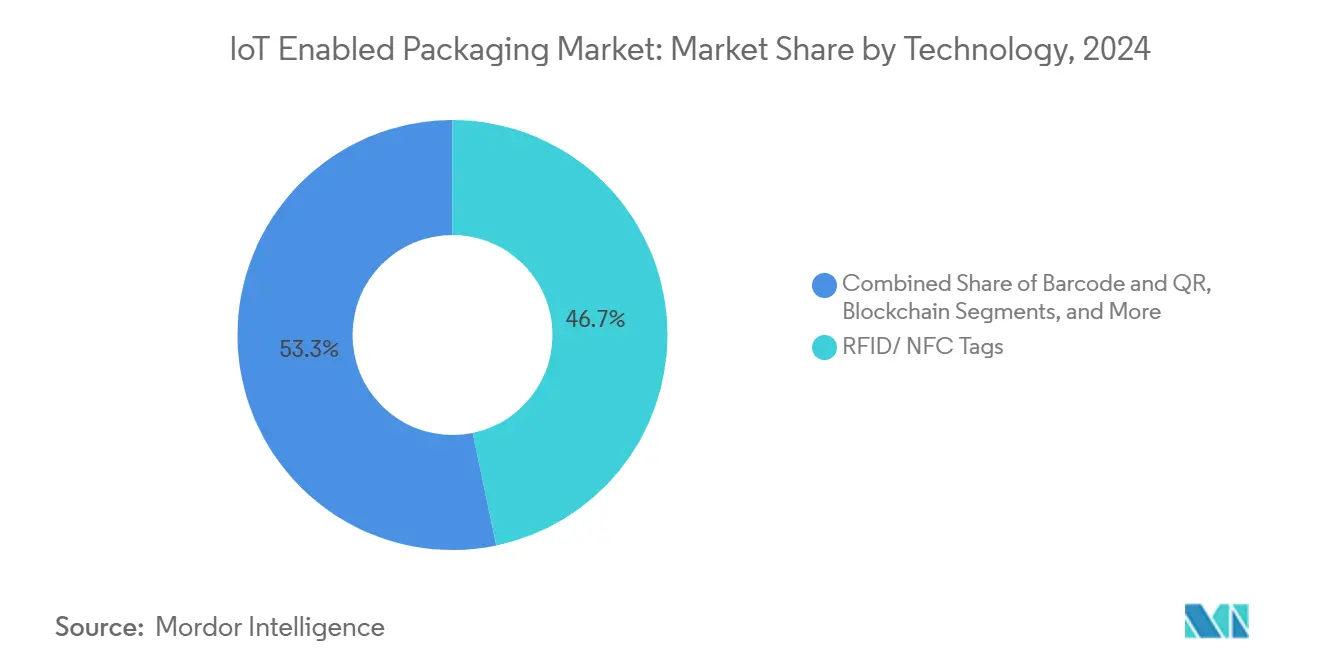
- By technology, the RFID/NFC tags captured 46.74% of the IoT enabled packaging market share in 2024.
- By end-user industry, the IoT enabled packaging market for personal care and cosmetics is projected to grow at a 7.93% CAGR between 2025–2030.
- By packaging format, the secondary packaging segment captured 28.39% of the IoT enabled packaging market share in 2024.
- By geography, IoT enabled packaging market for Asia-Pacific is projected to grow at an 8.31% CAGR between 2025–2030.
Global IoT Enabled Packaging Market Trends and Insights
Drivers Impact Analysis*
| Driver | (~) % Impact on CAGR Forecast | Geographic Relevance | Impact Timeline |
|---|---|---|---|
| Supply-chain visibility and traceability demand | +1.8% | Global, early adoption in North America and Europe | Medium term (2–4 years) |
| Regulatory push for anti-counterfeiting and food-pharma safety | +1.5% | Europe core, expanding to North America and Asia-Pacific | Long term (≥ 4 years) |
| E-commerce growth driving real-time inventory accuracy | +1.2% | Global, concentrated in urban markets | Short term (≤ 2 years) |
| Energy-harvesting smart labels removing battery costs | +0.9% | Asia-Pacific manufacturing hubs, spill-over global | Medium term (2–4 years) |
| Mandatory digital product passport proposals | +0.7% | Immediate in Europe, 2-year lag in United States | Long term (≥ 4 years) |
| Cold-chain ESG scoring by insurers | +0.4% | North America and Europe premium segments | Medium term (2–4 years) |
| Source: Mordor Intelligence | |||
Supply-chain visibility and traceability demand
Businesses shift from reactive to predictive logistics, embedding sensors and unique identifiers into every case or pallet. Retailers now require end-to-end visibility that tracks location, temperature, and authentication in real-time, forcing suppliers to retrofit or redesign packaging with connected tags. Pharmaceutical and food companies lead adoption as they face stringent audits and recall penalties. The European Commission’s timber regulation illustrated the speed at which digital traceability can become an industry standard. Growing geopolitical disruptions further underline the value of granular, package-level data for contingency planning.
Regulatory push for anti-counterfeiting and food-pharma safety
The European Medicines Agency’s falsified medicines directive and the United States FDA’s Food Safety Modernization Act require tamper-evident seals and serialized identifiers that prevent diversion and ensure patient safety.[2]U.S. FDA, “Food Safety Modernization Act,” fda.gov Luxury spirits, cosmetics, and infant nutrition brands follow suit, embedding NFC or QR codes that allow consumers to verify authenticity with a smartphone scan. Because non-compliance attracts both fines and brand damage, demand remains resilient even during economic slowdowns.
E-commerce growth driving real-time inventory accuracy
Same-day fulfillment leaves no room for stock-level discrepancies. Marketplace operators deploy IoT-enabled cartons that update inventory counts each time a unit is moved, eliminating the need for human scans and reducing shrinkage. Amazon’s internal rollouts demonstrated that item-level visibility reduces dock-to-door lead times and enhances customer trust. Urban micro-fulfillment centers replicate these gains, accelerating uptake in densely populated regions.
Energy-harvesting smart labels removing battery costs
Next-generation tags harness ambient RF, thermal, or mechanical energy, eliminating the need for battery replacements that previously made large-scale rollouts uneconomical. Apparel, beverage, and electronics brands are now trialing perpetual-power labels priced under USD 0.10, enabling billions of disposable packages to transmit data from factory to consumer. The environmental benefits of not disposing of lithium reinforce corporate net-zero pledges.
Restraints Impact Analysis*
| Restraint | (~) % Impact on CAGR Forecast | Geographic Relevance | Impact Timeline |
|---|---|---|---|
| High up-front integration and hardware costs | -1.4% | Global, acute in price-sensitive segments | Short term (≤ 2 years) |
| Data-privacy and cybersecurity concerns | -0.8% | Europe and North America regulatory focus | Medium term (2–4 years) |
| Electronic-waste recycling bottlenecks for smart labels | -0.6% | Europe environmental regulations, expanding globally | Long term (≥ 4 years) |
| RF spectrum interference in high-density urban warehousing | -0.3% | Urban centers in developed markets | Medium term (2–4 years) |
| Source: Mordor Intelligence | |||
High up-front integration and hardware costs
The total cost of ownership encompasses hardware, middleware, analytics, and workforce training. Small manufacturers struggle to justify investments that front-load expenses while payback arrives gradually. Retrofitting legacy production lines often demands prolonged downtime and specialist engineering. Declining silicon prices and open APIs are easing the burden, yet cost remains the most immediate barrier.
Data-privacy and cybersecurity concerns
Every connected package extends the attack surface. Regulators enforce privacy-by-design rules under GDPR, compelling companies to encrypt identifiers, anonymize user data, and implement strict access controls. High-profile breaches in adjacent IoT domains heighten corporate risk aversion. Vendor roadmaps increasingly feature hardware root-of-trust solutions, over-the-air patching, and blockchain-anchored audit logs; yet, concerns continue to slow rollouts, particularly in the healthcare and defense sectors.
*Our forecasts treat driver/restraint impacts as directional, not additive. The impact forecasts reflect baseline growth, mix effects, and variable interactions.
Segment Analysis
By Technology: RFID Dominance Faces QR Innovation
RFID and NFC tags generated the largest revenue stream, accounting for 46.74% of the market share in 2024, driven by their passive operation, high read rates, and robust enterprise software ecosystems. Within this grouping, the IoT-enabled packaging market size for energy-harvesting RFID is forecasted to expand at an 8.2% CAGR, as perpetual power eliminates the need for battery swaps. Barcode and QR solutions, despite minimal data capacity, are adding the largest absolute number of connected units, thanks to universal smartphone readers and negligible printing costs. Smart sensors retain footholds in cold-chain and condition-monitoring niches, while augmented reality labels remain exploratory. Blockchain anchors immutable logs that appeal to luxury and pharmaceutical brands seeking forensic provenance records.
Hybrid architectures emerge, embedding multiple identifiers in one label, such as RFID for logistics, QR for consumer engagement, and environmental sensors for condition tracking. Cloud-based AI platforms ingest these heterogeneous signals and issue alerts, recalls, or marketing prompts in near real time. Shrinking chip dies and printable antennas enable RFID to transition from cartons to individual vials or sachets. Vendors also exploit the low latency of 5G and edge computing to localize decision-making, shifting analytics closer to the point of capture and reducing bandwidth costs.


By End-user Industry: Food Leadership Challenged by Beauty Innovation
Food and beverage commanded 22.56% of 2024 revenue, driven by stringent traceability mandates and the financial risk of spoilage. Digitized cold-chain lanes apply time-temperature integrators and location beacons that support insurance underwriting tied to ESG performance. In contrast, personal care and cosmetics are the fastest-growing vertical, expanding at a 7.93% CAGR, as counterfeit-prone premium SKUs embed NFC tags that enable shoppers to verify authenticity using mobile apps. Pharmaceuticals remain heavily regulated, relying on serialized labels to track packages across national borders under the Drug Supply Chain Security Act.
high-value vials or serum bottles necessitate complex, multi-sensor labels, whereas canned beverages utilize low-cost QR codes. Cross-industry sustainability reporting aligns adoption incentives, since lifecycle data gathered for safety also underpins carbon accounting. E-commerce adds urgency, demanding last-mile proof of authenticity and condition. Cosmetics brands pilot refillable, tagged containers that support circular models and capture consumer usage metrics for hyper-personalized marketing.
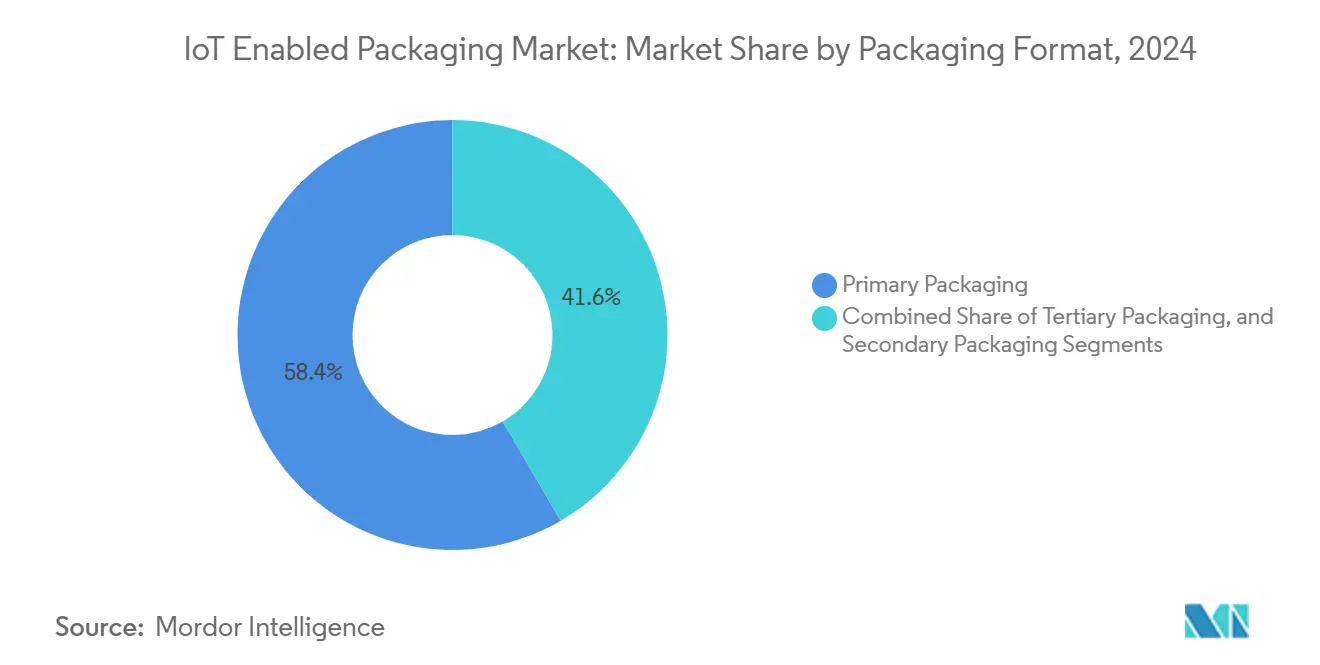
By Packaging Format: Secondary Leads While Primary Accelerates
Primary packaging accounted for 58.39% of 2024 revenue by offering ample surface area for antennas and batteries, and by aligning naturally with logistics workflows, such as pallet-level RFID scanning. However, Secondary packaging is growing at the fastest rate, with a 7.56% CAGR, spurred by micro-electronics that fit onto bottle caps, blister packs, or sachet film. IoT-enabled packaging market share for primary packs is expected to rise as brands value direct consumer interaction and regulators insist on unit-level traceability in pharmaceuticals.
Miniaturization drives format shift: printed electronics on flexible substrates now fold into curved glass or squeeze tubes without impairing aesthetics. Primary formats also enable in-use monitoring, capturing events such as opening, dosage adherence, or product reconstitution data. Tertiary pallets integrate heavier power-hungry gateways that collate downstream data and relay it to warehouse management systems, underpinning robotic picking and automated stock reconciliation.
Geography Analysis
North America generated the highest revenue in 2024, accounting for 41.27% of global sales. Early mandates for pharmaceutical serialization and retailer compliance programs created fertile ground for the rapid adoption of these initiatives. Venture funding and an extensive network of systems integrators shorten deployment cycles. Walmart and other big-box chains require tag compatibility at both the pallet and item levels, which helps anchor domestic demand.
The Asia-Pacific region is expected to contribute the largest incremental revenue through 2030, expanding at an 8.31% CAGR. Dense manufacturing clusters enable the insertion of smart features during production, thereby reducing retrofit costs. National initiatives, such as China’s Made in China 2025 and India’s Digital India, allocate subsidies and favorable tax terms to IoT deployments. Consumers in urban China and Southeast Asia increasingly rely on mobile-first interactions, prompting brands to incorporate QR and NFC engagement layers.[3]China MIIT, “Industrial Internet Policy,” miit.gov.cn The region also exports IoT-ready packages to Western markets, multiplying demand.
Europe remains the regulatory pace-setter. The digital product passport framework mandates serial identifiers and lifecycle data capture for textiles, batteries, and electronics. These rules lock in steady investment irrespective of macro-economic swings. GDPR compliance, although it adds cost, encourages vendors to adopt privacy-by-design architectures, ultimately strengthening their market credibility. Scandinavian and Benelux countries trial blockchain-based deposit return schemes, demonstrating the circular economy potential of connected packages.

Competitive Landscape
Competition is moderately fragmented. Amcor and Avery Dennison scale production of smart labels by leveraging established converting lines and global distribution. They integrate sensors and cloud dashboards through in-house development and selective acquisitions. Impinj dominates RAIN RFID reader silicon and has recently acquired Wiliot’s energy-harvesting IP, positioning the pair at the forefront of battery-free innovation. Zebra Technologies partners with Microsoft Azure to embed analytics engines that predict spoilage or theft before it occurs.
Specialist start-ups, such as Thin Film Electronics and PragmatIC Semiconductor, print low-cost, flexible chips aimed at the high-volume consumer packaged goods segment. Meanwhile, converters like CCL Industries and Smartrac offer turnkey services combining label fabrication, encoding, and data-platform onboarding. Patent activity focuses on energy harvesting, secure cryptographic protocols, and eco-friendly substrates. As margins tighten, the industry anticipates consolidation, with packaging majors likely to acquire analytics or semiconductor talents to own the full stack from substrate to software.
Strategic moves in 2025 illustrate this trend. Avery Dennison released perpetual-power RFID for frozen foods, while 3M set aside USD 150 million to scale tamper-evident label production. Impinj spent USD 200 million on Wiliot’s portfolio, merging battery-free tags with cloud orchestration. Tetra Pak piloted blockchain dairy cartons to prove farm-to-table authenticity, signaling a shift toward distributed ledgers as trust anchors.
IoT Enabled Packaging Industry Leaders
Amcor plc
Avery Dennison Corporation
Stora Enso Oyj
Sealed Air Corporation
3M Company
- *Disclaimer: Major Players sorted in no particular order

Recent Industry Developments
- October 2025: Avery Dennison launched next-generation battery-free RFID tags incorporating ambient RF energy harvesting for high-volume food applications.
- September 2025: 3M announced a USD 150 million expansion of smart label manufacturing for pharmaceutical and food safety lines.
- August 2025: Impinj completed its USD 200 million acquisition of Wiliot’s energy-harvesting technology portfolio.
- May 2025: Smartrac Technology received ISO 27001 certification for its IoT packaging data security protocols.


Global IoT Enabled Packaging Market Report Scope
| RFID/ NFC Tags |
| Smart Sensors |
| Augmented Reality |
| Barcode and QR |
| Blockchain |
| Cloud-Based and AI Analytics |
| Food and Beverage |
| Pharmaceuticals and Healthcare |
| Personal Care and Cosmetics |
| Logistics and Transport |
| Other End-user Industries |
| Primary Packaging |
| Secondary Packaging |
| Tertiary Packaging |
| North America | United States | |
| Canada | ||
| Mexico | ||
| South America | Brazil | |
| Argentina | ||
| Chile | ||
| Rest of South America | ||
| Europe | United Kingdom | |
| Germany | ||
| France | ||
| Italy | ||
| Spain | ||
| Russia | ||
| Rest of Europe | ||
| Asia-Pacific | China | |
| India | ||
| Japan | ||
| South Korea | ||
| Australia | ||
| Rest of Asia-Pacific | ||
| Middle East and Africa | Middle East | Saudi Arabia |
| United Arab Emirates | ||
| Turkey | ||
| Rest of Middle East | ||
| Africa | South Africa | |
| Nigeria | ||
| Rest of Africa | ||
| By Technology | RFID/ NFC Tags | ||
| Smart Sensors | |||
| Augmented Reality | |||
| Barcode and QR | |||
| Blockchain | |||
| Cloud-Based and AI Analytics | |||
| By End-user Industry | Food and Beverage | ||
| Pharmaceuticals and Healthcare | |||
| Personal Care and Cosmetics | |||
| Logistics and Transport | |||
| Other End-user Industries | |||
| By Packaging Format | Primary Packaging | ||
| Secondary Packaging | |||
| Tertiary Packaging | |||
| By Geography | North America | United States | |
| Canada | |||
| Mexico | |||
| South America | Brazil | ||
| Argentina | |||
| Chile | |||
| Rest of South America | |||
| Europe | United Kingdom | ||
| Germany | |||
| France | |||
| Italy | |||
| Spain | |||
| Russia | |||
| Rest of Europe | |||
| Asia-Pacific | China | ||
| India | |||
| Japan | |||
| South Korea | |||
| Australia | |||
| Rest of Asia-Pacific | |||
| Middle East and Africa | Middle East | Saudi Arabia | |
| United Arab Emirates | |||
| Turkey | |||
| Rest of Middle East | |||
| Africa | South Africa | ||
| Nigeria | |||
| Rest of Africa | |||


Key Questions Answered in the Report
How large is the IoT enabled packaging market in 2025?
The market is valued at USD 18.76 billion in 2025 and is forecast to grow at a 6.18% CAGR.
Which technology leads current adoption?
RFID and NFC tags hold 46.74% of 2024 revenue, favored for passive operation and enterprise-grade data capacity
What region offers the fastest growth?
Asia-Pacific is expanding at 8.31% CAGR through 2030, driven by manufacturing density and supportive government policies.
Why are energy-harvesting labels important?
They remove battery costs, allowing perpetual operation that unlocks high-volume, low-margin applications.
What is the main barrier to adoption?
High up-front integration and hardware costs remain the most significant restraint, lowering the forecast CAGR by 1.4%.
Which end-user segment is accelerating fastest?
Personal care and cosmetics is growing at a 7.93% CAGR, as premium brands deploy smart labels for anti-counterfeiting and consumer engagement.
Page last updated on:


