Satellite Internet Market Size and Share
Market Overview
| Study Period | 2020 - 2031 |
|---|---|
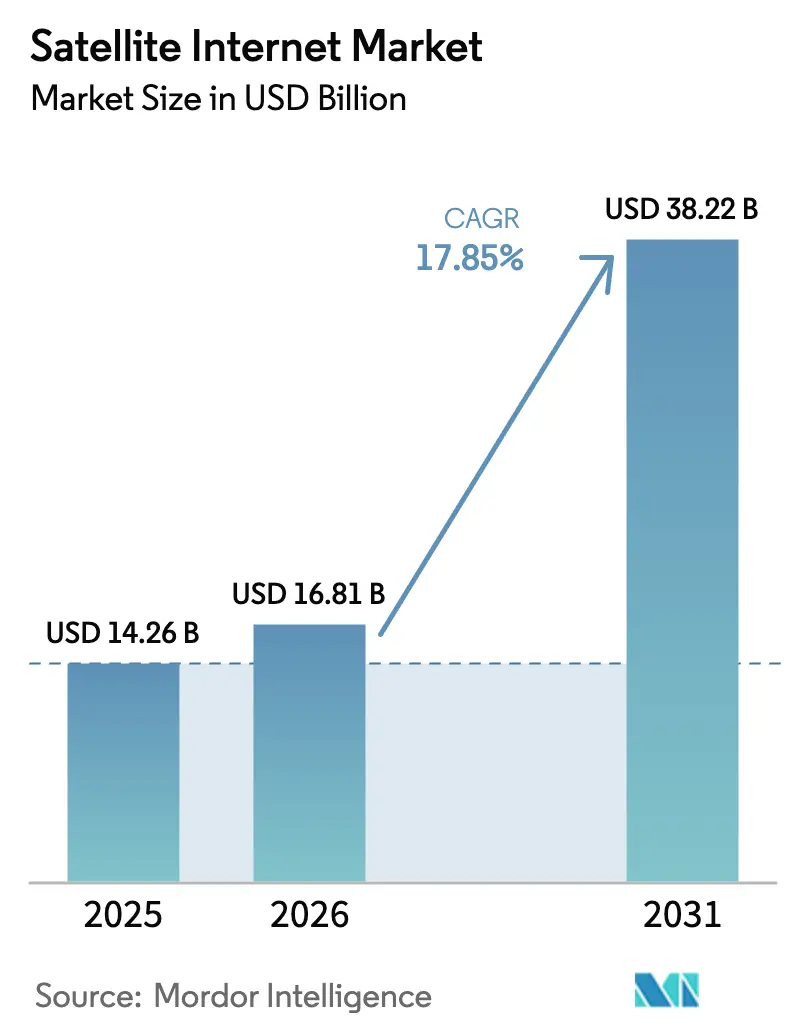
| Market Size (2026) | USD 16.81 Billion |
| Market Size (2031) | USD 38.22 Billion |
| Growth Rate (2026 - 2031) | 17.85% CAGR |
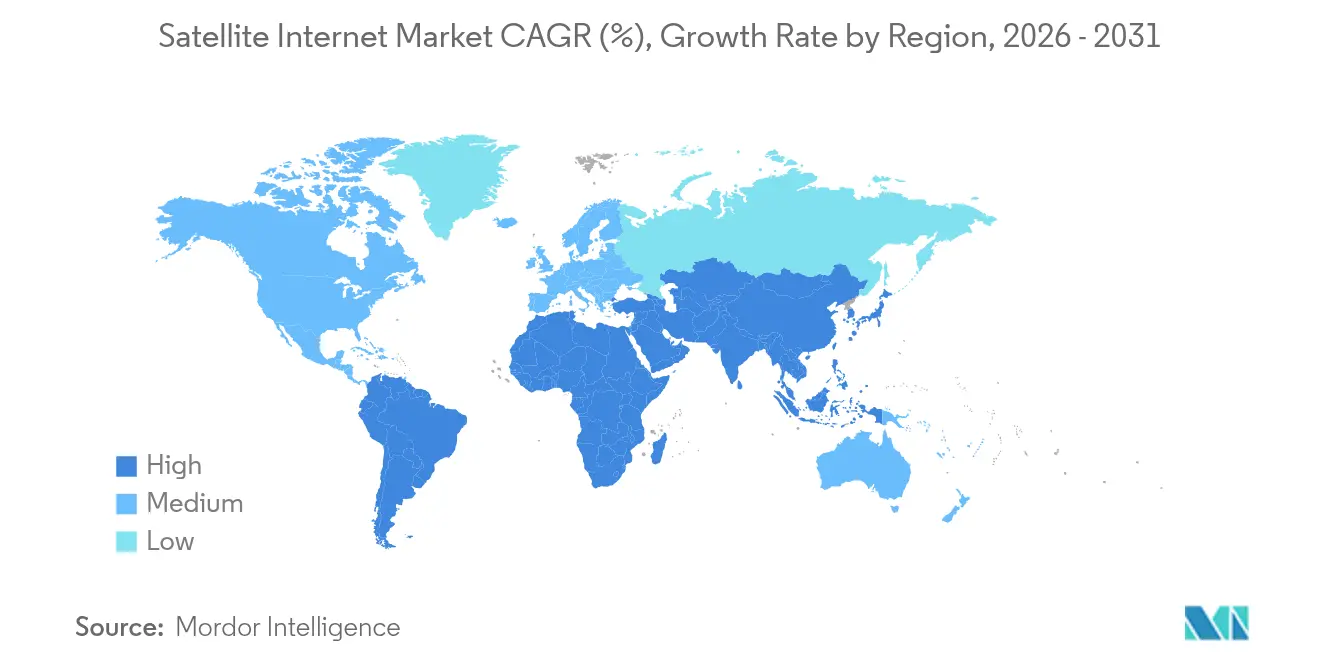
| Fastest Growing Market | Asia Pacific |
| Largest Market | North America |
| Market Concentration | Medium |
Major Players *Disclaimer: Major Players sorted in no particular order Image © Mordor Intelligence. Reuse requires attribution under CC BY 4.0. | |
Satellite Internet Market Analysis by Mordor Intelligence
The satellite internet market size is expected to grow from USD 14.26 billion in 2025 to USD 16.81 billion in 2026 and is forecast to reach USD 38.22 billion by 2031 at 17.85% CAGR over 2026-2031. Momentum stems from falling launch and manufacturing costs for low-Earth-orbit (LEO) constellations, rural-digitization mandates that bring public subsidies into play, and enterprise demand for always-on connections that bypass terrestrial last-mile bottlenecks. Operators are shifting investment from geostationary (GEO) systems toward multi-orbit networks that blend LEO, medium-Earth-orbit (MEO) and GEO assets to balance latency, coverage and cost. Hardware miniaturization and vertically integrated launch services have driven terminal and bandwidth prices lower, opening previously uneconomical markets. At the same time, regulatory clarity in major economies and large procurement programs from defense and aviation customers validate satellite internet as core infrastructure rather than niche back-up connectivity.
Key Report Takeaways
- By frequency band, Ka-Band led with 31.25% revenue share in 2025 and is projected to expand at an 18.22% CAGR through 2031.
- By connectivity type, two-way service held 51.05% of the satellite internet market share in 2025 and is forecast to grow at 17.35% CAGR to 2031.
- By end-user industry, the commercial and enterprise segment captured 53.60% share in 2025, whereas the residential segment is expected to post the fastest 18.15% CAGR through 2031.
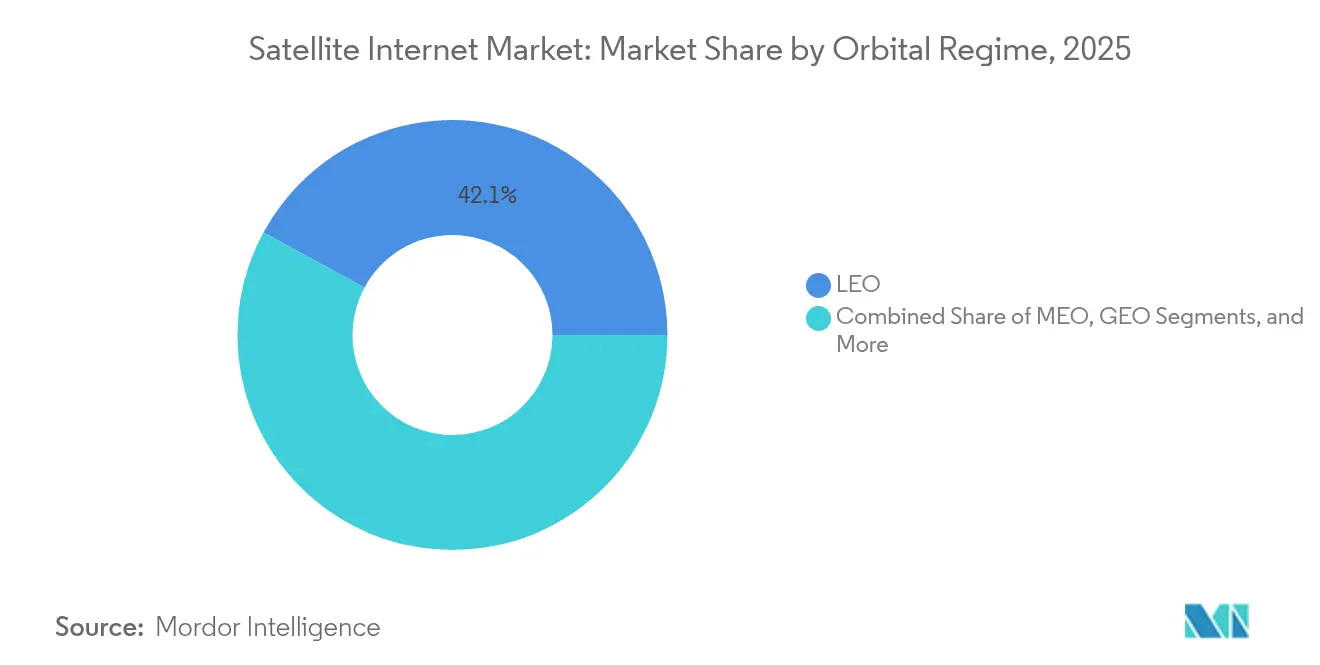
- By orbital regime, LEO constellations accounted for 42.10% share in 2025 and remain the fastest-growing segment at 18.05% CAGR.
- By application, backhaul and rural cell-site connectivity represented 37.90% share in 2025; mobility applications are set to climb at 18.52% CAGR.
- By geography, North America held 34.20% share in 2025, while Asia-Pacific is poised to deliver the highest 18.50% CAGR through 2031.
Note: Market size and forecast figures in this report are generated using Mordor Intelligence’s proprietary estimation framework, updated with the latest available data and insights as of 2026.
Global Satellite Internet Market Trends and Insights
Drivers Impact Analysis*
| Driver | (~) % Impact on CAGR Forecast | Geographic Relevance | Impact Timeline |
|---|---|---|---|
| Accelerated LEO-launch cadence cuts capacity costs | +3.2% | Global, with concentration in North America and Asia-Pacific | Medium term (2-4 years) |
| Government rural-digitization subsidies | +2.8% | North America, Europe, emerging Asia-Pacific markets | Short term (≤ 2 years) |
| In-flight connectivity demand surge | +2.1% | Global, led by North America and Europe routes | Medium term (2-4 years) |
| Direct-to-device (D2D) satellite-smartphone alliances | +2.5% | North America, expanding to global markets | Medium term (2-4 years) |
| Cloud-edge partnerships with hyperscalers (AWS, Azure) | +1.9% | Global, enterprise-focused regions | Long term (≥ 4 years) |
| Maritime ESG compliance pushing satellite IoT adoption | +1.4% | Global maritime routes, EU regulatory focus | Long term (≥ 4 years) |
| Source: Mordor Intelligence | |||
Accelerated LEO-Launch Cadence Cuts Capacity Costs
Weekly Falcon 9 launches and reusable boosters have lifted annual global satellite deployments by more than 70% since 2018, driving dramatic per-bit cost compression. Starlink’s V3 spacecraft now deliver around 1 Tbps throughput with sub-5 ms latency, enabling price points that undercut many rural fiber offerings. Amazon’s Project Kuiper joined the fray in April 2025, targeting 3,236 satellites by 2029, further intensifying capacity and price competition. Economies of scale in both manufacturing and launch create a feedback loop: larger constellations lower costs, which in turn unlock new addressable markets and justify even larger fleets.
Government Rural-Digitization Subsidies
Federal broadband programs such as USDA ReConnect and NTIA-administered BEAD funnel multi-billion-dollar grants toward hard-to-serve regions, guaranteeing baseline demand for satellite operators. Similar mandates in India and Indonesia treat satellite capacity as essential public utility, changing the risk-reward profile of rural deployment. Public tenders specify speed, latency and reliability targets that push vendors to upgrade networks, accelerating diffusion of high-throughput Ka-Band satellites.
In-Flight Connectivity Demand Surge
United Airlines, Air France and other carriers now treat broadband as core to passenger experience and operational analytics. LEO constellations beat traditional GEO systems on latency, enabling real-time VPN, video-conferencing and predictive maintenance applications at cruising altitude. Equipment vendors such as EchoStar supply dual Ka/Ku terminals that simplify retrofits across mixed fleets, encouraging rapid airline roll-outs.
Direct-to-Device Satellite-Smartphone Alliances
T-Mobile’s pact with Starlink and AT&T’s deal with AST SpaceMobile integrate satellite links directly into standard 5G handsets, erasing the need for external terminals. Regulatory approval of supplemental-coverage-from-space rules in the United States shows interference can be managed within existing mobile spectrum allocations, paving the way for global expansion. Long-term supply agreements give operators revenue visibility that supports constellations sized for mass-market mobile traffic rather than niche satellite phone demand.
Restraints Impact Analysis*
| Restraint | (~) % Impact on CAGR Forecast | Geographic Relevance | Impact Timeline |
|---|---|---|---|
| Ground-terminal hardware remains price-elastic | -2.1% | Global, particularly price-sensitive emerging markets | Short term (≤ 2 years) |
| National spectrum-auction uncertainty (India, Brazil) | -1.8% | India, Brazil, other emerging markets with unclear regulatory frameworks | Medium term (2-4 years) |
| Orbital-debris mitigation capex – under-reported | -1.2% | Global, affecting all LEO operators | Long term (≥ 4 years) |
| Solar-cycle-driven drag risk for LEO constellations – under-reported | -0.9% | Global LEO operations, particularly lower altitude orbits | Medium term (2-4 years) |
| Source: Mordor Intelligence | |||
Ground-Terminal Hardware Remains Price-Elastic
A USD 499–599 outlay for a standard Starlink dish and as much as USD 2,500 for performance models still represents a significant hurdle in low-income regions. Subsidy schemes help, yet operators risk negative gross margins where monthly service fees cannot amortize hardware within an 18-month payback window. Limited component suppliers and ruggedized design requirements slow the cost-down curve compared with consumer electronics, delaying mass adoption in price-sensitive segments.
National Spectrum-Auction Uncertainty
Regulators in growth markets continue to debate fee models and interference protocols for non-geostationary satellite operators. India’s proposal to apply a 4% adjusted gross-revenue levy introduced new cost variables, while Brazil’s evolving auction design leaves unanswered questions on coexistence between terrestrial and satellite services. Absent harmonized rules, operators face fragmented licensing processes, longer lead times and higher compliance costs that weigh on deployment schedules.
*Our forecasts treat driver/restraint impacts as directional, not additive. The impact forecasts reflect baseline growth, mix effects, and variable interactions.
Segment Analysis
By Frequency Band: Ka-Band Consolidates Leadership
Ka-Band captured 31.25% of the satellite internet market share in 2025 and benefits from per-Mbps pricing that runs roughly half that of Ku-Band alternatives. Additional 28 GHz spectrum cleared by the FCC in 2024 expanded usable capacity, easing congestion risks for enterprise and aviation users . Demand concentrates in applications that value high throughput, such as cloud backhaul and in-flight Wi-Fi, reinforcing Ka-Band’s economies of scale.
Competition persists as specialized bands such as C-, L- and X-Band retain footholds in defense, maritime and safety-critical links. Even so, K-Band—the fastest-growing slice—will account for the bulk of new capacity, with next-generation satellites using digital beam-forming to lift spectral efficiency. As legacy users weigh migration costs against higher data rates, operators are phasing in dual-band payloads that ease the transition without compromising service continuity.


By Connectivity Type: Two-Way Services Dominate
Two-way links held 51.05% share in 2025 and are projected to grow at 17.35% CAGR, reflecting a wholesale pivot toward interactive cloud workflows and video uplink requirements. Real-time collaboration, tele-engineering and IoT telemetry have minimal tolerance for asymmetric bandwidth. The satellite internet market size for two-way services is forecast to increase sharply as enterprises integrate LEO gateways into software-defined wide-area networks.
Broadcast and one-way receive models persist in narrow niches such as maritime weather feeds, yet their unit economics weaken when compared with declining duplex prices. Hybrid architectures that toggle between unicast and multicast traffic emerge as interim solutions, particularly where operators want to sweat legacy GEO assets while ramping LEO capacity.
By End-User Industry: Enterprises Anchor Revenue
Commercial and enterprise users commanded 53.60% share in 2025, underlining satellite’s shift from consumer novelty to mission-critical backbone. Banks, oil majors and cloud providers are procuring managed satellite SD-WAN links as insurance against terrestrial outages. The residential segment will nonetheless post the fastest 18.15% CAGR as government vouchers subsidize terminals, expanding the satellite internet market size for rural households.
Government and defense spending remains steady, buoyed by the Pentagon’s USD 13 billion commercial capacity program that secures multi-orbit bandwidth for tactical networks. Maritime operators adopt satellite IoT to meet carbon-intensity reporting rules, while airlines weigh subscription-based passenger Wi-Fi models that convert connectivity from cost center to ancillary revenue stream.
By Orbital Regime: LEO Sets the Performance Benchmark
LEO satellites delivered 42.10% share in 2025 and will widen the gap courtesy of 18.05% CAGR. Latency under 30 ms enables applications such as multiplayer gaming and real-time trading formerly impossible on GEO links. The satellite internet industry also sees hybrid designs that blend GEO-wide beams for broadcast with LEO spot beams for low-latency tasks, letting operators optimize traffic without duplicating ground infrastructure.
MEO craft serve mid-latency markets like enterprise backup, while classic GEO remains economically attractive for video distribution over large footprints. Constellation operators face fresh challenges in orbital-debris avoidance and replacement planning during periods of heightened solar activity, prompting investment in propulsion upgrades and automated collision-avoidance software.
By Application: Backhaul Extends Terrestrial Footprint
Backhaul and rural cell-site connectivity owned 37.90% share in 2025 as mobile network operators leveraged satellites to sidestep fiber roll-out costs in low-density areas. Here, the satellite internet market size is expected to climb steadily, driven by 5G coverage mandates that outstrip terrestrial economics. Multi-orbit managed services guarantee quality-of-service even when individual links fade, delivering carrier-grade uptime.
Mobility leads growth at 18.52% CAGR as airlines, merchant shipping and land transport sectors converge on the need for high-bandwidth telemetry and passenger services. Emergency responders integrate satellite back-up into disaster-recovery plans, capitalizing on the technology’s independence from ground-based assets. Enterprise cloud-access packages bundle satellite and terrestrial links into single subscriptions, simplifying procurement and compliance.
Geography Analysis
North America retained 34.20% share in 2025 thanks to clear licensing rules, well-funded public broadband programs and robust enterprise uptake. Starlink posted USD 6.6 billion revenue in 2024 on its home turf, reinforcing confidence that the satellite internet market can scale sustainably in mature economies . Federal defense and agriculture agencies lock in multi-year capacity orders, offering predictable cash flows that encourage constellation expansion.
Asia-Pacific is the fastest-expanding region at an 18.50% CAGR to 2031. Geographic fragmentation in Indonesia and the Philippines makes terrestrial fiber uneconomic, while ChinaSat-26 and the planned ChinaSat-27 inject hundreds of gigabits of new capacity that underpins aggressive retail pricing. Partnerships such as Airtel-Starlink show telecom carriers view satellite as complementary rather than competitive, accelerating rural roll-outs across India and Southeast Asia . The region’s trajectory highlights satellite connectivity as a catalyst for digital‐economy growth.
Europe remains a stable second-tier market. Regulators emphasize digital sovereignty, channeling funding toward indigenous multi-orbit projects led by SES and Eutelsat. Regional operators also expand outward: Orange Africa teams with Eutelsat to deliver 100 Mbps links to underserved communities, showcasing European technology in emerging markets. Meanwhile, the Middle East and Africa register accelerating adoption where governments view satellite internet as a practical bridge until fiber ubiquity becomes viable.

Competitive Landscape
SpaceX’s vertically integrated model—from rocket manufacturing to user terminals—confers cost and speed advantages that translate into first-mover dominance within the satellite internet market. Traditional GEO incumbents such as Viasat (USD 4.28 billion FY 2024 revenue) and SES (USD 534 million Q1 2025 revenue) pivot toward hybrid architectures, mixing new LEO assets with their GEO fleets to defend enterprise accounts [3]Viasat Investor Relations, “FY 2024 Annual Report,” viasat.com. Their legacy ground infrastructure and long-standing government ties offer near-term insulation but demand heavy capital to stay competitive.
Disruptors bring differentiated strategies. Amazon’s Project Kuiper leans on cloud integration and enterprise channels, while AST SpaceMobile focuses on direct-to-device mobile broadband. Consolidation accelerates: SES’s pending USD 3.1 billion Intelsat acquisition and EchoStar’s merger with DISH Network aim to pool spectrum, teleports and customer bases for scale economics. The FCC’s 17.3–17.8 GHz band allocation to non-geostationary operators underscores regulatory intent to foster competition while ensuring coordination.
White-space opportunities persist. Maritime ESG reporting requirements spur uptake of satellite IoT services, aviation looks to monetize passenger Wi-Fi, and enterprises demand cloud-grade latency in remote locations. Vendors able to package managed services across multiple orbits and frequencies are best positioned to capture these adjacent revenue pools.
Satellite Internet Industry Leaders
Viasat, Inc.
Hughes Network Systems, LLC
SES S.A.
Intelsat S.A.
Starlink (SpaceX)
- *Disclaimer: Major Players sorted in no particular order

Recent Industry Developments
- May 2025: Airtel announced agreements with SpaceX to bring Starlink services to customers in India and Africa, expanding satellite coverage in emerging markets.
- April 2025: Amazon launched its first operational Project Kuiper satellite, kicking off deployment of a planned 3,236-satellite constellation.
- March 2025: Orange Africa and Eutelsat formed a strategic partnership to deliver up-to-100 Mbps satellite broadband across Africa and the Middle East.
- January 2025: Intelsat and GCI deepened their Alaska collaboration by adding multi-orbit capacity to existing services.


Global Satellite Internet Market Report Scope
Satellite internet is a wireless connection spread across multiple satellite dishes located both on earth and in space and provide remote areas of the planet with valuable access to core networks. This keeps them connected, providing them with access to up-to-date information and communication systems.
The satellite internet market is segmented by frequency band (c-band, l-band, x-band, k-band), by connectivity (two-way service, one-way service, hybrid service), by end-user (residential, commercial, government and defense), by geography (North America, Europe, Asia-Pacific, Latin America, Middle East and Africa). The market sizes and forecasts are provided in terms of value (USD) for all the above segments.
| C-Band |
| L-Band |
| X-Band |
| Ku-Band |
| Ka-Band |
| Two-Way Service |
| One-Way Receive |
| One-Way Broadcast |
| Hybrid Service |
| Residential |
| Commercial and Enterprise |
| Government and Defense |
| Maritime |
| Aviation |
| LEO |
| MEO |
| GEO |
| Hybrid / Multi-Orbit Managed Service |
| Backhaul and Rural Cell-Site Connectivity |
| Emergency and Public Safety |
| Mobility |
| Enterprise SD-WAN / Cloud Access |
| North America | United States | |
| Canada | ||
| Mexico | ||
| South America | Brazil | |
| Argentina | ||
| Rest of South America | ||
| Europe | Germany | |
| United Kingdom | ||
| France | ||
| Italy | ||
| Spain | ||
| Russia | ||
| Rest of Europe | ||
| Asia-Pacific | China | |
| Japan | ||
| India | ||
| South Korea | ||
| Australia and New Zealand | ||
| Rest of Asia-Pacific | ||
| Middle East and Africa | Middle East | Saudi Arabia |
| United Arab Emirates | ||
| Turkey | ||
| Rest of Middle East | ||
| Africa | South Africa | |
| Nigeria | ||
| Egypt | ||
| Rest of Africa | ||
| By Frequency Band | C-Band | ||
| L-Band | |||
| X-Band | |||
| Ku-Band | |||
| Ka-Band | |||
| By Connectivity Type | Two-Way Service | ||
| One-Way Receive | |||
| One-Way Broadcast | |||
| Hybrid Service | |||
| By End-User Industry | Residential | ||
| Commercial and Enterprise | |||
| Government and Defense | |||
| Maritime | |||
| Aviation | |||
| By Orbital Regime | LEO | ||
| MEO | |||
| GEO | |||
| Hybrid / Multi-Orbit Managed Service | |||
| By Application | Backhaul and Rural Cell-Site Connectivity | ||
| Emergency and Public Safety | |||
| Mobility | |||
| Enterprise SD-WAN / Cloud Access | |||
| Geography | North America | United States | |
| Canada | |||
| Mexico | |||
| South America | Brazil | ||
| Argentina | |||
| Rest of South America | |||
| Europe | Germany | ||
| United Kingdom | |||
| France | |||
| Italy | |||
| Spain | |||
| Russia | |||
| Rest of Europe | |||
| Asia-Pacific | China | ||
| Japan | |||
| India | |||
| South Korea | |||
| Australia and New Zealand | |||
| Rest of Asia-Pacific | |||
| Middle East and Africa | Middle East | Saudi Arabia | |
| United Arab Emirates | |||
| Turkey | |||
| Rest of Middle East | |||
| Africa | South Africa | ||
| Nigeria | |||
| Egypt | |||
| Rest of Africa | |||


Key Questions Answered in the Report
What is the current worth of the satellite internet market?
The satellite internet market stands at USD 16.81 billion in 2026.
How fast is the satellite internet market expected to grow?
It is projected to expand at an 17.85% CAGR, reaching USD 38.22 billion by 2031.
Which frequency band dominates today’s satellite internet deployments?
Ka-Band leads with 31.25% revenue share in 2025 thanks to superior throughput and falling per-Mbps pricing.
Why are LEO constellations critical for future growth?
LEO fleets deliver sub-30 ms latency and scalable capacity, enabling real-time applications that traditional GEO satellites cannot support.
Page last updated on:


