
Global Interleukin Inhibitors Market Size and Share
Market Overview
| Study Period | 2020 - 2031 |
|---|---|
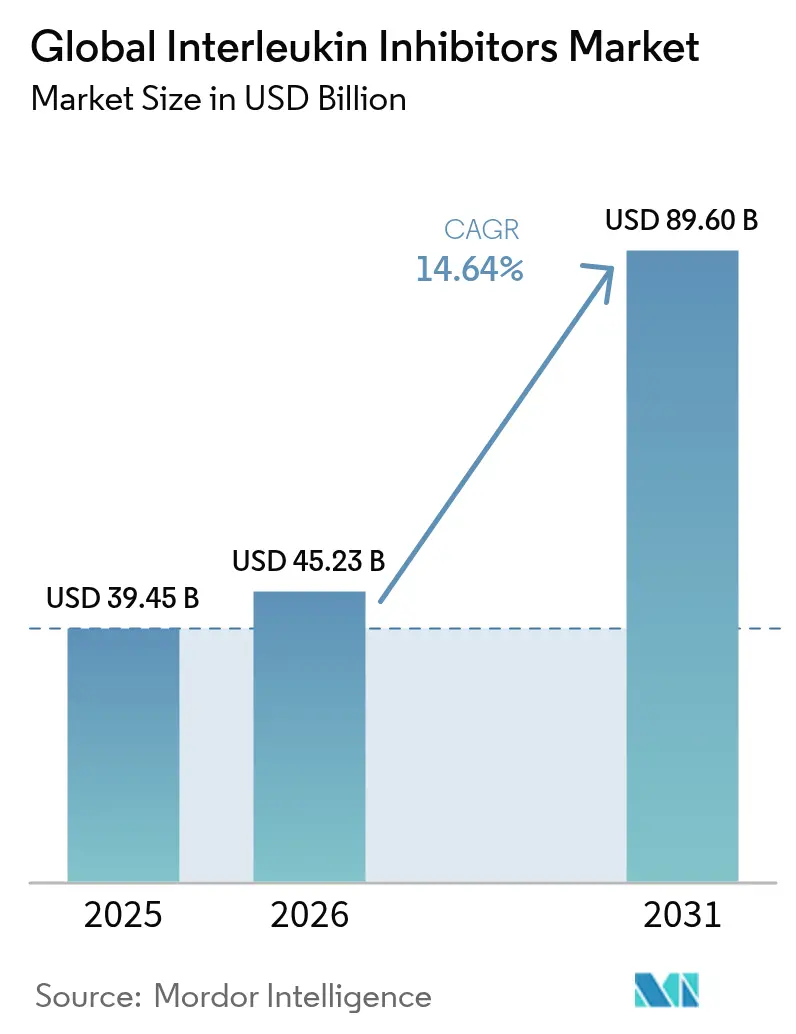
| Market Size (2026) | USD 45.23 Billion |
| Market Size (2031) | USD 89.6 Billion |
| Growth Rate (2026 - 2031) | 14.64 % |
| Fastest Growing Market | North America |
| Largest Market | Asia Pacific |
| Market Concentration | Medium |
Major Players *Disclaimer: Major Players sorted in no particular order Image © Mordor Intelligence. Reuse requires attribution under CC BY 4.0. | |
Global Interleukin Inhibitors Market Analysis by Mordor Intelligence
The interleukin inhibitors market size in 2026 is estimated at USD 45.23 billion, growing from 2025 value of USD 39.45 billion with 2031 projections showing USD 89.6 billion, growing at 14.64% CAGR over 2026-2031. This rapid expansion anchors the interleukin inhibitors market size firmly within mainstream immunology as rising autoimmune prevalence, payer alignment for targeted biologics, and next-generation pipeline approvals reinforce demand worldwide. Demand is further supported by the global increase in autoimmune conditions recorded, while biosimilar penetration, AI-assisted drug discovery, and successful COVID-19 cytokine storm indications diversify revenue streams[1]Source: AbbVie Communications, “Three Ways AI Is Changing Drug Discovery at AbbVie,” AbbVie, abbvie.com . North America remains the primary revenue hub, yet the Asia-Pacific growth engine, strengthened by improved reimbursement and local manufacturing, is narrowing the gap. Subcutaneous delivery formats dominate prescribing habits and will continue gaining share as digital-enabled autoinjectors improve adherence. Competitive intensity is heightened by the patent expiry cycle, with ustekinumab biosimilars eroding originator share and setting the stage for a broader biosimilar wave through 2030.
Key Report Takeaways
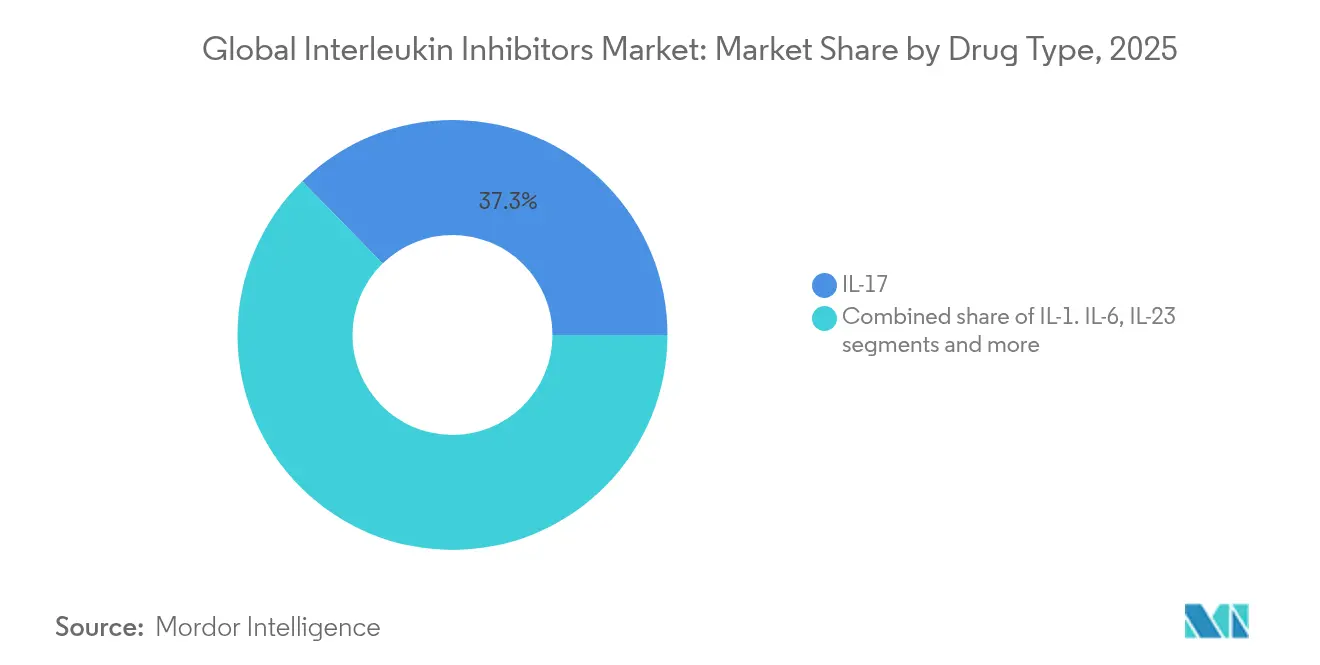
- By drug type, IL-17 inhibitors led with 37.32% revenue share in 2025; IL-23 inhibitors are forecast to expand at a 15.32% CAGR to 2031.
- By application, psoriasis captured 45.74% of the interleukin inhibitors market share in 2025, while ankylosing spondylitis is projected to advance at a 15.74% CAGR through 2031.
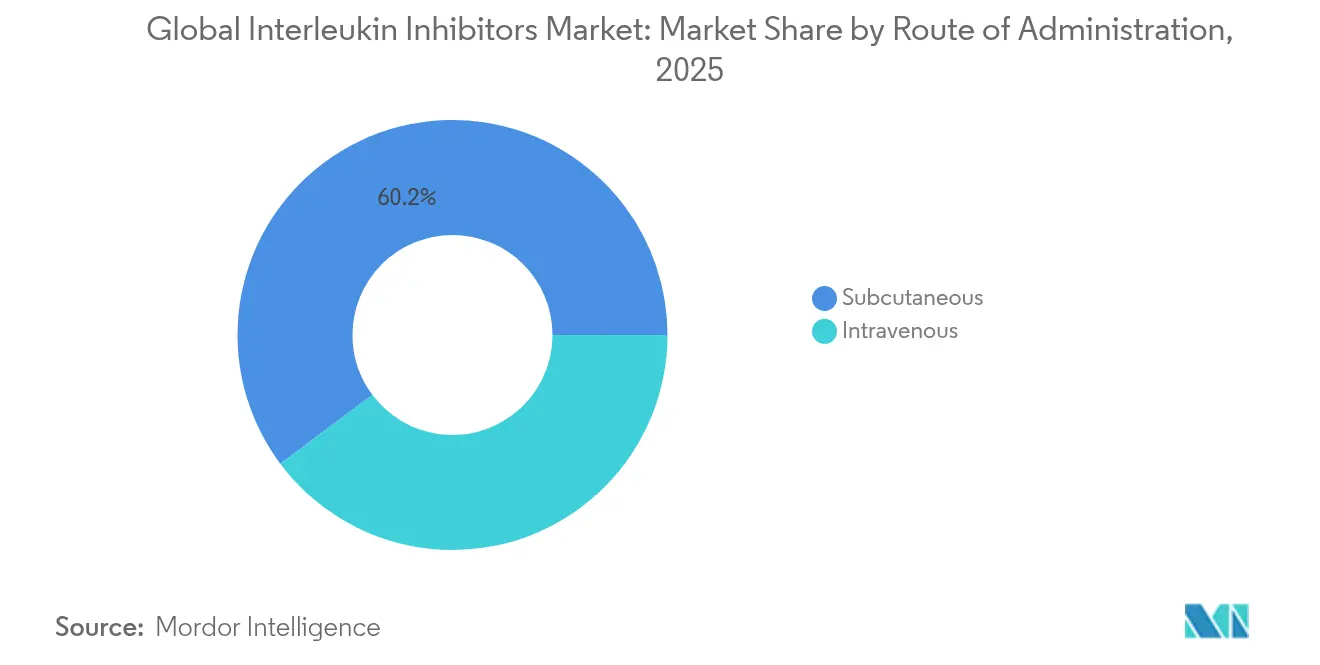
- By route of administration, subcutaneous delivery accounted for 60.21% of the interleukin inhibitors market size in 2025 and is expected to grow at a 16.05% CAGR during 2026-2031.
- By end-user, hospitals held 56.95% of 2025 revenue; home-care and self-administration programs are poised for the fastest 16.18% CAGR through 2031.
- By geography, North America commanded 41.78% of 2025 sales, while Asia-Pacific is projected to post the highest 16.42% CAGR over 2026-2031.
Note: Market size and forecast figures in this report are generated using Mordor Intelligence’s proprietary estimation framework, updated with the latest available data and insights as of 2026.
Market Trends and Insights
Drivers Impact Analysis of Global Interleukin Inhibitors Market*
| Driver | (~) % Impact on CAGR Forecast | Geographic Relevance | Impact Timeline |
|---|---|---|---|
| Escalating prevalence of autoimmune & autoinflammatory diseases | +2.8% | Global, with higher concentration in North America & Europe | Long term (≥ 4 years) |
| Accelerated FDA & EMA approvals for next-gen IL-17/IL-23 biologics | +2.1% | Global, spill-over to emerging markets | Medium term (2-4 years) |
| Shift toward convenient self-injectable formulations | +1.9% | North America & EU core, expanding to APAC | Short term (≤ 2 years) |
| Expanding reimbursement in emerging Asian markets | +1.4% | APAC core, with early gains in China, India, Japan | Medium term (2-4 years) |
| AI-enabled target discovery for novel interleukin pathways | +0.8% | Global, concentrated in US & EU research hubs | Long term (≥ 4 years) |
| Clinical success of IL inhibitors in severe COVID-19 cytokine storm | +0.6% | Global, with institutional adoption patterns | Short term (≤ 2 years) |
| Source: Mordor Intelligence | |||
Escalating Prevalence of Autoimmune & Autoinflammatory Diseases
Global autoimmune incidence has climbed, with conditions such as Graves’ disease accelerating most sharply . Higher prevalence in North America and Europe concentrates demand and drives premium pricing power. Multi-morbid presentations create complex treatment pathways that favor high-specificity biologics over broad immunosuppressants. Rheumatology and dermatology clinics report growing first-line use of interleukin inhibitors, reflecting guideline evolution. Sustained epidemiologic pressure therefore preserves the long-run revenue base of the interleukin inhibitors market.
Accelerated FDA & EMA Approvals for Next-Gen IL-17/IL-23 Biologics
Between 2024 and early 2025, regulators cleared several breakthrough assets, including bimekizumab for hidradenitis suppurativa and icotrokinra as the first oral IL-23 receptor inhibitor . Expedited review pathways shorten launch cycles and support premium introductory pricing. EMA endorsement of four ustekinumab biosimilars in 2024 demonstrates parallel confidence in class safety while intensifying price competition. Collectively, faster approvals lift physician willingness to switch within the same therapeutic class when superior convenience or efficacy is shown, boosting overall interleukin inhibitors market growth.
Shift Toward Convenient Self-Injectable Formulations
Seventy-two percent of prescriptions now specify self-administration, enabled by high-concentration autoinjectors that deliver >100 mg/mL with acceptable viscosity . Real-world adherence studies show superior persistence for subcutaneous over intravenous regimens. Digital sensors embedded in injectors generate dosing analytics that inform personalized titration and early flare detection. Payers increasingly favor home-based models because they lower infusion-center costs, fostering broader adoption and reinforcing the interleukin inhibitors market trajectory.
Expanding Reimbursement in Emerging Asian Markets
Japan, South Korea, and Taiwan cover 30-40% of Crohn’s disease patients for biologic therapy, whereas India remains under 1% due to limited insurance penetration. China’s domestic IL-17A inhibitor programs have progressed through later-stage trials, promising locally produced alternatives that will expand access while capping costs. National reimbursement extensions in Asia-Pacific therefore unlock volume gains despite price sensitivity, propelling the regional contribution to the interleukin inhibitors market.
Restraints Impact Analysis of Global Interleukin Inhibitors Market*
| Restraint | (~) % Impact on CAGR Forecast | Geographic Relevance | Impact Timeline |
|---|---|---|---|
| High acquisition cost versus small-molecule DMARDs | -1.8% | Global, with acute impact in emerging markets | Long term (≥ 4 years) |
| Looming biosimilar competition post-2026 | -1.5% | North America & EU core, expanding globally | Medium term (2-4 years) |
| Adverse infection-risk profile & black-box warnings | -1.2% | Global, with regulatory variation | Long term (≥ 4 years) |
| Payer preference shifting to step-therapy prior authorizations | -0.9% | North America core, expanding to EU | Short term (≤ 2 years) |
| Source: Mordor Intelligence | |||
High Acquisition Cost Versus Small-Molecule DMARDs
Annual biologic therapy costs run from USD 14,000 to USD 91,609, far exceeding older disease-modifying antirheumatic drugs. Out-of-pocket ceilings in low-income markets remain prohibitive, restricting uptake. Payers demand real-world cost-offset evidence, forcing manufacturers to deliver head-to-head superiority data with hard endpoints such as hospitalization avoidance. The pricing premium therefore suppresses full-potential demand for the interleukin inhibitors market in cost-sensitive geographies.
Looming Biosimilar Competition Post-2026
Fourteen ustekinumab biosimilars have entered or are queued for launch, trimming Stelara revenue year-over-year and foreshadowing similar erosion for additional agents as patent cliffs loom . Aggressive list-price discounting similar to the adalimumab experience is expected, stressing originator margins. Nonetheless, lower prices may expand overall patient reach, partially offsetting revenue loss and altering the interleukin inhibitors market competitive equilibrium.
*Our forecasts treat driver/restraint impacts as directional, not additive. The impact forecasts reflect baseline growth, mix effects, and variable interactions.
Global Interleukin Inhibitors Market Segment Analysis
By Drug Type:
IL-23 Inhibitors Drive Next-Generation GrowthIL-17 inhibitors anchored 37.32% of 2025 revenue, underpinned by durable efficacy in plaque psoriasis, psoriatic arthritis, and ankylosing spondylitis. Despite leadership, competitive breadth has intensified as bimekizumab expanded into hidradenitis suppurativa and axial spondyloarthritis. IL-23 inhibitors exhibit the fastest 15.32% CAGR because oral icotrokinra combines convenience with disease-modifying potential. Tocilizumab sustains IL-6 inhibitor relevance through COVID-19 and giant cell arteritis expansions. Niche IL-1 inhibitors cater to rare autoinflammatory syndromes, while dual-target regimens reflect a precision trend that widens addressable patient cohorts. Collectively, differentiated mechanisms diversify the interleukin inhibitors market size across drug classes, buffering against single-class risk.
The shift from parenteral to oral small-molecule IL-23 antagonists also enlarges eligible patient pools unwilling to self-inject. Pipeline innovation contains multiple multi-cytokine inhibitors aiming for broader suppression with fewer injections. Consequently, therapeutic class evolution ensures the interleukin inhibitors market retains a balanced assortment of established and emerging modalities through 2031.



By Application:
Psoriasis Leadership Faces Ankylosing Spondylitis ChallengePsoriasis delivered 45.74% of 2025 value, reinforced by clear superiority over systemic steroids and phototherapy. High skin-clearance rates such as PASI 90 attainment exceed 49.6% on oral icotrokinra, renewing enthusiasm for first-line biologic adoption. Meanwhile, ankylosing spondylitis shows 15.74% CAGR as improved MRI diagnostics broaden axial spondyloarthritis recognition. Rheumatoid arthritis remains a sizeable but slower-growth cohort because mature TNF inhibitors and JAKs compete aggressively on price. Inflammatory bowel disease advances on TREMFYA’s Crohn’s disease label expansion, while miscellaneous autoinflammatory conditions will benefit from AI-discovered interleukin pathways. These mixed dynamics keep the interleukin inhibitors market diversified across immune-mediated disorders.
Employing biomarker-guided treatment algorithms further optimizes positioning. Dermatologists and rheumatologists increasingly triage patients by cytokine profile, matching IL-23 blockers to skin-dominant disease and IL-17 blockers to axial manifestations. Precision matching enhances therapeutic outcomes and reinforces the interleukin inhibitors market share for optimized molecules.
By Route of Administration:
Subcutaneous Dominance AcceleratesSubcutaneous formulations represented 60.21% of 2025 sales and outpace all routes at 16.05% CAGR. Autoinjectors deliver home-based doses that reduce infusion-center traffic and hospital cost. High-viscosity device engineering solved prior volume limits, enabling >100 mg/mL doses in under 15 seconds . Intravenous induction remains critical for acute Crohn’s disease flares and severe systemic presentations but is gradually relegated to complex cases. Market research shows that self-injection adherence rises when coupled with smartphone reminder apps and sensor-verified dose logging. These integrated platforms lend a digital overlay that preserves the competitive edge of subcutaneous therapies within the interleukin inhibitors market.
By End-User:
Home-Care Programs Reshape Treatment ParadigmsHospitals commanded 56.95% of 2025 consumption, reflecting initiation protocols, pharmacovigilance, and severe-case management. Yet home-care programs register the highest 16.18% CAGR as payers incentivize outpatient models to avoid facility fees. Specialty clinics build niche expertise that bridges full inpatient care and home administration, capturing complex but stable patients. Positive patient-reported outcomes underscore convenience, improved quality of life, and productivity gains, which amplify homecare pull. Device training modules and virtual nurse check-ins mitigate safety concerns, firmly rooting home settings in the evolving interleukin inhibitors market landscape.
Geography Analysis
North America, Europe and APAC Interleukin Inhibitors Market
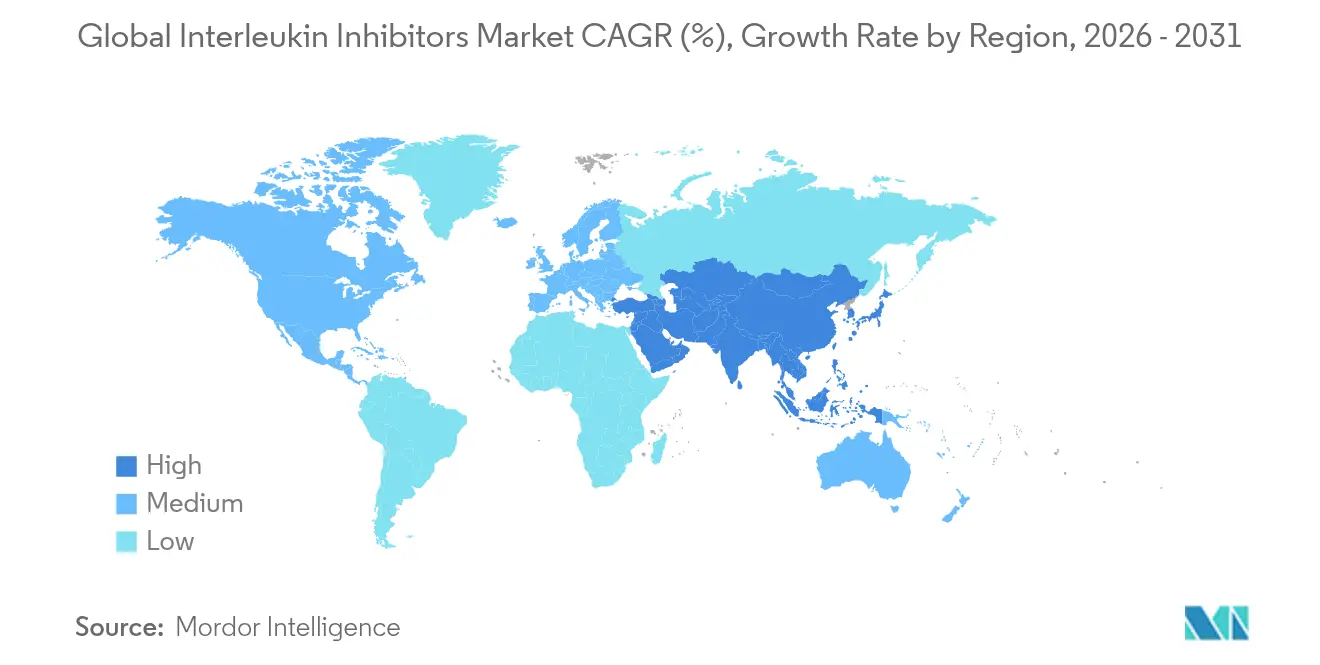
North America generated 41.78% of 2025 revenue due to comprehensive insurance coverage and an early-adopter clinician culture. Biosimilar entry is expected to soften price points but widen access, balancing revenue shifts. Europe follows with entrenched national tender frameworks that negotiate volume-linked discounts, promoting class sustainability. Asia-Pacific posts the highest 16.42% CAGR, driven by China’s local production, India’s emerging private insurance products, and Japan’s expanding indications list. Growing disease recognition and guideline alignment push biologic initiation earlier in patient journeys, accelerating volume capture in the Asia-Pacific interleukin inhibitors market.
LATAM and MEA Interleukin Inhibitors Market
Latin American uptake is uneven; Brazil leads adoption through its Unified Health System, while other countries face procurement budget limits. Middle East & Africa show double-digit unit growth off a small base, with GCC reimbursement committees gradually incorporating biologics for psoriasis and rheumatoid arthritis. As tender wins propagate, regional visibility increases, supporting physician familiarity. Overall, geography diversity cushions macro-economic shocks and sustains the interleukin inhibitors market growth curve worldwide.

Regulatory Landscape
Interleukin inhibitors are regulated under biologics frameworks led by the US FDA and the European Medicines Agency (EMA), with post-approval risk management and pharmacovigilance requirements that align with class-wide infection-risk labeling and ongoing safety monitoring. Regulatory actions across 2024-2026 also point to continued lifecycle activity for immunology biologics, including the US FDA approval of AbbVie's SKYRIZI (risankizumab-rzaa) for ulcerative colitis in June 2024, which feeds into how prescribers and payers think about treatment breadth across inflammatory bowel disease.
After marketing authorization, access is shaped by health technology assessment and reimbursement bodies such as NICE (United Kingdom), HAS (France), and IQWiG (Germany). Their country-level approaches to restrictions, step-therapy rules, and tender outcomes can affect biologics and biosimilars differently. In Europe, EMA endorsements of multiple ustekinumab biosimilars in 2024 highlighted regulator confidence in the biosimilar pathway while tightening price pressure at the national reimbursement level, keeping comparative evidence and real-world outcomes central to formulary access.
Value Chain Analysis
The interleukin inhibitors value chain covers target discovery and translational immunology research, biologics process development, GMP manufacturing (drug substance and sterile fill-finish), and global distribution through specialty channels and hospital systems. Because these therapies are temperature-sensitive biologics, cold-chain logistics and specialty pharmacy handling are key links, and disruptions tied to geopolitical instability in early 2026 were associated with extended lead times. This context raises the operational importance of redundant lanes, qualified shippers, and inventory buffering to protect continuity of care.
Commercialization is built around specialty prescribing (dermatology, rheumatology, gastroenterology) and payer-mediated access controls. Manufacturers also support adherence via patient services and self-administration training as subcutaneous use grows. The chain includes feedback loops from portfolio reinvestment and external innovation sourcing, as AbbVie has funded R&D and strategic transactions using established immunology cash flows, including its June 2026 agreement to acquire Apogee Therapeutics. That kind of pipeline acquisition and lifecycle management can influence manufacturing scale planning, market-access evidence generation, and competitive contracting.
Competitive Landscape
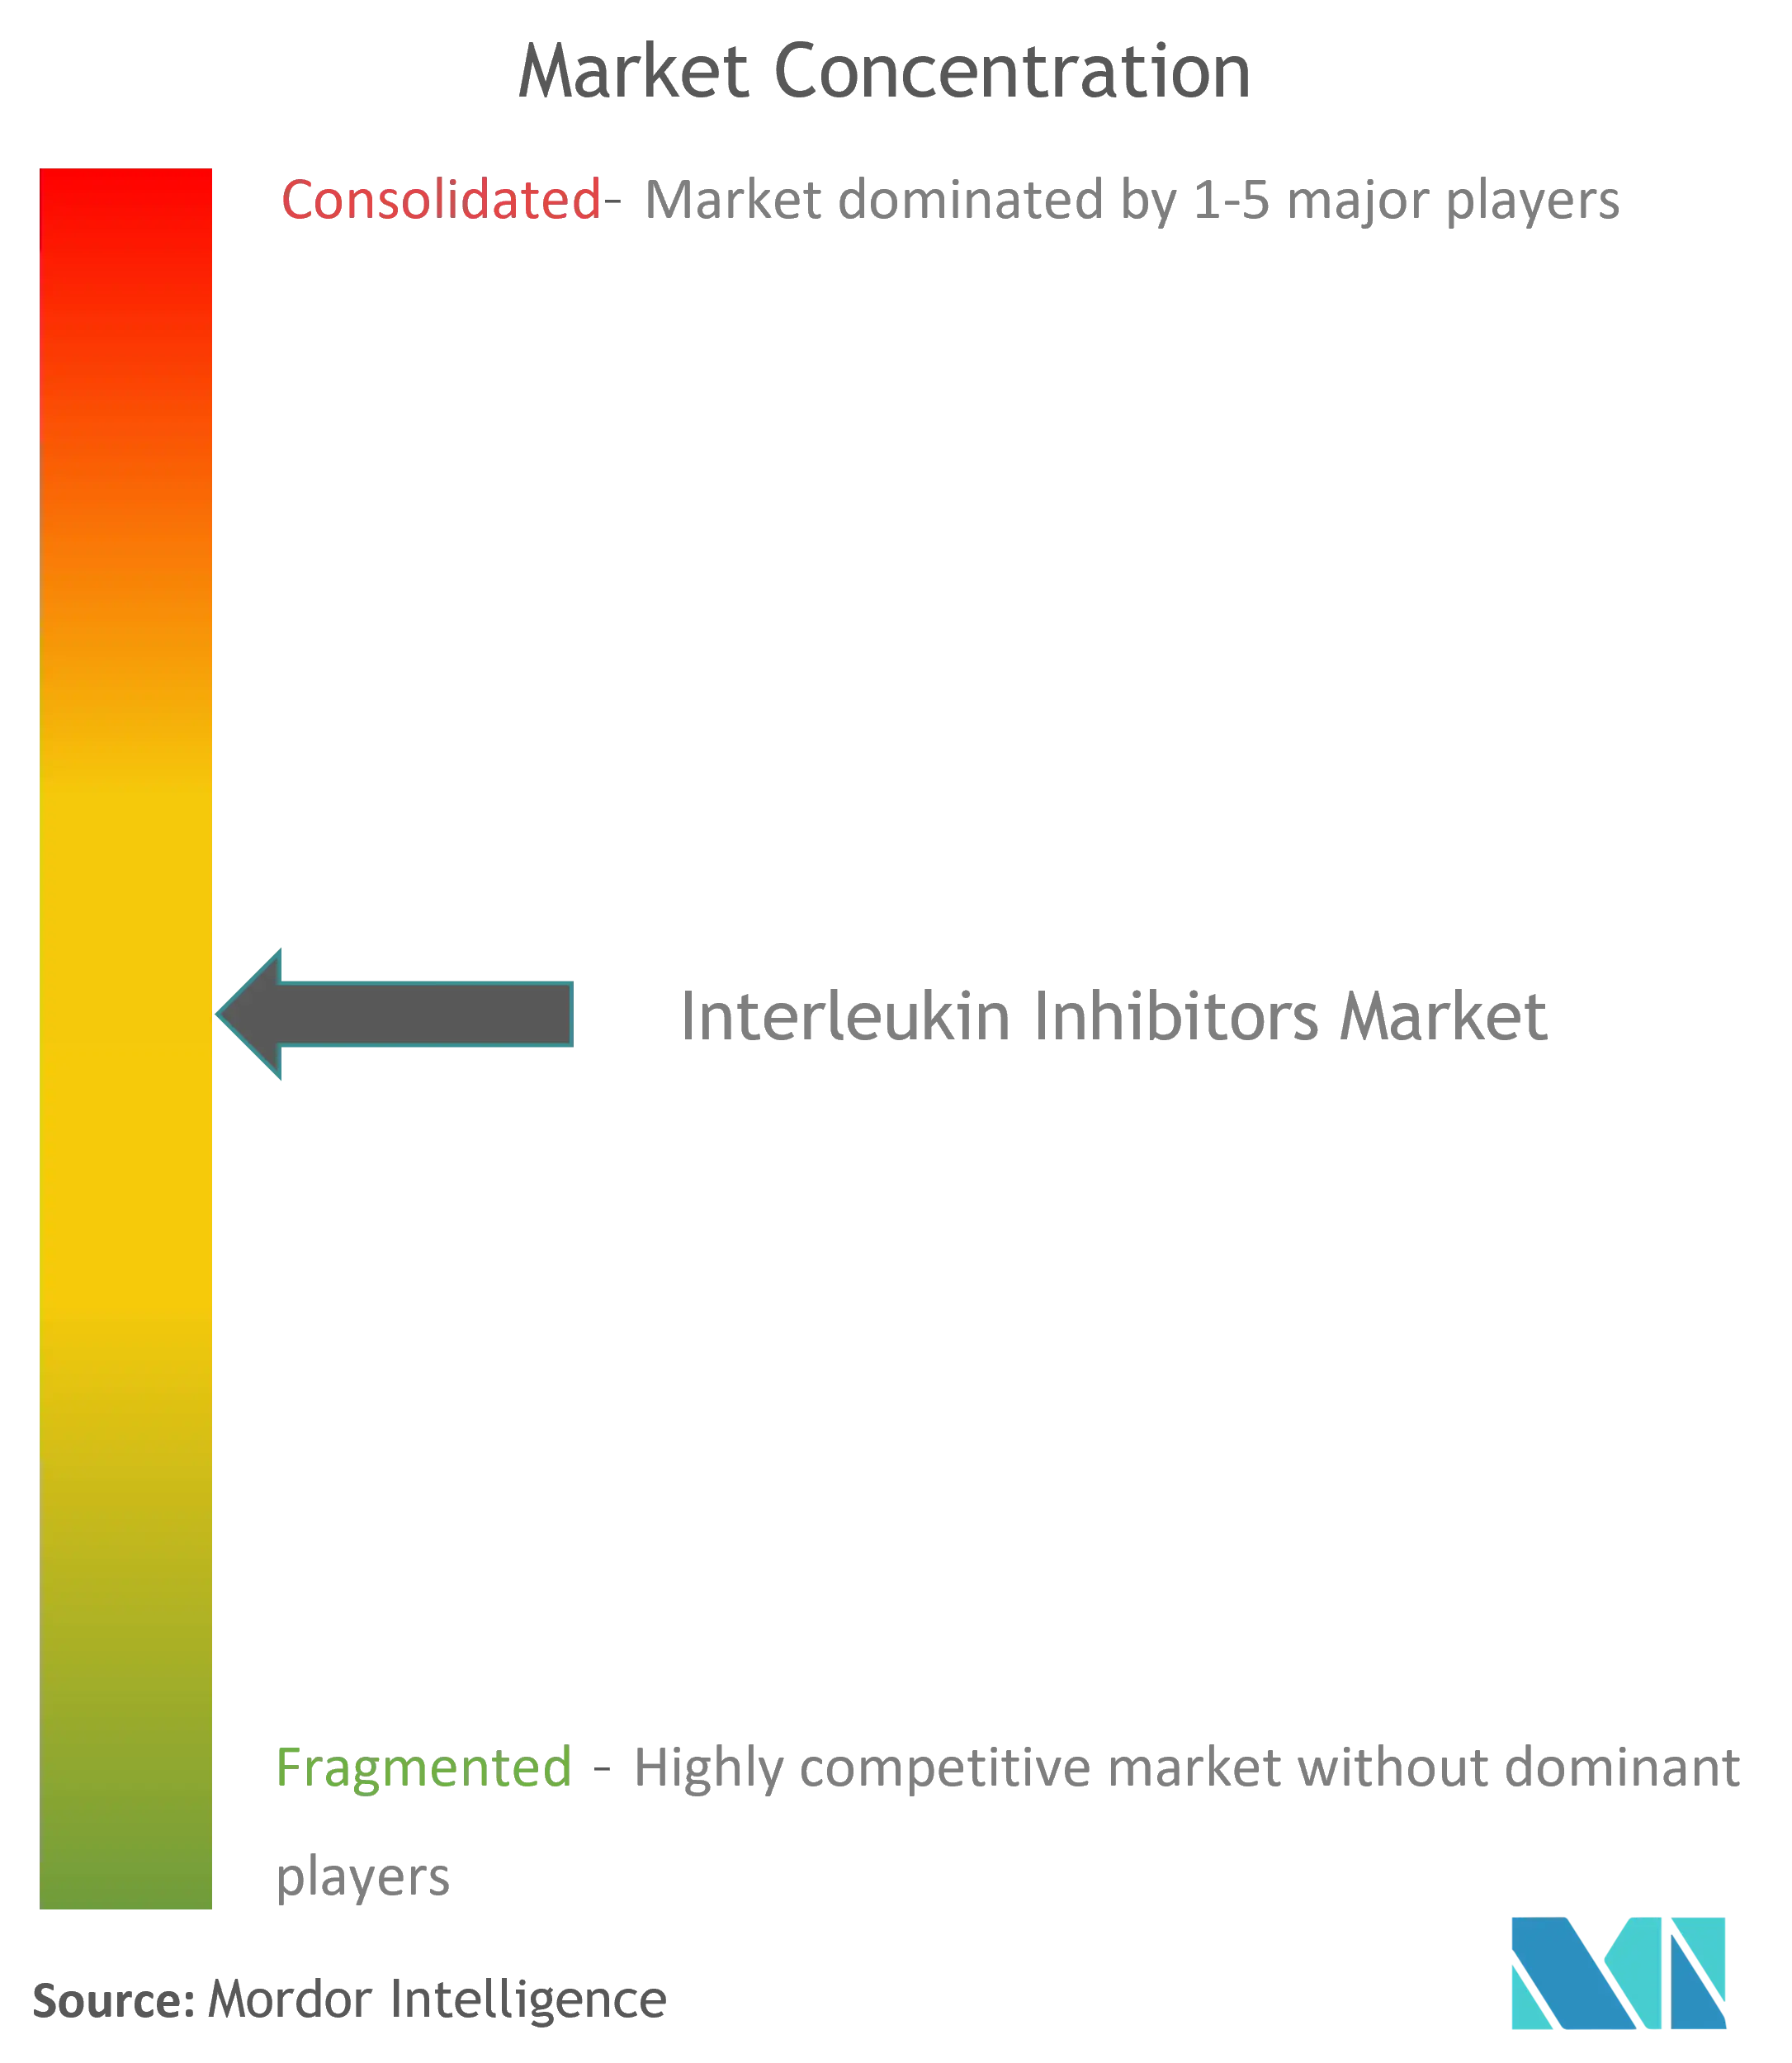
The top five manufacturers control an majority of global revenue, yielding a moderately concentrated arena. Novartis leads on the strength of Cosentyx, which spans five major indications. Eli Lilly follows with via Taltz’s penetration into dermatology and rheumatology. Johnson & Johnson leverages TREMFYA and the oral icotrokinra program. AbbVie contributes with Skyrizi and strategic AI investments that compress discovery timelines, strengthening life-cycle management. Bimekizumab’s dual IL-17A/F profile has given UCB a rising presence.
Strategic emphasis centers on label expansions rather than de-novo targets, maximizing R&D productivity. Corporates also deepen digital companions that monitor dosing adherence, providing real-world evidence to payers. Biosimilar makers intensify price competition, but innovators counter with formulation upgrades and convenience features. Emerging AI-native firms such as Insilico are courting partnerships to plug pipeline gaps for larger players, reshaping the future dynamics of the interleukin inhibitors market.
Global Interleukin Inhibitors Industry Leaders
AbbVie, Inc
Johnson and Johnson
Novartis AG
Eli Lilly and Company
GlaxoSmithKline Plc
- *Disclaimer: Major Players sorted in no particular order
Global Interleukin Inhibitors Market Companies Covered in this Report
- Novartis
- Eli Lilly and Company
- Abbvie
- Johnson & Johnson
- Roche
- Amgen
- Sanofi
- Regeneron Pharmaceuticals
- AstraZeneca
- Bristol-Myers Squibb
- UCB
- Boehringer Ingelheim
- Sun Pharmaceuticals Industries
- Biogen
- Celltrion Healthcare
- Samsung Bioepis
- Fresenius
- XBiotech Inc.
- Innovent Biologics
- Akeso Inc.

Market Opportunities and Future Outlook
White-space opportunities center on (i) expanding use across additional inflammatory phenotypes and patient segments through label extensions and improved dosing options, and (ii) shifting suitable patients toward home-care and self-administration programs that reduce site-of-care costs and ease infusion capacity constraints. Recent regulatory and lifecycle signals reinforce this direction: AbbVie's June 2024 US FDA approval of SKYRIZI for ulcerative colitis broadened IL-23 use in inflammatory bowel disease. Activity in 2026 around additional dosing and patient segments, including pediatric use for SKYRIZI in psoriatic disease, supports continued diversification of treatable populations within the broader interleukin inhibitor class.
Modality refresh and pipeline diversification offer another avenue where payers and clinicians look for differentiated convenience or durability versus mature injected biologics facing biosimilar pressure. AbbVie's June 2026 definitive agreement to acquire Apogee Therapeutics for about USD 10.9 billion, focused on expanding immunology candidates including IL-13 blockade (zumilokibart), illustrates capital allocation toward next-generation cytokine pathway assets. At the same time, EMA support for ustekinumab biosimilars in 2024 and ongoing biosimilar launches support access-driven volume growth in price-sensitive markets. This environment also pushes innovators toward formulation upgrades, real-world evidence packages, and differentiated mechanisms, including oral programs such as Johnson & Johnson's icotrokinra, to protect premium positioning.
Recent Industry Developments in Global Interleukin Inhibitors Market
- June 2026: AbbVie, Inc. announced a definitive agreement to acquire Apogee Therapeutics for approximately $10.9 billion to expand its immunology pipeline, including IL-13 assets. This move strengthens AbbVie's IL-13/IL-4 axis focus and broadens its immunology franchise to capture newer indications. The acquisition enlarges AbbVie's late stage and discovery stage assets, potentially accelerating growth in IL driven therapies.
- June 2026: Biogen, Inc. announced a definitive agreement to acquire RayThera Inc. to expand its portfolio of anti-inflammatory assets in immunology. The deal adds IL-targeted assets to Biogen's pipeline and broadens its inflammatory disease capabilities. The integration aims to create pipeline synergies and potential near term collaborations across IL pathways.
- June 2026: Organon & Co. announced FDA approval of a supplemental Biologics License Application for TOFICENCE to treat CAR-T induced CRS and COVID-19 in patients 2 years and older. The authorization expands the IL-6 pathway use into new clinical contexts. This label expansion broadens Organon’s tocilizumab footprint and supports overall IL inhibitor market dynamics.


Global Interleukin Inhibitors Market Report Scope and Research Methodology
Market Definition and Coverage
In this report, we size the interleukin inhibitors market as the value of prescription therapies that block specific interleukin pathways and are used to treat immune and inflammatory diseases across major regions.
Scope exclusions: We exclude non-interleukin biologics, small-molecule immunomodulators, diagnostics, and research-use-only cytokines that are not sold as therapeutic interleukin inhibitors.
Segments Covered in This Report
- By Drug Type
- IL-1 Inhibitors
- IL-6 Inhibitors
- IL-17 Inhibitors
- IL-23 Inhibitors
- Multi-target / Others
- By Application
- Psoriasis & Psoriatic Arthritis
- Rheumatoid Arthritis
- Inflammatory Bowel Disease (Crohn’s & UC)
- Ankylosing Spondylitis
- Other Auto-Inflammatory Disorders
- By Route of Administration
- Subcutaneous
- Intravenous
- By End-user
- Hospitals
- Specialty Clinics
- Home-care / Self-administration Programs
- By Geography
- North America
- United States
- Canada
- Mexico
- Europe
- Germany
- United Kingdom
- France
- Italy
- Spain
- Rest of Europe
- Asia-Pacific
- China
- India
- Japan
- South Korea
- Australia
- Rest of Asia-Pacific
- South America
- Brazil
- Argentina
- Rest of South America
- Middle East and Africa
- GCC
- South Africa
- Rest of Middle East and Africa
- North America
Data Sources, Market Sizing, and Validation
Desk Research
Desk research started with public epidemiology and treatment guidelines, because these help build the realistic treated pool for conditions where interleukin inhibitors are commonly used. We referred to sources such as the World Health Organization, the US FDA labels and approvals database, the US CDC, and the National Institutes of Health publications to understand indications, dosing, and safety updates.
We also reviewed payer and utilization signals that affect uptake, using sources such as CMS datasets and health-technology assessment summaries where available, then we checked persistence and switching patterns in peer-reviewed journals. For market context, we used company filings, investor presentations, reputable press coverage, and a paid subscription focused on company financials and intelligence to cross-check revenues and launch timing. The desk sources listed here are illustrative only, and we also consulted other public materials to collect data, validate assumptions, and clarify the final model.
Primary Interviews and Surveys
Primary work was used to pressure-test the market boundaries and the demand signals that desk sources cannot fully settle, especially around biologic switching, duration on therapy, and access changes after label expansions. We spoke with a mix of manufacturers, specialty distributors, hospital and specialty clinic stakeholders, and clinicians across major regions so that regional pricing, reimbursement, and route-of-administration shifts could be captured consistently.
Distribution of primary research fieldwork respondents
| Company type | Respondent position | Region |
|---|---|---|
| Top tier: 25% | CXOs: 14% | APAC: 48% |
| Mid tier: 61% | Functional/Unit leaders: 29% | EMEA: 32% |
| Smaller Players: 14% | Managers: 57% | Americas: 20% |
Market-Sizing & Forecasting
The model uses a top-down build that starts from disease prevalence and the treated cohort by key indications, which is then translated into therapy demand using prescribing mix and dosing intensity, followed by pricing logic by region. After building the main demand pool, we corroborated totals using selective bottom-up checks such as sampled brand revenue roll-ups, channel checks on biologics mix, and an ASP times volume reasonableness test so that outliers could be corrected.
Inputs that mattered in this market included the addressable patient pool for psoriasis, inflammatory bowel disease, asthma, and arthritis, average duration on therapy, route-of-administration mix (subcutaneous versus intravenous), launch and label-expansion timing, and observed discounting and net-price drift in major markets. Where data gaps existed for smaller countries, we used proxy uptake curves from similar reimbursed markets and then scaled them using population, diagnosis rates, and access levels verified in interviews.
For forecasting, we relied on scenario analysis supported by a simple multivariate view of treated prevalence growth, uptake speed after access improvements, and price erosion assumptions. The scenarios were then aligned to what experts described as realistic switching and persistence behavior so that growth did not exceed plausible treatment capacity and reimbursement constraints.
Data Validation & Update Cycle
We validated outputs by checking consistency across independent signals such as treated patient volumes, expected dosing, and publicly discussed revenue direction for key therapy areas, then we reviewed large variances country by country. If an assumption created an unusual jump in uptake or pricing, the input was rechecked and, when needed, respondents were re-contacted to confirm what changed in practice.
Before sign-off, the model and write-up go through multiple analyst reviews so that definitions, math, and narrative are aligned. The report is refreshed annually, and interim updates are made when material events occur such as major approvals, safety restrictions, or reimbursement changes. Right before delivery, we run a final pass to confirm that the latest events and numbers are reflected in the estimates.
Mordor Intelligence's Interleukin Inhibitors Market Market Estimate Compared With Other Published Estimates
Published market sizes for interleukin inhibitors can look far apart because each publisher draws the boundary differently and does not always align on which products, indications, and net pricing assumptions are counted. Differences also show up when the base year is not the same and when currency timing and inflation are treated inconsistently.
By tracking treated-patient pools, dosing-based volume, and net price timing for January 2026 updates, Mordor Intelligence keeps the value estimate tied to therapy use by indication, instead of mixing in adjacent immunology drug classes or projecting aggressive conversion without access checks.
Benchmark comparison
| Source | Market Size | Gaps in Research Methodology |
|---|---|---|
| Mordor Intelligence | USD 45.23 B (2026) | |
| Market Research Publisher A | USD 7.33 B (2025) | This figure appears to use a narrower product set or different inclusion rules for interleukin families, and it may apply a more limited indication mix and earlier-stage uptake assumptions, which reduces the addressed demand pool and the implied net revenue. |
| Press Release Digest B | USD 36.78 B (2025) | The estimate is close in theme but can diverge due to how net versus list prices are handled, whether hospital and specialty clinic channels are normalized, and whether the base year is updated for late-year approvals and reimbursement shifts. |
The table shows that most of the spread comes from scope choices and how demand is converted into value through dosing, access, and net pricing. When the market is rebuilt from a clear treated-cohort and pricing inputs, then cross-checked with revenue and channel signals, the final number is easier to trace and repeat over time.


Key Questions Answered in the Report
What is the current market size of the interleukin inhibitors market?
The interleukin inhibitors market size reached USD 45.23 billion in 2026 and is forecast to expand to USD 89.6 billion by 2031.
Which drug class leads the interleukin inhibitors market?
IL-17 inhibitors lead with 37.32% 2025 revenue share, driven by well-established agents covering multiple autoimmune indications.
Which region is growing fastest in the interleukin inhibitors market?
Asia-Pacific posts the highest 16.42% CAGR to 2031 due to expanding reimbursement, local manufacturing, and rising autoimmune diagnosis rates.
4 Why is subcutaneous delivery preferred for interleukin inhibitors?
High-concentration autoinjectors enable home-based dosing, improve adherence, and lower infusion-center costs, giving subcutaneous formats both the largest share and fastest growth.
Page last updated on:


 Your data is secure and never sold or shared.


