Cell Based Immunotherapy Market Size and Share
Market Overview
| Study Period | 2020 - 2031 |
|---|---|
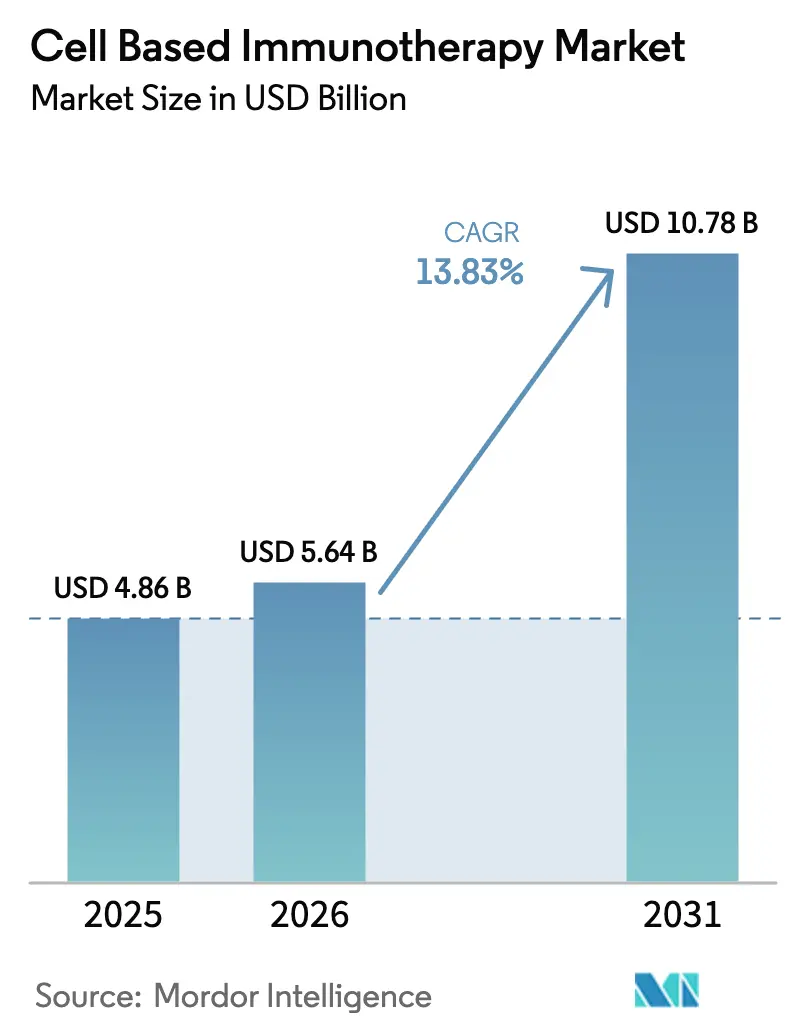
| Market Size (2026) | USD 5.64 Billion |
| Market Size (2031) | USD 10.78 Billion |
| Growth Rate (2026 - 2031) | 13.83% CAGR |
| Fastest Growing Market | Asia Pacific |
| Largest Market | North America |
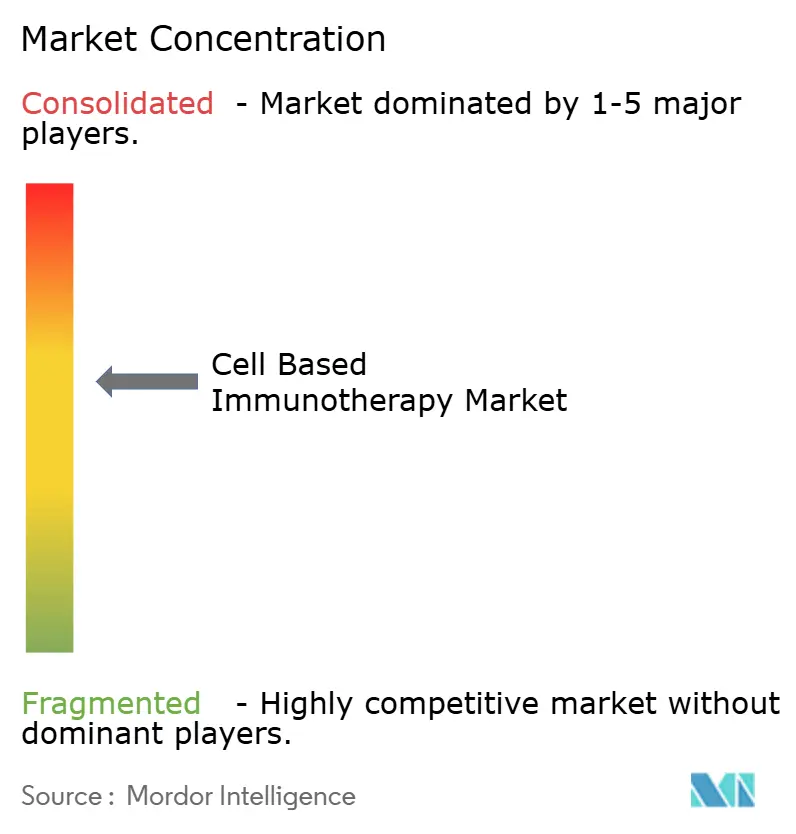
| Market Concentration | Medium |
Major Players *Disclaimer: Major Players sorted in no particular order Image © Mordor Intelligence. Reuse requires attribution under CC BY 4.0. | |
Cell Based Immunotherapy Market Analysis by Mordor Intelligence
The Cell Based Immunotherapy Market size is expected to increase from USD 4.86 billion in 2025 to USD 5.64 billion in 2026 and reach USD 10.78 billion by 2031, growing at a CAGR of 13.83% over 2026-2031.
Rapid label expansions into second-line settings, expanding reimbursement frameworks, and sustained big-pharma capacity build-outs are repositioning engineered immune cells from salvage options to earlier-line standards of care. Autologous franchises still dominate volumes, yet off-the-shelf allogeneic programs are accelerating on the back of CRISPR edits that abrogate graft-versus-host risk and trim manufacturing lead times. Technology convergence across gene editing, viral vector engineering, and point-of-care microfactories is compressing the vein-to-vein cycle, while outcome-based contracts are de-risking payer adoption. Meanwhile, new entrants are utilizing in vivo delivery and natural killer–cell chassis to open up solid-tumor opportunities that incumbent CAR-T platforms have yet to capture.
Key Report Takeaways
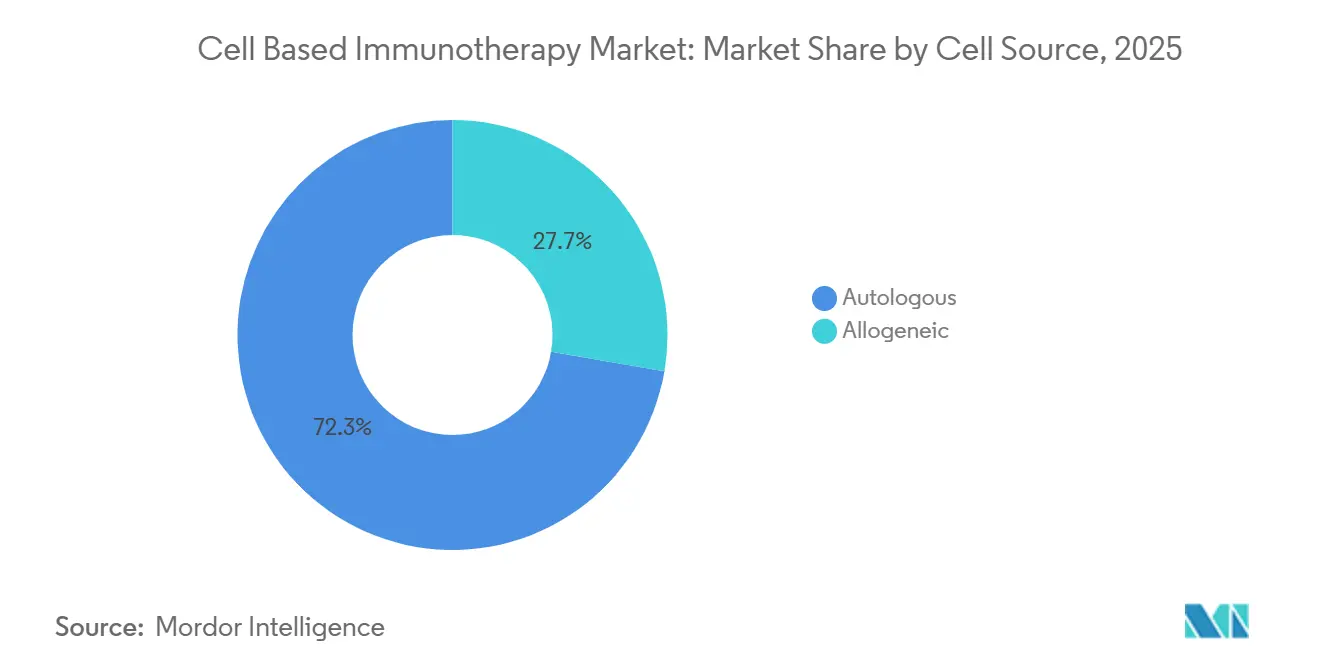
- By cell source, autologous therapies held 72.31% of the cell-based immunotherapy market share in 2025, whereas allogeneic constructs are forecast to expand at a 14.14% CAGR through 2031.
- By cell type, CAR-T products accounted for 64.73% of the revenue in 2025, while CAR-NK platforms are poised for the fastest growth, with a 15.07% CAGR from 2026 to 2031.
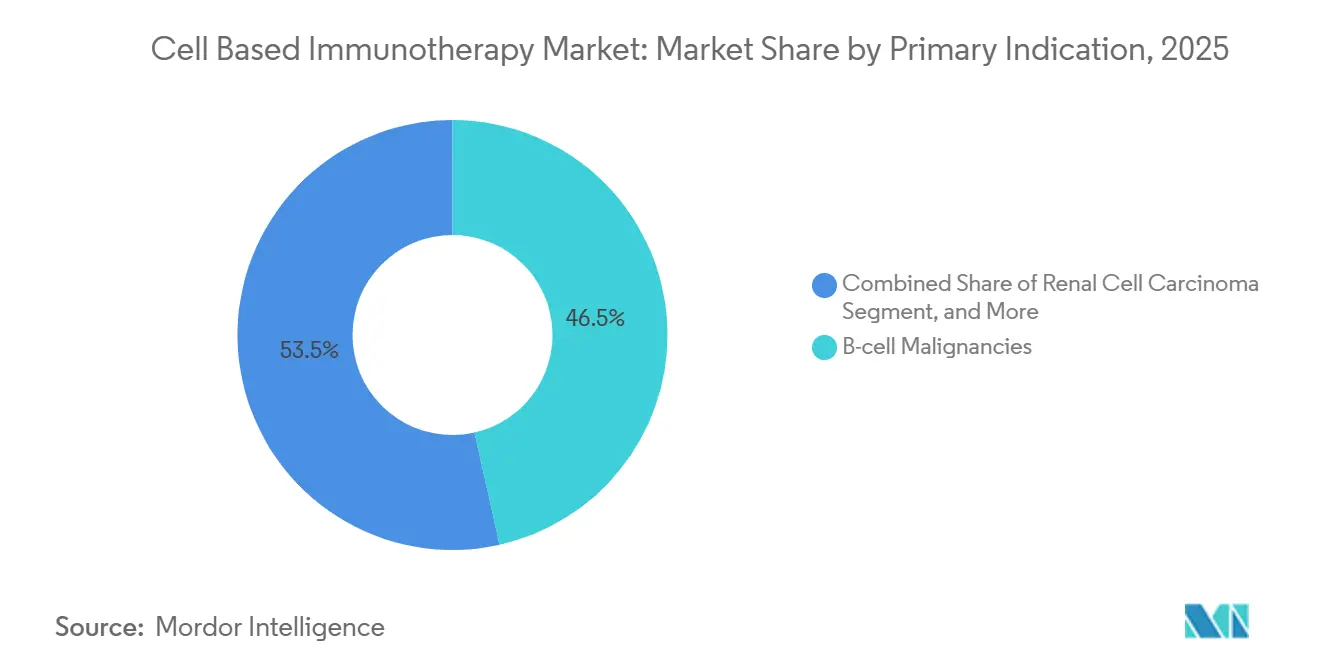
- By primary indication, B-cell malignancies accounted for 46.48% of 2025 revenue; renal cell carcinoma is expected to register the quickest 12.36% CAGR over the forecast period.
- By end user, hospitals treated 71.46% of patients in 2025, while specialty cancer centers represented the fastest-growing 17.84% CAGR through 2031.
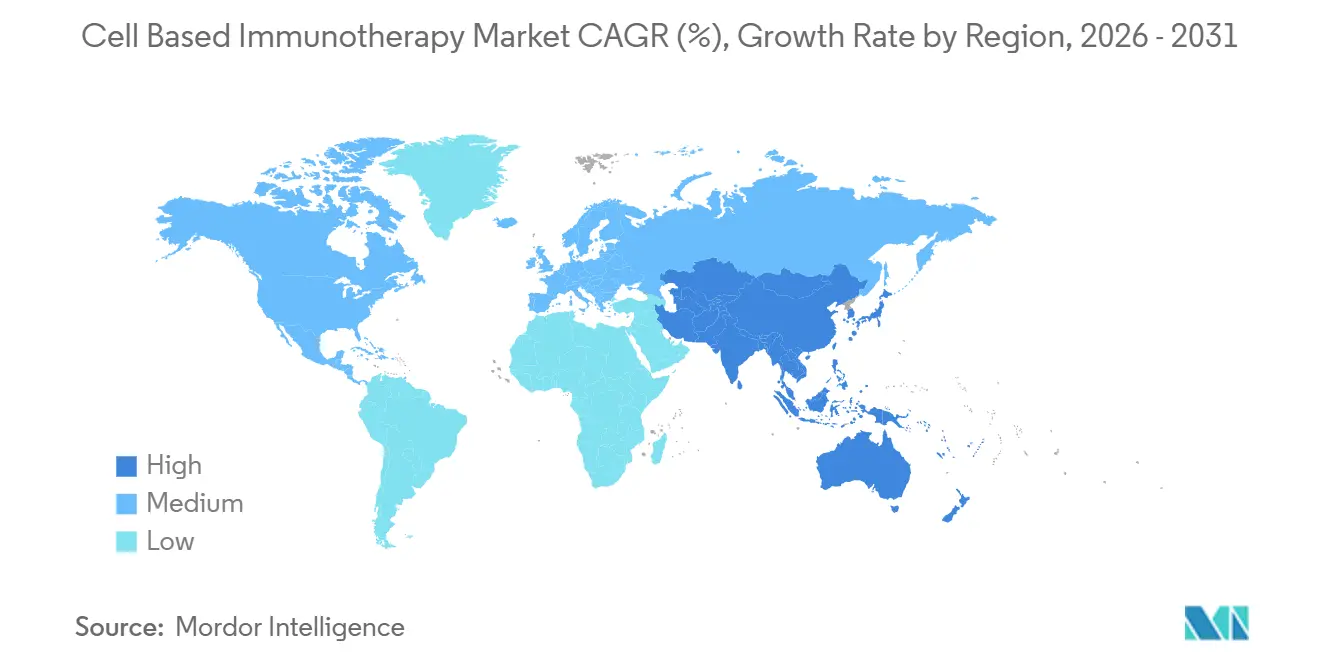
- By geography, North America accounted for 44.26% of revenue in 2025, and the Asia-Pacific region is expected to experience a 16.21% CAGR through 2031.
Note: Market size and forecast figures in this report are generated using Mordor Intelligence’s proprietary estimation framework, updated with the latest available data and insights as of January 2026.
Global Cell Based Immunotherapy Market Trends and Insights
Drivers Impact Analysis*
| Driver | (~) % Impact on CAGR Forecast | Geographic Relevance | Impact Timeline |
|---|---|---|---|
| Surging Cancer Prevalence and Earlier-Line Use Approvals | +3.2% | North America, Europe | Short term (≤ 2 years) |
| Rapid Advances in Gene-Editing & Viral-Vector Engineering | +2.8% | North America, Europe, APAC | Medium term (2-4 years) |
| Expanding Reimbursement Frameworks for Commercial CAR-T Launches | +2.5% | North America, Western Europe, GCC, Brazil | Medium term (2-4 years) |
| Big-Pharma M&A, Licensing Deals, and Capacity Build-Outs | +2.1% | Global | Short term (≤ 2 years) |
| Point-of-Care Micro-Factories Slashing Vein-to-Vein Cycle Time | +1.9% | North America, spill-over to EU & APAC | Medium term (2-4 years) |
| In-Vivo CAR Payload Delivery Platforms Eliminating Lymphodepletion | +1.4% | North America, Europe | Long term (≥ 4 years) |
| Source: Mordor Intelligence | |||


Surging Cancer Prevalence and Earlier-Line Use Approvals
Global cancer incidence reached 20 million new cases in 2024, and regulators responded by green-lighting the use of second-line CAR-T therapy in diffuse large B-cell lymphoma, shifting a sizable share of fitter patients into the cell-based immunotherapy market. The U.S. FDA’s expanded label for Yescarta moved 40% of eligible patients forward by one therapy line. At the same time, the European Medicines Agency followed with conditional approval for Kymriah in second-line follicular lymphoma.[1]“Conditional Marketing Authorization for Kymriah,” European Medicines Agency, ema.europa.eu Real-world evidence now shows a 24-month progression-free survival rate of 52% in second-line CAR-T cohorts, compared to 31% in third-line cohorts. Sponsors are redesigning registrational trials around earlier-line endpoints, anticipating that this regulatory momentum will hold through 2027.
Rapid Advances in Gene-Editing and Viral-Vector Engineering
CRISPR, base-editing, and optimized lentiviral systems are enhancing cell potency and reducing the cost of goods by 35% per dose.[2]“Advances in Lentiviral Vector Production,” Nature Methods, nature.com Caribou’s TRAC-edited allogeneic CAR-T therapy delivered a 68% complete response rate with no graft-versus-host disease in Phase 1, highlighting the feasibility of single-step edits to enhance persistence. Parallel innovations in adeno-associated virus serotype engineering enabled Sana Biotechnology’s in vivo CAR approach, which transduced 80% of T cells in non-human primates without ex vivo manipulation. These advances are lowering technical barriers for smaller entrants and intensifying competition for first-generation autologous incumbents.
Expanding Reimbursement Frameworks for Commercial CAR-T Launches
Outcome-based payment models are gaining traction. The U.S. Centers for Medicare & Medicaid Services finalized a coverage policy that refunds 50% of the list price if patients fail to achieve a 6-month complete response. Germany set a precedent for value-based pricing at EUR 320,000 (USD 345,000) per dose with mandatory registry enrolment.[3]“Value-Based Pricing for Abecma,” Federal Joint Committee, g-ba.de Japan’s regenerative-medicine rulebook grants conditional approval, allowing for the collection of real-world evidence, which cuts 18 months off market-entry timelines. These frameworks de-risk launches and catalyze the development of regional manufacturing hubs.
Big-Pharma M&A, Licensing Deals, and Capacity Build-Outs
Strategic transactions surged in 2024-2025 as manufacturers sought platform optionality. Bristol Myers Squibb’s USD 13.4 billion takeover of Myeloid Therapeutics secured a myeloid-cell engager that complements its autologous CAR-T franchise. Gilead opened a USD 450 million Irish plant that trims European vein-to-vein cycles by 11 days. Novartis invested USD 380 million in an allogeneic expansion in New Jersey to future-proof its capacity. Contract manufacturers followed suit, with Lonza deploying additional Cocoon units across the APAC region.
Restraints Impact Analysis*
| Restraint | (~) % Impact on CAGR Forecast | Geographic Relevance | Impact Timeline |
|---|---|---|---|
| Complex, Fragile Supply Chain & Specialized Talent Shortages | -1.8% | North America, Europe | Short term (≤ 2 years) |
| Cytokine-Release-Syndrome (CRS) Risk & Associated Liability Costs | -1.3% | North America, Europe, APAC | Medium term (2-4 years) |
| Viral-Vector Raw-Material Bottlenecks Constraining Scale-Up | -1.1% | North America, Europe | Medium term (2-4 years) |
| Regulatory Uncertainty Around In-Vivo Gene-Delivery Vectors | -0.9% | North America, Europe | Long term (≥ 4 years) |
| Source: Mordor Intelligence | |||
Complex, Fragile Supply Chain & Specialized Talent Shortages
Cold-chain mishaps and workforce gaps continue to trigger batch failures. A global survey found that 68% of contract manufacturers had unfilled process development roles, with a median hiring time of over 9 months. Cryopreservation excursions caused 12% of 2024 batch rejections. Academic programs are scaling slowly; only 14 universities offer lentiviral-production curricula. Vertical integration efforts such as Gilead internalizing vector production and Novartis co-running a technician academy with the University of Pennsylvania will take several years to close the gap.
Cytokine-Release-Syndrome (CRS) Risk & Associated Liability Costs
The FDA logged 1,847 serious CRS events in 2024, including 23 fatalities. Tocilizumab adds USD 18,000 per patient to manage severe cases, eroding margins in value-based contracts. Liability insurers hiked premiums 40% for cell-therapy trials. A Memorial Sloan Kettering algorithm predicting grade 3-4 CRS with 82% sensitivity cut ICU admissions by 31%, indicating that biomarker-guided prophylaxis can mitigate risk, though regulatory acceptance is pending.
*Our forecasts treat driver/restraint impacts as directional, not additive. The impact forecasts reflect baseline growth, mix effects, and variable interactions.
Segment Analysis
By Cell Source: Autologous Dominance Meets Allogeneic Disruption
Autologous therapies accounted for 72.31% of the cell-based immunotherapy market share in 2025, driven by four commercial CAR-T brands that collectively treated over 18,000 patients in 2024. Patient-specific products carry zero graft-versus-host risk and have commanded list prices above USD 400,000. Yet they rely on 14-28 day manufacturing windows, during which 15-20% of patients progress. The allogeneic segment, projected to expand at a 14.14% CAGR, circumvents these delays. Donor cells edited at the TRAC, B2M, and CIITA loci can be banked for off-the-shelf dosing as soon as the disease is confirmed.
Allogeneic programs are already infusing patients within 3 days of leukapheresis and are demonstrating an overall response rate of 75% in early lymphoma trials. Regulators now permit sponsors to extrapolate specific autologous safety endpoints, thereby streamlining the development process. Persistence beyond 24 months remains a crucial unknown, and payers are aware of the higher cumulative cost associated with repeat dosing. Even so, the operational simplicity of inventory models is incentivizing contract manufacturers to carve out allogeneic-dedicated suites.


By Cell Type: CAR-T Incumbency Faces CAR-NK and TIL Insurgency
CAR-T platforms accounted for 64.73% of 2025 revenue, driven by six FDA-approved products for hematologic malignancies. Manufacturing infrastructure is established, and vein-to-vein times have almost halved since 2020. Nonetheless, low trafficking and antigen heterogeneity cap solid-tumor response rates at single digits. CAR-NK programs, forecast for a 15.07% CAGR, sidestep HLA matching and have yet to register any CRS or neurotoxicity signals, making them attractive as off-the-shelf candidates.
Induced-pluripotent-stem-cell-derived CAR-NK products achieved a 63% objective response in advanced ovarian cancer without severe toxicities, validating their innate cytotoxicity. Tumor-infiltrating lymphocyte (TIL) therapy occupies a smaller niche but won its first U.S. approval in 2024 for metastatic melanoma, providing an option for neoantigen-rich tumors. TCR-T products gained traction in synovial sarcoma and could eventually target intracellular antigens inaccessible to CARs, although HLA restriction limits addressable populations.
By Primary Indication: B-Cell Malignancies Anchor Growth While Solid Tumors Beckon
B-cell malignancies accounted for 46.48% of 2025 revenue, leveraging well-characterized antigens and established care pathways. Solid tumors, however, hold the lion’s-share opportunity. Renal cell carcinoma leads the solid-tumor pipeline with a projected 12.36% CAGR as multi-antigen CAIX-, CD70- and PSMA-targeted constructs enter mid-stage trials. Early prostate-cancer data already show a 28% response rate, up from historical low double digits. In liver cancer, the selective hepatic-artery infusion of CAR-T cells resulted in a 41% response in a small pilot study, highlighting the promise of locoregional techniques.
Sponsors are layering armoring modules secreted IL-15, PD-1 blockers, and hypoxia-inducible factors onto CAR scaffolds to overcome suppressive microenvironments, but these enhancements extend development timelines by two to three years. Still, 18 new solid-tumor CAR-T trials launched in 2024-2025, signifying an industry-wide push to diversify beyond hematology.
By End User: Specialty Cancer Centers Outpace Hospitals in Adoption Velocity
Hospitals infused 71.46% of commercial patients in 2025 thanks to existing apheresis units and 24-hour ICU coverage. Establishing a CAR-T capability, however, requires USD 2-3 million in capital and specialized staff that smaller facilities struggle to recruit. Payers are increasingly directing beneficiaries to a narrow network of high-volume centers, thereby magnifying patient flow to institutions with demonstrated outcomes.
Specialty cancer centers are consequently expanding at a 17.84% CAGR. The top three U.S. academic centers alone treated 4,200 patients in 2024. Many have installed point-of-care bioreactors, allowing them to run investigational and commercial programs side-by-side. Academic and research institutes, responsible for 80% of early-phase trials, remain the crucible for next-generation constructs, ensuring they will continue to be central to innovation.
Geography Analysis
North America generated 44.26% of global revenue in 2025, supported by six FDA-approved products, 180 active trials, and outcomes-based reimbursement that underwrites high list prices. In 2024, the United States treated 9,500 patients, 60% of whom received therapy at 15 high-volume centers that now operate automated on-site manufacturing facilities. Canada lags with only three approved products and third-line coverage limits, while Mexico’s access remains confined to medical tourists traveling to U.S. sites.
The Asia-Pacific region is the fastest-growing, with a 16.21% CAGR forecast. In 2024, China’s regulator cleared eight domestic CAR-T products, priced at CNY 1.2 million (approximately USD 165,000), to undercut imports. Japan’s conditional pathway cuts 18 months off review timelines, fueling trial starts. India and Australia are still in their early stages but have earmarked public funds for domestic manufacturing by 2027, indicating longer-term upside.
Germany embraced value-based pricing, whereas the United Kingdom rejected one leading product for cost-effectiveness, pending confidential rebates. Italy and Spain face regional budget allocations that can delay reimbursement up to two years after an EMA green light. Middle East & Africa and South America represent just 6% of demand, though Dubai’s center-of-excellence model and Brazil’s priority reviews hint at incremental growth as local capacity emerges.

Competitive Landscape
The cell-based immunotherapy market exhibits moderate concentration, with Novartis, Gilead Sciences, Bristol Myers Squibb, and Johnson & Johnson controlling a significant market share of 2025 revenue through vertically integrated CAR-T franchises. Outcomes-based contracts that claw back up to 50% of the list price on non-responders are pressuring margins, motivating incumbents to acquire platform technologies. Off-the-shelf disrupters such as Allogene Therapeutics, Caribou Biosciences, and Precision BioSciences aim to commoditize autologous workflows with CRISPR-edited inventory, while specialty developers like Sana Biotechnology push in vivo delivery to bypass manufacturing entirely.
More than 4,200 patents were filed in 2024, although foundational BCMA and CD19 claims are set to expire in 2026-2028, potentially opening a biosimilar gateway. Contract manufacturers are consolidating to secure viral-vector supplies, exemplified by Catalent’s purchase of plasmid producer Delphi Genetics. As CD19 and BCMA exclusivity wanes, differentiation will likely shift to focus on manufacturing logistics, armoring strategies, and combination regimens rather than single-antigen targeting.
Cell Based Immunotherapy Industry Leaders
Novartis AG
Bristol-Myers Squibb Co.
Pfizer Inc.
Johnson & Johnson
Gilead Sciences, Inc.
- *Disclaimer: Major Players sorted in no particular order

Recent Industry Developments
- June 2025: Johnson & Johnson’s dual-target CAR-T JNJ-90014496 delivered 100% objective responses in first-line large B-cell lymphoma with no Grade 3/4 CRS.
- March 2025: The FDA accepted Capricor’s BLA for Deramiocel in Duchenne muscular dystrophy cardiomyopathy, assigning priority review and an August 31, 2025 PDUFA date.
- December 2024: The FDA approved Ryoncil as the first allogeneic mesenchymal stromal cell therapy for steroid-refractory acute GVHD in children.
- January 2024: Johnson & Johnson acquired Ambrx Biopharma for USD 2 billion to add protease-activated CAR-T trafficking technology.


Research Methodology Framework and Report Scope
Market Definitions and Key Coverage
Our study defines the cell-based immunotherapy market as therapies that isolate, engineer, expand, and reinfuse living immune cells, primarily T, NK, or dendritic cells, to treat oncologic and immune disorders. Commercial and late-stage investigational products such as CAR-T, TCR-T, TIL, NK, and dendritic cell vaccines form the measurable revenue pool.
Scope exclusion: antibody, small-molecule, and checkpoint inhibitor drugs remain outside this sizing.
Segmentation Overview
- By Cell Source
- Autologous
- Allogeneic
- By Cell Type
- CAR-T Cells
- TCR-T Cells
- CAR-NK Cells
- Tumor-Infiltrating Lymphocytes (TIL)
- By Primary Indication
- B-cell Malignancies
- Prostate Cancer
- Renal Cell Carcinoma
- Liver Cancer
- Other Indications
- By End User
- Hospitals
- Specialty Cancer Centers
- Academic & Research Institutes
- By Geography
- North America
- United States
- Canada
- Mexico
- Europe
- Germany
- United Kingdom
- France
- Italy
- Spain
- Rest of Europe
- Asia-Pacific
- China
- Japan
- India
- Australia
- South Korea
- Rest of Asia-Pacific
- Middle East & Africa
- GCC
- South Africa
- Rest of Middle East & Africa
- South America
- Brazil
- Argentina
- Rest of South America
- North America
Detailed Research Methodology and Data Validation
Primary Research
Interviews with oncologists, cell-therapy manufacturing directors, hospital pharmacy buyers, and reimbursement specialists across North America, Europe, and Asia helped validate installed treatment centers, average selling prices, vein-to-vein throughput, and future capacity expansions that are not visible in public filings.
Desk Research
Mordor analysts began with public data streams such as FDA, EMA, and PMDA approval logs, WHO cancer incidence files, NIH clinical-trial registries, and trade association dashboards (e.g., Alliance for Regenerative Medicine). Company 10-Ks, investor decks, customs shipment dashboards, and peer-reviewed journals supplied prevalence, penetration, and pricing clues. Paid libraries including D&B Hoovers for manufacturer revenue splits and Questel for patent velocity sharpened competitive mapping. The sources listed illustrate our desk work; many additional references supported data checks and clarifications.
Market-Sizing & Forecasting
We built a top-down model beginning with treated-patient cohorts derived from disease incidence, eligibility share, and therapy uptake, which are then priced using region-weighted ASPs. Select bottom-up roll-ups of supplier invoice samples and capacity audits tested these totals. Key variables include CAR-T center accreditations, autologous manufacturing cycle time, label-expansion approvals, reimbursement cap shifts, and viral-vector production output. Multivariate regression with scenario analysis projects 2025-2030 demand, while missing unit datapoints are filled through clinician consensus ranges before final balancing.
Data Validation & Update Cycle
Outputs pass a two-stage analyst review where variance against fresh approval counts, shipment trends, and hospital billing data triggers rework. Reports refresh every twelve months, with interim flashes after material FDA or EMA events. Just before release, an analyst rechecks all figures.
Why Mordor's Cell Based Immunotherapy Baseline Stands Firm
Published estimates often diverge because firms differ on therapy mix, price assumptions, and update cadence.
Key gap drivers span whether autologous pipeline sales are counted pre-approval, the ASP inflation path each firm chooses, and how fast geographic penetration is allowed to rise.
Benchmark comparison
| Market Size | Anonymized source | Primary gap driver |
|---|---|---|
| USD 5.24 Bn (2025) | Mordor Intelligence | - |
| USD 13.87 Bn (2025) | Global Consultancy A | Includes early-stage pipeline sales and bundles cell-therapy tooling revenues |
| USD 7.64 Bn (2025) | Industry Research B | Applies uniform ASP uplift and assumes faster Asia-Pacific site roll-out |
These comparisons show that Mordor's disciplined scope choice, conservative ASP curve, and annual refresh keep our baseline transparent, reproducible, and dependable for strategic decisions.


Key Questions Answered in the Report
How large is the cell based immunotherapy market in 2026?
The cell-based immunotherapy market size was USD 5.64 billion in 2026 and is on track to reach USD 10.78 billion by 2031 at a 13.83% CAGR.
Which segment currently dominates revenue?
Autologous cell sources held 72.31% of the 2025 cell based immunotherapy market share, reflecting the commercial maturity of Kymriah, Yescarta, Breyanzi and Carvykti.
What is the fastest-growing technology platform?
CAR-NK programs are projected to achieve a 15.07% CAGR, thanks to off-the-shelf dosing without HLA matching or lymphodepletion.
Which region will grow the quickest through 2031?
Asia-Pacific leads with a 16.21% CAGR, propelled by regulatory fast tracks in China and Japan and local price points well below Western benchmarks.
What is the chief manufacturing bottleneck?
Viral-vector raw-material shortages and a limited pool of GMP-trained scientists are constraining near-term scale-up, trimming industry CAGR by an estimated 1.1%.
Page last updated on:


