Global Antiemetic Drugs Market Size and Share
Market Overview
| Study Period | 2020 - 2031 |
|---|---|
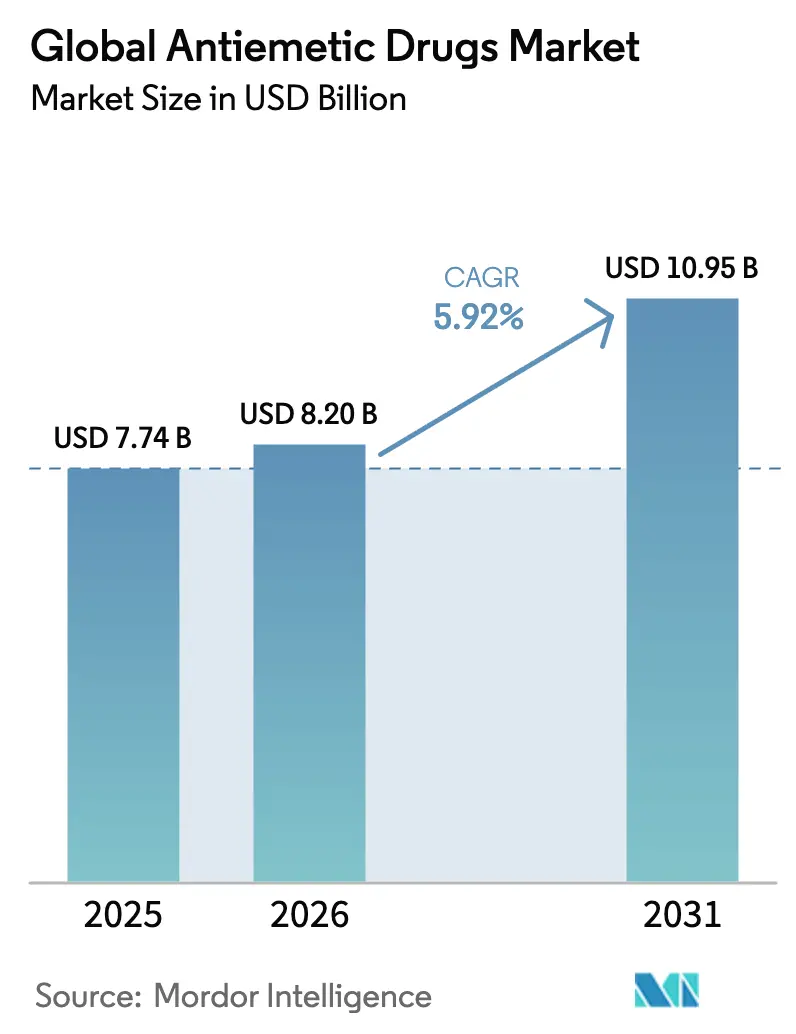
| Market Size (2026) | USD 8.2 Billion |
| Market Size (2031) | USD 10.95 Billion |
| Growth Rate (2026 - 2031) | 5.92% CAGR |
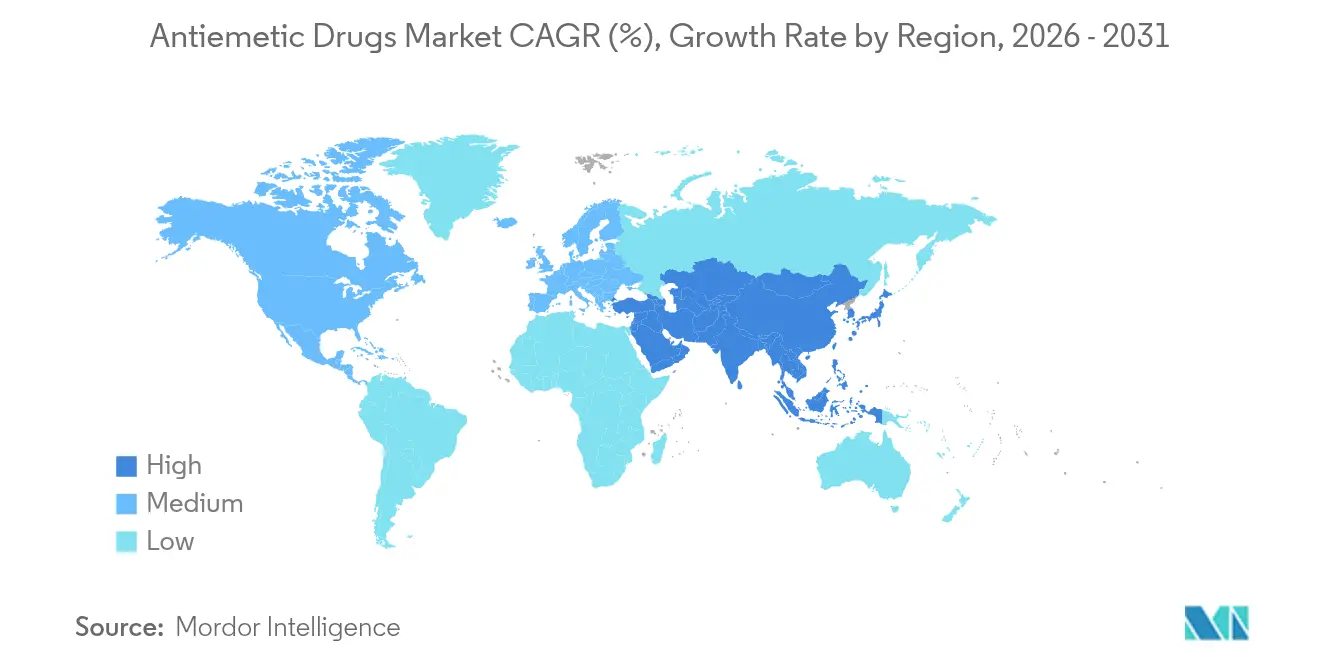
| Fastest Growing Market | Asia-Pacific |
| Largest Market | North America |
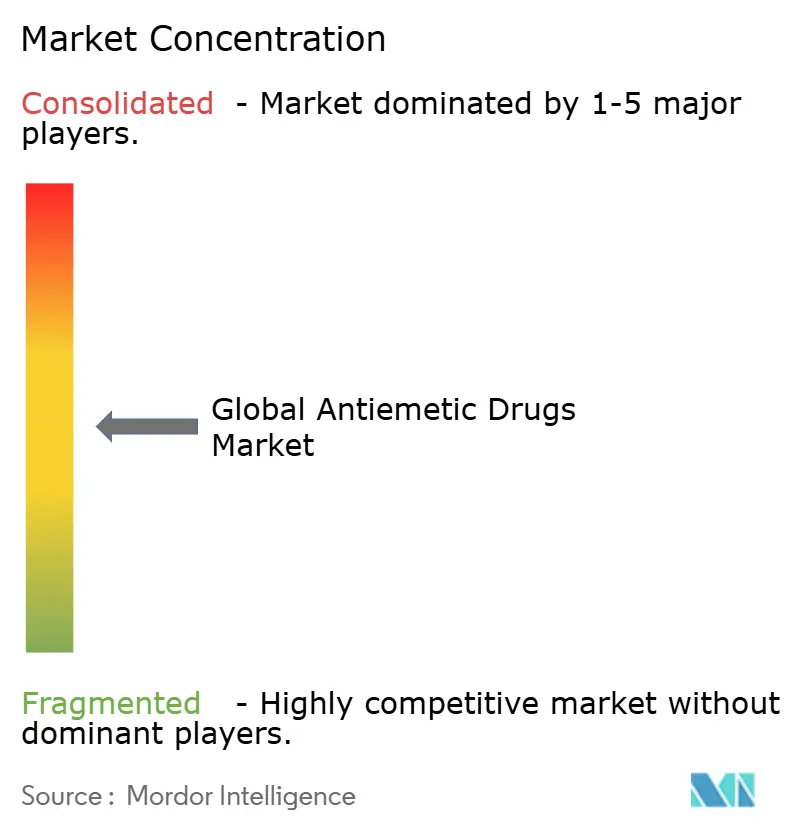
| Market Concentration | Medium |
Major Players *Disclaimer: Major Players sorted in no particular order Image © Mordor Intelligence. Reuse requires attribution under CC BY 4.0. | |
Global Antiemetic Drugs Market Analysis by Mordor Intelligence
The Antiemetics drugs market size is expected to grow from USD 7.74 billion in 2025 to USD 8.2 billion in 2026 and is forecast to reach USD 10.95 billion by 2031 at 5.92% CAGR over 2026-2031. Demand stays firm because clinicians still struggle to control nausea and vomiting in chemotherapy, surgery and other settings. Steady global cancer incidence, wider uptake of 5-HT₃ antagonists for post-operative care, and the arrival of AI-guided dosing platforms are pushing adoption. Pricing pressure from generics keeps therapy affordable in emerging economies, which broadens patient access. Digital pharmacy channels and ambulatory infusion centers are reshaping how antiemetics reach patients and are generating new product placement opportunities.
Key Report Takeaways
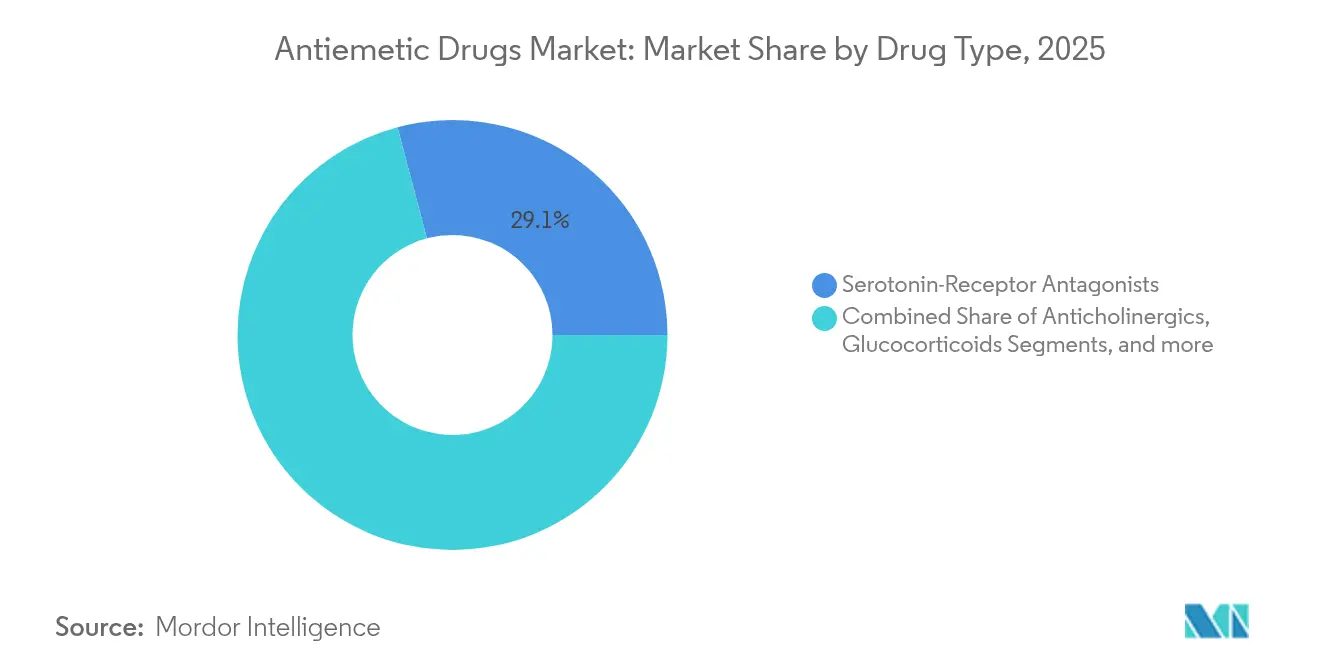
- By drug type, serotonin-receptor antagonists led with 29.12% revenue share in 2025; dopamine receptor antagonists are projected to expand at a 6.08% CAGR to 2031.
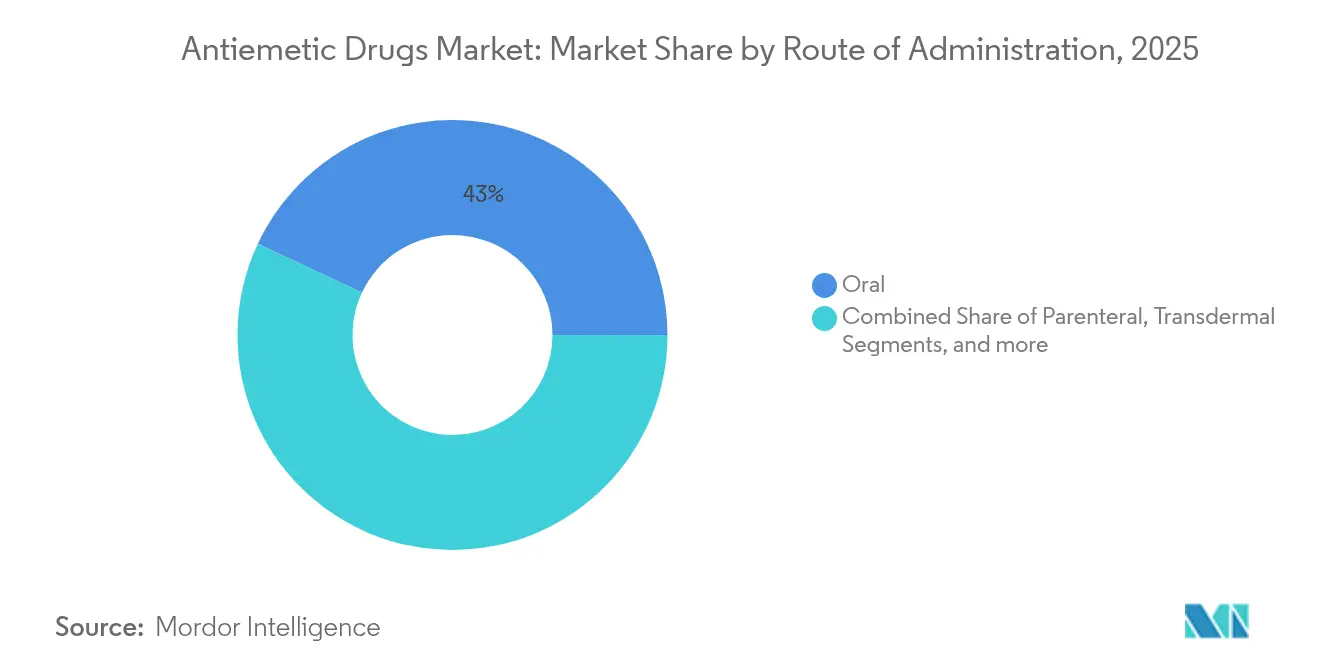
- By route of administration, oral formulations accounted for 43.02% of the Antiemetics drugs market share in 2025, while parenteral products are expected to grow at 6.01% through 2031.
- By application, chemotherapy held 32.06% share of the Antiemetics drugs market size in 2025 and post-operative use is advancing at a 6.21% CAGR through 2031.
- By distribution channel, retail pharmacies controlled 45.02% of revenue in 2025; online pharmacies carry the highest projected CAGR at 6.12% to 2031.
- North America captured 38.35% of regional revenue in 2025; Asia-Pacific is set to increase fastest with a 6.46% CAGR to 2031.
Note: Market size and forecast figures in this report are generated using Mordor Intelligence’s proprietary estimation framework, updated with the latest available data and insights as of 2026.
Market Trends and Insights
Drivers Impact Analysis of Global Antiemetic Drugs Market*
| Driver | % Impact on CAGR Forecast | Geographic Relevance | Impact Timeline |
|---|---|---|---|
| Rising incidence of chemotherapy-induced nausea & vomiting (CINV) | +1.2% | Global, with concentration in North America & Europe | Long term (≥ 4 years) |
| Growing clinical adoption of 5-HT₃ antagonists for post-operative nausea | +0.8% | North America & EU, expanding to APAC | Medium term (2-4 years) |
| Intensifying R&D and identification of novel antiemetic targets | +0.6% | Global, led by US and Japan | Long term (≥ 4 years) |
| Expansion of ambulatory infusion centres adopting antiemetic protocols | +0.5% | North America & EU, early adoption in urban APAC | Medium term (2-4 years) |
| Legalisation-led uptake of cannabinoid-based antiemetics | +0.4% | North America, select EU markets | Short term (≤ 2 years) |
| AI-driven predictive antiemetic dosing tools boosting adherence | +0.3% | Global, technology-forward markets first | Medium term (2-4 years) |
| Source: Mordor Intelligence | |||
Rising incidence of chemotherapy-induced nausea & vomiting
Cancer treatment volumes keep climbing, and up to 40% of patients still encounter breakthrough CINV despite triple-drug prophylaxis. Highly emetogenic regimens such as cisplatin-based protocols are most problematic. Aging populations in North America and Western Europe experience more severe symptoms because of polypharmacy and slower metabolism. China and India are scaling comprehensive cancer centres that routinely embed guideline-based antiemetic regimens, further lifting demand[1]Future Medicine, “Breakthrough CINV Despite Triple Therapy,” futuremedicine.com.
Growing clinical adoption of 5-HT₃ antagonists for post-operative nausea
Roughly one-third of surgical patients experience PONV, rising to 80% in high-risk laparoscopic or gynaecologic procedures. The US FDA issued draft guidance in October 2024 encouraging developers to pursue combination pharmacological approaches. European guidelines now favour long-acting 5-HT₃ agents such as palonosetron for ambulatory surgery, prompting hospitals to standardise on these newer formulations[2]European Society of Anaesthesiology and Intensive Care, “Fourth Consensus Guidelines on PONV,” esaic.org.
Intensifying R&D into novel antiemetic targets
Developers are exploring mechanisms beyond classic neurotransmitter blockade. GIP receptor agonists and GFRAL-RET antagonists show early activity in preclinical CINV models. Takeda advanced TAK-105 into Phase 1 studies while Japanese firms pursue next-generation NK₁ agents with superior pharmacokinetics.
Expansion of ambulatory infusion centres
Payers prefer outpatient chemotherapy because it cuts facility costs. Infusion networks now rely on electronic ordering systems that auto-recommend antiemetic prophylaxis by emetogenic risk tier. Effective CINV control reduces unscheduled emergency visits, saving thousands of dollars per episode and driving formulary adherence.
Restraints Impact Analysis of Global Antiemetic Drugs Market*
| Restraint | % Impact on CAGR Forecast | Geographic Relevance | Impact Timeline |
|---|---|---|---|
| Price erosion from generic competition | -0.9% | Global, most pronounced in developed markets | Short term (≤ 2 years) |
| Adverse drug reactions leading to discontinuation | -0.6% | Global, higher impact in elderly populations | Medium term (2-4 years) |
| API supply-chain fragility centred on limited Chinese plants | -0.4% | Global, supply chain dependent markets | Short term (≤ 2 years) |
| Oral neuro-stimulation wearables as non-pharma substitutes | -0.3% | North America & EU, tech-forward demographics | Medium term (2-4 years) |
| Source: Mordor Intelligence | |||
Price erosion from generic competition
Patent expiries on NK₁ antagonists and serotonin blockers trigger 80% price drops within two years of generic launch, squeezing branded margins and reshaping hospital formularies.
Adverse drug reactions prompting discontinuation
Sedation from olanzapine or extrapyramidal symptoms from dopamine blockers leads some patients to abandon therapy, especially seniors. QT prolongation concerns with certain 5-HT₃ agents further constrain use among cardiac-risk cohorts
*Our forecasts treat driver/restraint impacts as directional, not additive. The impact forecasts reflect baseline growth, mix effects, and variable interactions.
Global Antiemetic Drugs Market Segment Analysis
By Drug Type:
Serotonin dominance amid dopamine renaissanceSerotonin-receptor antagonists hold 29.12% of 2025 revenue, anchoring the Antiemetics drugs market through reliable efficacy and a mild safety profile. Dopamine antagonists now post the fastest 6.08% CAGR because olanzapine provides strong breakthrough-nausea relief. NK₁ agents remain the delayed-phase backbone, and glucocorticoids act as synergists. Innovation resides in GIP agonists and cannabinoid formats, which sit within the “others” category and point to future differentiation.
The serotonin class continues to enjoy wide reimbursement in hospital and retail settings, so substitution barriers are low. Dopamine antagonists gain share where payers value robust symptom control after standard prophylaxis fails. As generics proliferate, balanced multi-mechanism regimens that blend serotonin, dopamine and NK₁ blockade underpin clinical guidelines, giving entrenched brands a path to defend volume even as unit prices fall.


By Route of Administration:
Oral convenience drives leadershipOral dosing captured 43.02% of the Antiemetics drugs market in 2025 and should extend its lead due to patient preference and outpatient trends. Tablets or dissolvable films fit tele-oncology programs and keep nursing time low. Parenteral therapy remains essential during acute vomiting or when oral intake is impossible; recent lipid emulsion injectables supply fast onset with softer infusion-site profiles.
Transdermal and long-acting injectable formats are a small but fast-innovating slice. Depot products that cover multi-day chemotherapy windows cut pill burden, while on-body pumps support personalised titration. These platforms could raise both adherence and willingness to pay, helping manufacturers offset generic erosion in conventional presentations.
By Application:
Chemotherapy leadership with post-operative momentumChemotherapy held 32.06% of 2025 revenue and keeps the largest slice of the Antiemetics drugs market size because modern regimens still provoke severe nausea. Guideline-driven triple therapy underpins high per-patient spend. Post-operative use grows quickest at 6.21% CAGR as day-case surgeries rise and hospitals link PONV prevention to shorter stays.
Gastroenteritis and other everyday indications remain price-sensitive and dominated by generics. Radiation-induced nausea gains modest attention as precision radiotherapy regimens intensify. Motion sickness and pregnancy-related nausea see competition from wearable neuro-stimulation devices, nudging drug makers to invest in superior tolerability profiles.
By Distribution Channel:
Retail dominance faces digital disruptionRetail pharmacies owned 45.02% of 2025 sales, benefiting from established store networks and insurance billing. Online pharmacies, however, post a 6.12% CAGR, helped by telemedicine, e-prescribing, and home delivery convenience. Hospitals stay influential in formulary decisions for parenteral brands, but outpatient infusion centres increasingly buy direct from specialty distributors.
A unified pharmacy benefit and distribution model allows vertical integrators to negotiate sharper rebates, altering profit pools. Direct-to-patient digital portals also gather adherence data that feed AI analytics, letting manufacturers tailor support services and lift brand loyalty.
Geography Analysis
North America Antiemetic Drugs Market
North America controlled 38.35% of 2025 revenue through high cancer treatment volumes, insurance coverage for branded drugs, and early adoption of AI-supported dosing software. US FDA approvals such as APONVIE and CINVANTI often set global precedent, granting first launch advantage before generics arrive. Yet intensive price negotiation by pharmacy benefit managers forces companies to prove clinical differentiation or risk steep formulary discounts.
APAC Antiemetic Drugs Market
Asia-Pacific records the fastest 6.46% CAGR to 2031. Japan spurs innovation with next-generation NK₁ approvals like fosnetupitant, while China’s cancer centre expansion multiplies patient starts despite national pressure to procure generics. India’s biosimilar producers supply low-cost ondansetron and aprepitant, widening reach into tier-2 cities and supporting steady unit growth.
Europe Antiemetic Drugs Market
Europe offers a mature but stable outlook. EMA centralised review speeds pan-regional launches, yet country-level health technology assessments demand clear cost-effectiveness. Recent ESMO guideline updates stress patient-reported outcomes, urging makers to demonstrate better tolerability to secure premium tiers. Hospital tenders frequently bundle antiemetics with chemotherapy contracts, so suppliers position combination or long-acting products as value differentiators.

Competitive Landscape
Competition is moderately concentrated. No single firm surpasses 15% share because clinical guidelines call for multi-drug regimens, spreading revenue across mechanisms and manufacturers. Global majors such as Pfizer, Merck and GlaxoSmithKline contend with focused companies like Heron Therapeutics and Acacia Pharma. Branded players defend value with fixed-dose combinations, extended-release injectables and digital adherence platforms.
Patent cliffs through 2027 erode exclusivity for NK₁ and serotonin classes, shifting revenue to volume-driven generics. In response, innovators target new biology such as GIP or GFRAL-RET modulation, aiming for orphan or breakthrough designations to secure higher reimbursement. Digital alliances supply apps that predict nausea risk and recommend tailored dosing, underpinning service-oriented differentiation.
Geographic expansion is an essential lever. Multinationals license formulations to local partners in China or Brazil to enter price-controlled markets while retaining royalty streams. Private equity-backed infusion networks in the US sign product-specific supply deals, granting preferred placement for companies offering fulfilment support and real-world evidence dashboards. Supply-chain resilience also emerges as a badge of reliability amid geopolitical scrutiny of Chinese API plants, pushing some firms to dual-source ingredients in India or Europe.
Global Antiemetic Drugs Industry Leaders
Pfizer Inc
Johnson & Johnson Services Inc
Merck and Co Inc.
GSK plc
Sanofi S.A.
Merck & Co., Inc.
- *Disclaimer: Major Players sorted in no particular order
Global Antiemetic Drugs Market Companies Covered in this Report
- GlaxoSmithKline
- Pfizer
- Merck
- Johnson & Johnson
- Sanofi
- Hikma Pharmaceuticals
- Cipla
- Novartis
- Baxter
- Torrent Pharmaceuticals
- Teva Pharmaceutical Industries
- Aurobindo Pharma Ltd.
- Abbvie
- Bausch Health
- Eisai
- Dr. Reddy’s Laboratories Ltd.
- Sun Pharmaceuticals Industries
- Takeda Pharmaceuticals
- Lupin
- Fresenius

Recent Industry Developments in Global Antiemetic Drugs Market
- February 2025: Heron Therapeutics reported 2024 revenue of USD 144.2 million, a 14% rise, led by CINVANTI and APONVIE ramp-up.
- January 2025: FDA issued a complete response letter for Vanda’s TRADIPITANT capsules in gastroparesis due to insufficient safety and efficacy data.
- June 2024: EA Pharma licensed EA1080, an oral α4β7 integrin antagonist, from Ensho Therapeutics for inflammatory bowel disease, with Phase 2 trials planned in 2025.
- October 2024: FDA posted draft guidance encouraging multi-mechanism drug development for PONV prevention.


Global Antiemetic Drugs Market Report Scope and Research Methodology
Market Definition and Coverage
Our study defines the global antiemetic drugs market as all prescription and over-the-counter medicines that prevent or treat nausea or vomiting triggered by chemotherapy, gastroenteritis, surgery, pregnancy, and motion sickness. Values capture ex-manufacturer revenues flowing through hospital, retail, and online pharmacies in over 40 nations that together represent more than 95% of world oncology and surgical volumes.
Scope exclusion: products such as ginger supplements, acupressure devices, and medical cannabis sold solely through dispensaries are kept outside this assessment.
Segments Covered in This Report
- By Drug Type
- Serotonin-Receptor Antagonists
- Dopamine Receptor Antagonists
- Neurokinin-1 (NK₁) Receptor Antagonists
- Glucocorticoids
- Anticholinergics
- Others
- By Application
- Chemotherapy
- Gastroenteritis
- Post-Operative
- Others
- By Route of Administration
- Oral
- Parenteral
- Transdermal & Others
- By Distribution Channel
- Hospital Pharmacies
- Retail Pharmacies
- Online Pharmacies
- Geography
- North America
- United States
- Canada
- Mexico
- Europe
- Germany
- United Kingdom
- France
- Italy
- Spain
- Rest of Europe
- Asia-Pacific
- China
- Japan
- India
- South Korea
- Australia
- Rest of Asia-Pacific
- Middle East and Africa
- GCC
- South Africa
- Rest of Middle East and Africa
- South America
- Brazil
- Argentina
- Rest of South America
- North America
Data Sources, Market Sizing, and Validation
Primary Research
We spoke with hospital pharmacists, oncologists, anesthetists, and payor advisers across North America, Europe, and key Asian economies. Their feedback confirmed guideline-driven regimen shifts, off-label adoption levels, and expected generic price erosion, helping us fine-tune demand multipliers and validate ASP ranges.
Desk Research
We reviewed WHO cancer incidence files, OECD surgical discharge datasets, United Nations population revisions, national formularies, and the FDA Orange Book to map treated patient pools. Trade briefs from the International Society of Oncology Pharmacy Practitioners and the American Gastroenterological Association supplied dosage norms. Company 10-Ks, investor decks, and pricing disclosures, enriched with Dow Jones Factiva news scans and D&B Hoovers financials, informed average selling price (ASP) trends. The sources named illustrate the breadth consulted, and several additional repositories were checked for consistency.
Market-Sizing & Forecasting
A top-down model begins with annual chemotherapy cycles, inpatient surgery counts, gastroenteritis case notifications, and motion sickness script volumes. After applying treatment penetration ratios, we multiply resulting unit demand by blended ASPs. Supplier roll-ups for a dozen major manufacturers and channel checks act as a bottom-up sense check before adjustments. Forecasts rely on multivariate regression that links demand drivers to projected cancer incidence, procedure growth, generic penetration, and inflation-adjusted pricing controls. Regional benchmarks guide allocation where country inputs remain sparse.
Data Validation & Update Cycle
Outputs undergo two-layer analyst review; anomalies trigger re-contact with experts and cross-checks against independent prescription databases. Mordor updates each model annually and issues interim refreshes when significant launches, recalls, or reimbursement shifts emerge.
How Mordor Intelligence's Global Antiemetic Drugs Market Size Compares to Other Published Estimates
Published estimates often diverge because firms choose different indications, channel mixes, and currency assumptions.
By anchoring figures to treated patient volumes, yearly ASP audits, and continual primary validation, Mordor Intelligence offers a balanced baseline that planners can trust.
Benchmark comparison
| Market Size | Anonymized source | Primary gap driver |
|---|---|---|
| USD 7.74 B (2025) | Mordor Intelligence | - |
| USD 7.90 B (2024) | Global Consultancy A | excludes OTC segments and uses older currency rates |
| USD 8.12 B (2024) | Industry Portal B | assumes flat price erosion with no primary validation |
| USD 6.44 B (2025) | Regional Consultancy C | covers limited regions and omits motion sickness demand |
Differences stem mainly from omitted channels, untested erosion curves, or narrow geography cuts.
By grounding every step in transparent variables and multi-source checks, Mordor Intelligence delivers a dependable view for strategic decisions.


Key Questions Answered in the Report
What is the current size of the Antiemetics drugs market?
The market is valued at USD 8.2 billion in 2026 and is poised to reach USD 10.95 billion by 2031.
Which drug class leads revenue in the Antiemetics drugs market?
Serotonin-receptor antagonists hold the top position with 29.12% share in 2025.
Which application segment is growing fastest?
Post-operative nausea and vomiting shows the highest CAGR at 6.21% through 2031.
Why are online pharmacies gaining ground?
Digital channels offer price transparency, home delivery and integration with telemedicine, supporting a 6.12% CAGR.
Which region will expand most quickly?
Asia-Pacific is projected to grow at 6.46% CAGR owing to large patient pools and rising healthcare spending.
How are companies defending against generic erosion?
Firms invest in long-acting formulations, combination products and digital dosing tools to sustain brand value.
Page last updated on:


