Immunomodulators Market Size and Share
Market Overview
| Study Period | 2020 - 2031 |
|---|---|
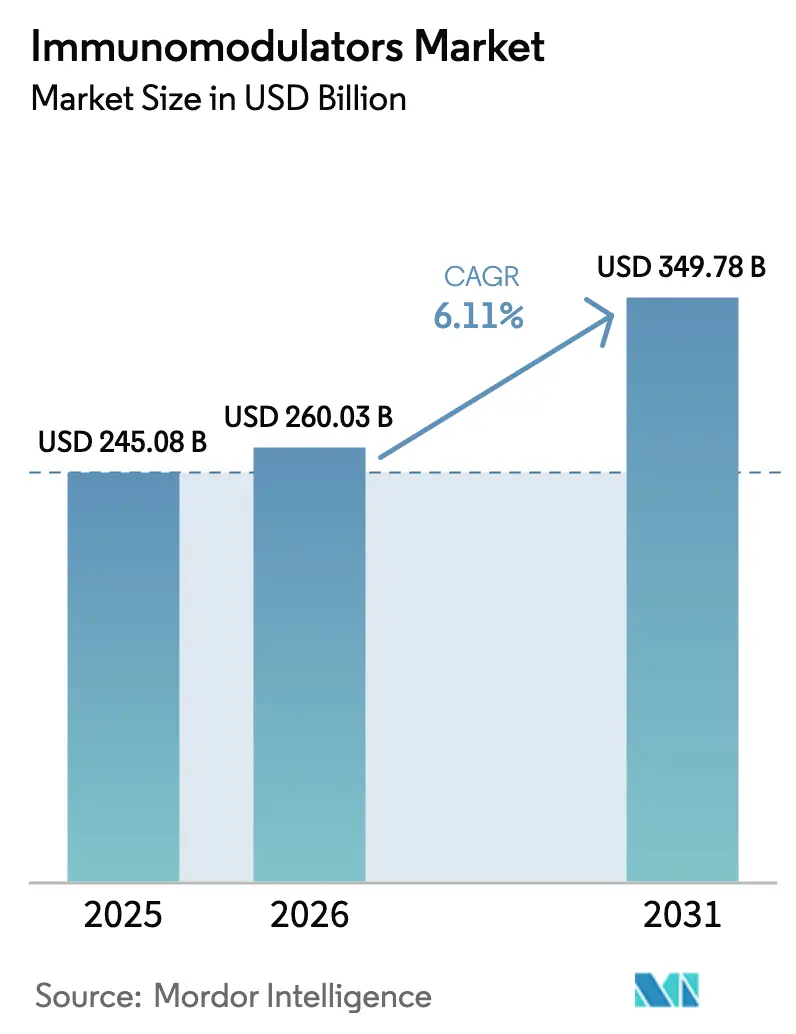
| Market Size (2026) | USD 260.03 Billion |
| Market Size (2031) | USD 349.78 Billion |
| Growth Rate (2026 - 2031) | 6.11% CAGR |
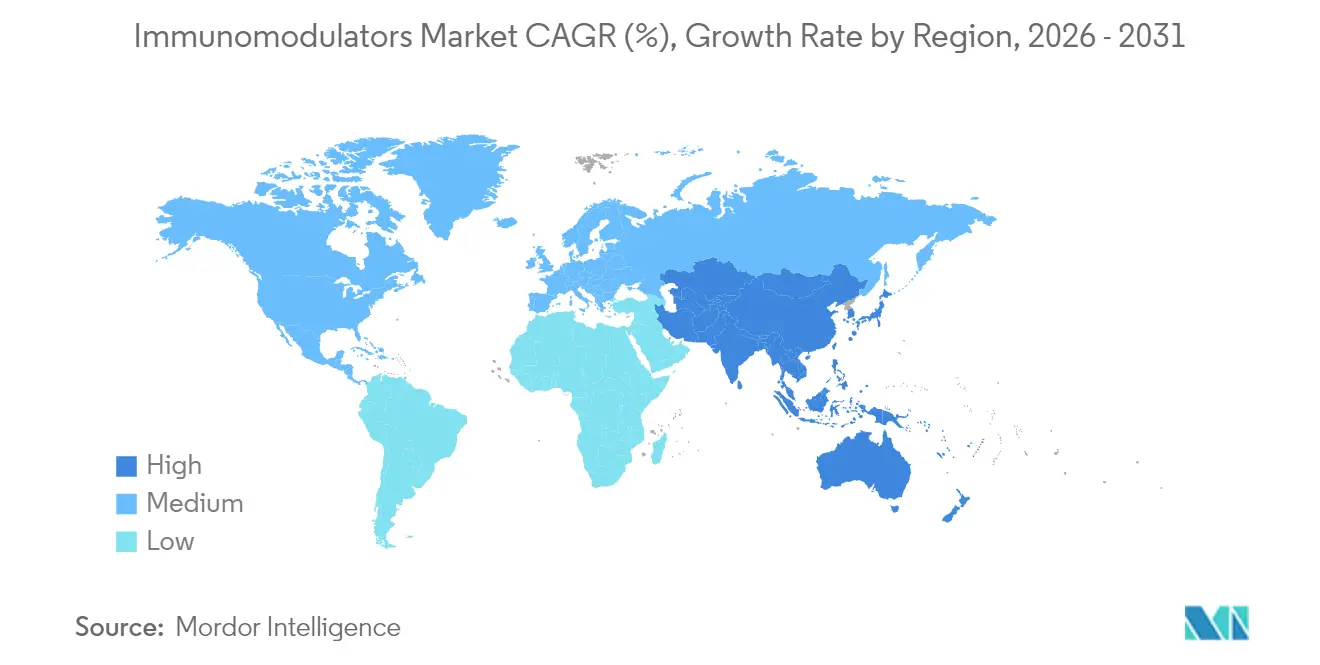
| Fastest Growing Market | Asia-Pacific |
| Largest Market | North America |
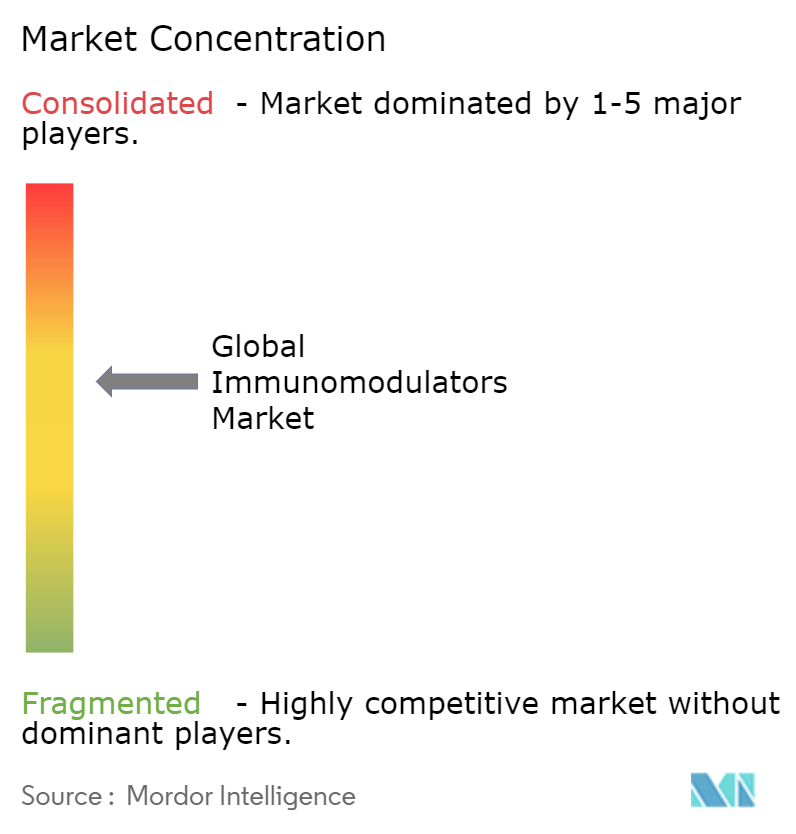
| Market Concentration | Medium |
Major Players *Disclaimer: Major Players sorted in no particular order Image © Mordor Intelligence. Reuse requires attribution under CC BY 4.0. | |
Immunomodulators Market Analysis by Mordor Intelligence
Immunomodulators market size in 2026 is estimated at USD 260.03 billion, growing from 2025 value of USD 245.08 billion with 2031 projections showing USD 349.78 billion, growing at 6.11% CAGR over 2026-2031. Strong uptake of targeted immunotherapy in oncology and autoimmune care anchors this growth. Post-COVID fast-track pathways, wider biosimilar entry, and enterprise investment in cell-based technologies keep momentum high. Competitive pressure from biosimilars narrows prices while raising patient access. Geographic expansion is uneven: North America remains the revenue hub yet Asia-Pacific posts the quickest gains on manufacturing scale-up and regulatory harmonization. Technology pipelines now favor receptor blockade and emerging epigenetic approaches that recalibrate immune cell programming.
Key Report Takeaways
- By product type, immunosuppressants led with 50.62% revenue share in 2025; immunostimulants are advancing at a 9.74% CAGR through 2031.
- By mechanism of action, cell-surface receptor blockade captured 41.88% share in 2025; epigenetic modulation is projected to expand at a 9.21% CAGR to 2031.
- By application, oncology commanded 45.77% of the immunomodulators market share in 2025; HIV treatment is growing fastest at 7.52% CAGR to 2031.
- By end-user, hospitals accounted for 62.78% of the immunomodulators market size in 2025; home-care settings are rising at a 9.14% CAGR.
- By route of adminstration, oral accounted for 54.69% of the immunomodulators market size in 2025; parenteral are rising at a 7.96% CAGR.
- By geography, North America led with a 38.02% revenue share in 2025, while Asia-Pacific is forecast to expand at 7.48% through 2031.
Note: Market size and forecast figures in this report are generated using Mordor Intelligence’s proprietary estimation framework, updated with the latest available data and insights as of 2026.
Global Immunomodulators Market Trends and Insights
Driver Impact Analysis*
| Drivers Impact Analysis | (~) % Impact on CAGR Forecast | Geographic Relevance | Impact Timeline |
|---|---|---|---|
| Rising burden of cancer & autoimmune diseases | +1.8% | Global, aging populations | Long term (≥ 4 years) |
| Growing investment in biologics R&D | +1.2% | North America & EU, expanding to APAC | Medium term (2-4 years) |
| Adoption of targeted immunotherapy over conventional care | +1.5% | Global, led by developed markets | Medium term (2-4 years) |
| AI-enabled discovery of next-gen immunomodulators | +0.9% | North America, EU, select APAC hubs | Long term (≥ 4 years) |
| Uptake of companion-diagnostic biomarkers for precision dosing | +0.7% | Developed markets | Medium term (2-4 years) |
| Post-COVID fast-track pathways for antiviral immunomodulators | +0.4% | Global, regulator dependent | Short term (≤ 2 years) |
| Source: Mordor Intelligence | |||
Rising Burden of Cancer & Autoimmune Diseases
Global cancer incidence is climbing, with the International Agency for Research on Cancer projecting 35 million new cases by 2050, a 77% jump on 2022. Autoimmune prevalence also rises; the National Institutes of Health reports that 50 million Americans live with autoimmune disorders. Older populations in developed economies and improved diagnostics in emerging regions converge to enlarge the candidate pool for immune-centric therapy. Precision medicines that zero in on molecular drivers gain favor as conventional chemotherapy shows lower tolerance and efficacy.
Adoption of Targeted Immunotherapy Over Conventional Care
Checkpoint inhibitor combinations deliver superior benefit-risk profiles compared with cytotoxic regimens. In the Phase III IMforte study, Roche’s Tecentriq plus lurbinectedin cut progression risk by 46% in extensive-stage small-cell lung cancer while preserving manageable safety requirements. Subcutaneous variants such as Tecentriq Hybreza trim clinic time to seven minutes, improving compliance and resource use. A Memorial Sloan Kettering trial of dostarlimab achieved a 100% complete response in mismatch-repair-deficient rectal cancer, eliminating surgery for most participants.
AI-Enabled Discovery of Next-Gen Immunomodulators
Artificial intelligence reached a milestone when rentosertib became the first AI-discovered drug to record clinical efficacy in idiopathic pulmonary fibrosis, improving forced vital capacity during Phase 2a. Generative platforms now cut preclinical cycles by up to 60%. Firms such as Repertoire Immune Medicines employ computational mapping of immune synapses to reveal T-cell targets previously out of reach. Yet immune complexity means that only organizations with deep datasets and domain expertise can fully exploit AI’s promise.
Uptake of Companion-Diagnostic Biomarkers for Precision Dosing
Healthcare systems with advanced lab capacity are adopting biomarker-guided dosing to maximize response and limit toxicity. PD-L1 expression testing now steers checkpoint inhibitor use, while molecular assays for cytokine levels refine dosing of interleukin blockers. Improved stratification underpins pay-for-performance contracts, strengthening value arguments for premium drugs[1]U.S. Food and Drug Administration, “Safety Communication on CAR-T Cell Therapies,” fda.gov.
Restraints Impact Analysis*
| Restraints Impact Analysis | (~) % Impact on CAGR Forecast | Geographic Relevance | Impact Timeline |
|---|---|---|---|
| Stringent regulatory guidelines | -1.1% | Global, varied by jurisdiction | Long term (≥ 4 years) |
| High cost of treatment | -0.8% | Price-sensitive markets | Medium term (2-4 years) |
| Biosimilar price erosion pressure | -0.6% | Developed markets | Short term (≤ 2 years) |
| Immunotoxicity-driven label warnings | -0.3% | Global, safety-focused regulators | Medium term (2-4 years) |
| Source: Mordor Intelligence | |||
High Cost of Treatment
Johnson & Johnson’s Stelara lists at about USD 13,000 per syringe even as biosimilars near. Insurance outlays also cover diagnostics and long-term monitoring. Biosimilar entry eased prices: adalimumab follow-ons now hold 23% share and cut average costs by up to 66%. Still, budget constraints limit uptake in emerging regions, prompting value-based contracts in data-rich health systems[2]The Center for Biosimilars, “Adalimumab Biosimilar Uptake and Pricing,” centerforbiosimilars.com.
Biosimilar Price Erosion Pressure
Patent cliffs for blockbuster antibodies accelerate price competition. Samsung Bioepis documented oncology biosimilar penetration of 81% within five years, a trend that slices margins but broadens access. Innovators respond with formulation upgrades and next-gen assets that lean on accumulated brand trust[3]Samsung Bioepis, “Five-Year Biosimilar Market Performance Report,” samsungbioepis.com.
*Our forecasts treat driver/restraint impacts as directional, not additive. The impact forecasts reflect baseline growth, mix effects, and variable interactions.
Segment Analysis
By Product Type: Immunostimulants Drive Innovation Despite Suppressant Dominance
Immunosuppressants generated 50.62% of 2025 revenue, anchoring the immunomodulators market. Mainstays such as calcineurin and mTOR inhibitors remain essential after organ transplants, and monoclonal antibodies sustain uptake in chronic autoimmune care. Biosimilar arrivals for ustekinumab and adalimumab are reshaping price elasticity yet volumes hold steady. In contrast, immunostimulants chart a 9.74% CAGR to 2031. Breakthroughs in CAR-T, checkpoint agonists, and IL-15 derivatives expand the clinical footprint across solid tumors. Approval of ImmunityBio’s ANKTIVA, the first IL-15 agonist, with 71% bladder-cancer complete response rates, highlights the category’s rapid pace.
The immunomodulators market size for immunostimulants is set to jump markedly as oncology regimens shift from cytotoxic protocols toward immune activation. Innovation variety spans vaccine adjuvants, TLR agonists, and bispecific engagers. Although safety monitoring is intense, patient demand for durable responses bolsters uptake. As biosimilars compress suppressive-therapy margins, innovators lean on immunostimulants to rebuild growth. The immunomodulators market continues to see balanced portfolios that hedge price erosion with next-generation assets.


By Mechanism of Action: Receptor Blockade Leadership Faces Epigenetic Challenge
Cell-surface receptor blockade held 41.88% share in 2025, reflecting clinician familiarity and predictable dosing. Programs targeting PD-1, CTLA-4, and IL-6 show well-charted benefit-risk ratios, which eases payer acceptance. Still, epigenetic modulation posts the fastest 9.21% CAGR as companies pioneer agents that reset immune cell gene expression. These assets aim for durable remission with lower maintenance dosing.
Within the immunomodulators industry, cytokine modulators and JAK inhibitors keep steady growth, although biosimilar challenge cools pricing. Epigenetic drugs, often small molecules, promise oral delivery and broader tissue penetration. Early data from MDPI-reported trials indicate meaningful reduction in autoimmune flares while sparing systemic immunity mdpi.com. If safety signals remain favorable, epigenetic options could move upstream in treatment lines and lift the overall immunomodulators market.
By Application: Oncology Dominance Challenged by HIV Acceleration
Oncology retained 45.77% of 2025 revenue thanks to checkpoint inhibitor breadth, CAR-T approvals, and combination regimens that now permeate earlier cancer stages. High unmet need and premium pricing maintain revenue scale. Yet the HIV segment is accelerating at 7.52% CAGR through 2031 on long-acting immunomodulators that target viral reservoirs. Cabotegravir precedents validate demand for infrequent dosing, and pipeline IL-2 variants aim to restore immune surveillance.
The immunomodulators market size for HIV remains smaller than oncology, but growth outpaces mature segments. Autoimmune applications keep a diverse pipeline with multiple sclerosis and inflammatory bowel disease leading trial activity. Respiratory and transplant indications add steady volume. Publications in Frontiers in Immunology confirm rising interest in immune-restorative strategies that work alongside antiretrovirals.
By End-User: Hospital Dominance Yields to Home-Care Innovation
Hospitals still manage 62.78% of doses due to safety monitoring for cell therapies and high-risk infusions. However, home-care is expanding fastest at 9.14% CAGR. Subcutaneous formulations, on-body pumps, and tele-pharmacovigilance lower site-of-care barriers. Roche’s Tecentriq Hybreza saw 71% patient preference for at-home administration, showcasing demand for convenience.
Specialty clinics provide a bridge with infusion suites and on-site diagnostics. The immunomodulators market share for hospital channels will gradually slide as payers press for outpatient savings. Device innovation, including EnFuse’s wearable injector for pegcetacoplan with 60% uptake four months post-launch, underlines confidence in self-dosing models.

By Route of Administration: Oral Convenience Meets Parenteral Innovation
Oral agents commanded 54.69% share in 2025. Adherence ease and steady pharmacokinetics support frontline use in chronic diseases. Nonetheless, parenteral formats record an 7.96% CAGR as subcutaneous technology blends precision with at-home comfort. More than 180 high-volume subcutaneous biologics are in clinical stages, accommodating doses up to 20 mL without IV lines.
Topical products remain niche but valued for localized effect in dermatology and ophthalmology. The immunomodulators industry now witnesses cross-channel cannibalization where subcutaneous injection competes directly with oral convenience. Ongoing device refinement and formulation science will decide the eventual channel balance.
Geography Analysis
North America produced 38.02% of 2025 revenue on the back of deep R&D pipelines, robust payer frameworks, and swift FDA review programs. The region retains leadership in checkpoint inhibitors and CAR-T production capacity. Biosimilar penetration, exemplified by 23% adalimumab share, pressures pricing yet broadens reach. Major acquisitions like Merck’s USD 10.8 billion purchase of Prometheus Biosciences reaffirm strategic intent to command inflammatory bowel disease therapy lanes.
Asia-Pacific is the fastest-growing region at 7.48% CAGR. China and India ramp biologic manufacturing with government incentives, while Japan sponsors mRNA and cell-therapy hubs. Regulators across APAC adopt reference pathways harmonized with ICH guidelines that shorten dossier reviews without cutting safety thresholds. As regional incomes lift, payer budgets widen, enabling uptake of innovative immunomodulators market offerings.
Europe advances steadily under the EMA’s centralized procedure and aggressive biosimilar policy. Twenty-eight biosimilar opinions issued in 2024, including four ustekinumab copies, extend immunomodulator reach while curbing spend. Roche’s fenebrutinib and Novartis’s iscalimab head a pipeline focused on tolerance induction. Markets in the Middle East and Africa are smaller but grew 17% year over year in antineoplastic and immunomodulator categories, driven by Saudi Arabia’s oncology investment and UAE cancer center expansion. ImmunityBio’s Cancer BioShield partnership with Saudi authorities signals rising demand for advanced immune therapies in these locales.

Competitive Landscape
The immunomodulators market features high entry barriers due to capital intensity and complex manufacturing. Roche, Bristol Myers Squibb, Novartis, and Merck anchor leadership by blending oncology flagships with autoimmune franchises. Deal flow accelerated in 2024–2025 as big pharma closed gaps through bolt-on acquisitions. Sanofi’s USD 1.9 billion bid for Dren Bio’s DR-0201 and AbbVie’s USD 137.5 million Landos Biopharma buy highlight hunger for differentiated immune science.
Platform strategies gain weight. Repertoire Immune Medicines licenses its DECODE engine to Genentech and Bristol Myers Squibb in deals topping USD 2.5 billion, enabling partners to fast-track multi-asset pipelines. Biosimilar specialists Samsung Bioepis and Sandoz widen market access, holding 53% combined share in mature antibody classes and driving price relief for payers.
White-space pursuit now centers on rare autoimmune disorders and pediatric indications where unmet need is high and competition thin. Firms also test combo regimens that unite checkpoint blockade with anti-inflammatory agents to temper toxicity. Moderna’s mNEXSPIKE approval shows that vaccine platforms can pivot swiftly to new variants, offering a template for immunomodulator portfolios to tackle emerging threats.
Immunomodulators Industry Leaders
F. Hoffmann-La Roche Ltd
Bristol-Myers Squibb Co.
Novartis AG
Merck & Co., Inc.
Amgen Inc.
- *Disclaimer: Major Players sorted in no particular order

Recent Industry Developments
- June 2025: F. Hoffmann-La Roche Ltd reported Phase III IMforte data showing Tecentriq plus lurbinectedin cut progression risk by 46% and death risk by 27% in extensive-stage small-cell lung cancer.
- March 2025: Biocon received European Medicines Agency approval for its tocilizumab biosimilar, expanding its immunology portfolio.
- May 2025: FDA cleared Moderna’s next-generation COVID-19 vaccine mNEXSPIKE for high-risk adults, displaying 9.3% higher efficacy versus mRNA-1273.
- March 2025: Sanofi finalized its USD 1.9 billion acquisition of Dren Bio’s CD20 bispecific DR-0201.
- February 2025: Johnson & Johnson’s nipocalimab entered FDA Priority Review for generalized myasthenia gravis.


Research Methodology Framework and Report Scope
Market Definitions and Key Coverage
Our study defines the immunomodulators market as all prescription biopharmaceutical and small-molecule agents that purposefully suppress or stimulate systemic immune pathways to manage oncology, autoimmune, transplant, respiratory, and HIV indications in inpatient and outpatient care worldwide. According to Mordor Intelligence, molecules still in clinical trials are excluded unless commercial sales were booked in the base year.
Scope Exclusion: Over-the-counter herbal boosters and dietary supplements are not quantified.
Segmentation Overview
- By Product Type
- Immunosuppressants
- Corticosteroids
- Calcineurin Inhibitors
- mTOR Inhibitors
- Anti-proliferative Agents
- Monoclonal Antibodies
- Immunostimulants
- Cytokines & Interleukins
- Checkpoint Agonists
- Vaccine Adjuvants
- Toll-like Receptor Agonists
- Small-molecule Modulators
- Immunosuppressants
- By Mechanism of Action
- Cytokine Modulation
- Cell-surface Receptor Blockade
- Signal-transduction Inhibition
- Epigenetic Modulation
- By Application
- Oncology
- Autoimmune Disorders
- Rheumatoid Arthritis
- Multiple Sclerosis
- Inflammatory Bowel Disease
- Systemic Lupus Erythematosus
- Respiratory
- HIV
- Other Applications
- By End-User
- Hospitals
- Specialty Clinics
- Home-care Settings
- Other End-Users
- By Route of Administration
- Parenteral
- Oral
- Topical
- Geography
- North America
- United States
- Canada
- Mexico
- Europe
- Germany
- United Kingdom
- France
- Italy
- Spain
- Rest of Europe
- Asia-Pacific
- China
- Japan
- India
- Australia
- South Korea
- Rest of Asia-Pacific
- Middle East & Africa
- GCC
- South Africa
- Rest of Middle East & Africa
- South America
- Brazil
- Argentina
- Rest of South America
- Rest of Africa
- North America
Detailed Research Methodology and Data Validation
Primary Research
Mordor analysts interviewed hospital pharmacists, transplant surgeons, oncologists, and reimbursement advisors across North America, Europe, Asia-Pacific, and the Gulf. These conversations confirmed real-world dosing volumes, biosimilar conversion rates, typical treatment durations, and channel mark-ups, closing gaps that desk work alone could not fill.
Desk Research
We began with open datasets from WHO Global Health Observatory, UN Population Division, FDA and EMA approvals, and OECD HealthStats, then layered insights from peer-reviewed journals such as The Lancet and Nature Reviews Drug Discovery. Trade bodies like the Transplantation Society provided transplant counts, while association portals on rheumatoid arthritis and multiple sclerosis supplied patient prevalence. Company 10-Ks, investor decks, and clinical-trial registries clarified launch timelines and pricing. Paid resources including D&B Hoovers and Dow Jones Factiva enriched revenue splits and competitive moves. This roster is illustrative; many additional sources underpinned every data point we validated.
Market-Sizing & Forecasting
A top-down incidence-to-therapy-uptake model converts treated patient pools by indication into dollar demand, then aligns them with sampled ASP × volume snapshots from distributor audits to provide a bottom-up sense check. Core variables include cancer prevalence, autoimmune diagnosis rates, annual organ transplant counts, biologic-to-small-molecule mix, and branded-to-biosimilar price erosion. Multivariate regression, supplemented by scenario analysis for patent cliffs, projects these drivers through 2030, with assumptions validated by our primary interviews whenever public data are thin.
Data Validation & Update Cycle
Outputs face variance checks against historic sales trends, prescription audits, and macro health-spend indicators before a senior analyst signs off. We refresh the model every twelve months and reopen it mid-cycle if major regulatory approvals or safety withdrawals materially shift market dynamics, ensuring clients always receive the latest calibrated view.
Why Mordor's Immunomodulators Baseline Commands Reliability
Published estimates often diverge because firms adopt dissimilar therapeutic baskets, currency bases, or patent-loss timing.
Key gap drivers for this market include whether pipeline drugs are counted, how average selling prices are deflated, and the refresh cadence each publisher follows.
Benchmark comparison
| Market Size | Anonymized source | Primary gap driver |
|---|---|---|
| USD 245.08 B (2025) | Mordor Intelligence | - |
| USD 229.40 B (2024) | Global Consultancy A | Omits emerging biosimilars; relies on wholesale prices only |
| USD 217.70 B (2023) | Trade Journal B | Older base year; excludes HIV therapeutics |
| USD 285.01 B (2027) | Regional Consultancy C | Rolls forward pipeline launches without attrition discount |
The comparison shows that our disciplined scope selection, annual updates, and dual validation deliver a balanced, transparent baseline that decision-makers can replicate and trust.


Key Questions Answered in the Report
What is the current size of the immunomodulators market?
The immunomodulators market size reached USD 260.03 billion in 2026 and is expected to climb to USD 349.78 billion by 2031 on a 6.11% CAGR.
Which product category is growing fastest?
Immunostimulants are expanding at a 9.74% CAGR, fueled by checkpoint inhibitor combos, CAR-T cell therapies, and IL-15 agonists.
Why is Asia-Pacific the fastest-growing region?
Regulatory streamlining, fortified manufacturing capacity, and higher healthcare investment push Asia-Pacific growth at a 7.48% CAGR through 2031.
How do biosimilars influence market pricing?
Biosimilar penetration, such as 23% share for adalimumab copies, has reduced prices by up to 66% in developed markets, broadening patient access.
What are key safety concerns for new immunomodulators?
Regulators now mandate black-box warnings and lifelong monitoring for certain CAR-T therapies due to risks of T-cell malignancies and other immunotoxicities.
Which end-user setting is gaining ground?
Home-care administration leads growth at 9.14% CAGR, enabled by subcutaneous formulations and wearable injectors that shorten clinic visits.
Page last updated on:


