Immune Checkpoint Inhibitors Market Size and Share
Market Overview
| Study Period | 2020 - 2031 |
|---|---|
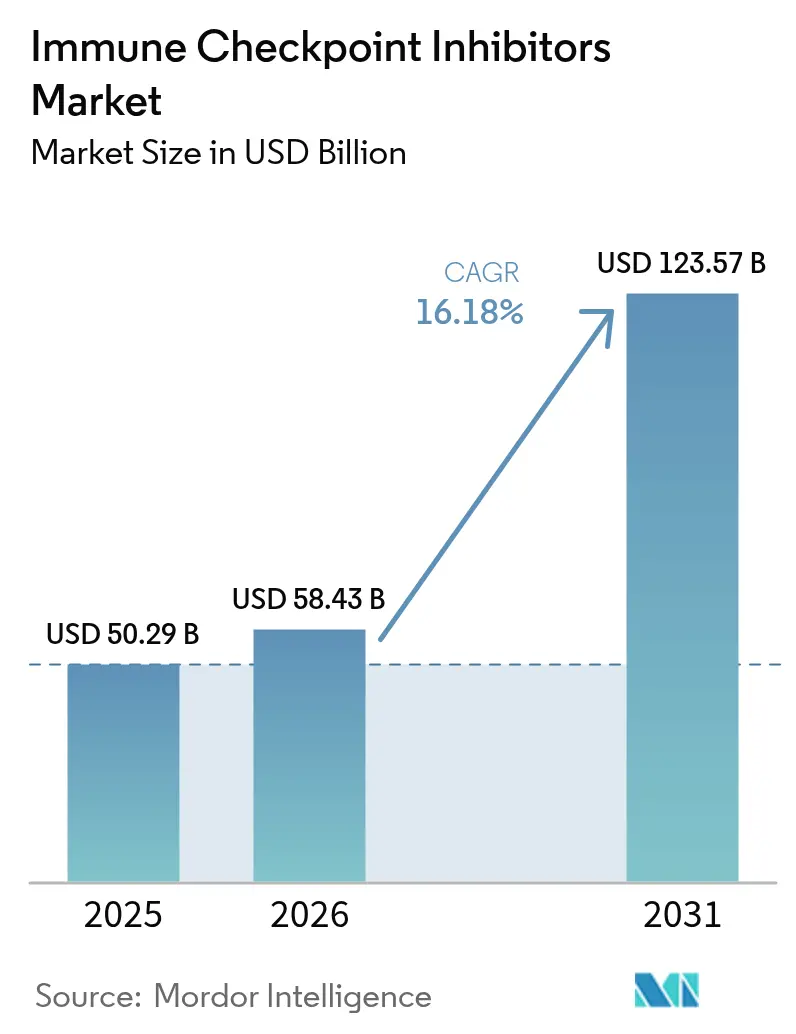
| Market Size (2026) | USD 58.43 Billion |
| Market Size (2031) | USD 123.57 Billion |
| Growth Rate (2026 - 2031) | 16.18% CAGR |
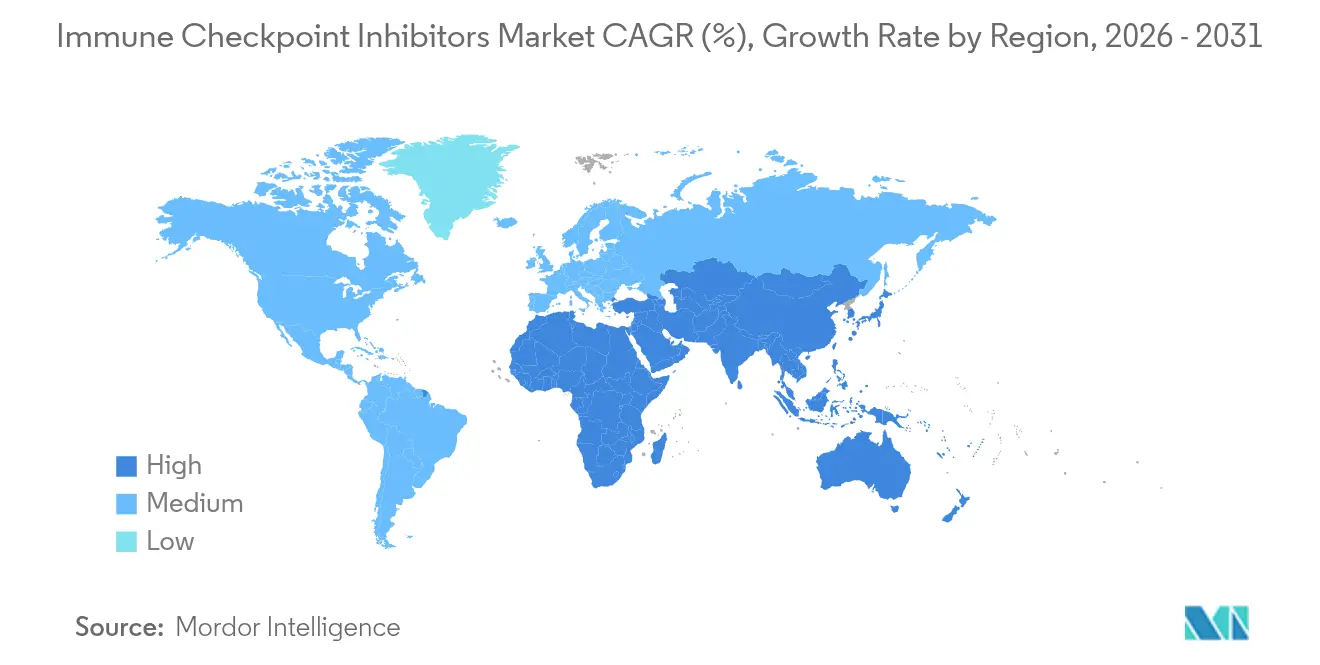
| Fastest Growing Market | Asia Pacific |
| Largest Market | North America |
| Market Concentration | Medium |
Major Players *Disclaimer: Major Players sorted in no particular order Image © Mordor Intelligence. Reuse requires attribution under CC BY 4.0. | |
Immune Checkpoint Inhibitors Market Analysis by Mordor Intelligence
The Immune Checkpoint Inhibitors market size is expected to grow from USD 50.29 billion in 2025 to USD 58.43 billion in 2026 and is forecast to reach USD 123.57 billion by 2031 at 16.18% CAGR over 2026-2031.
Growth rests on broadening regulatory approvals, rapid uptake of combination regimens, and next-generation targets such as LAG-3, TIGIT, and TIM-3. Subcutaneous formulations that free up infusion chairs, AI-guided biomarker discovery that lifts response rates, and the shift of therapies into perioperative settings continue to expand eligible patient pools. Mounting M&A activity, exemplified by Sun Pharmaceutical’s USD 416 million acquisition of Checkpoint Therapeutics, underscores the strategic importance of late-stage assets. Asia’s accelerating adoption, tight U.S. pricing dynamics, and the arrival of biosimilars will reshape competitive tactics through 2030.
Key Report Takeaways
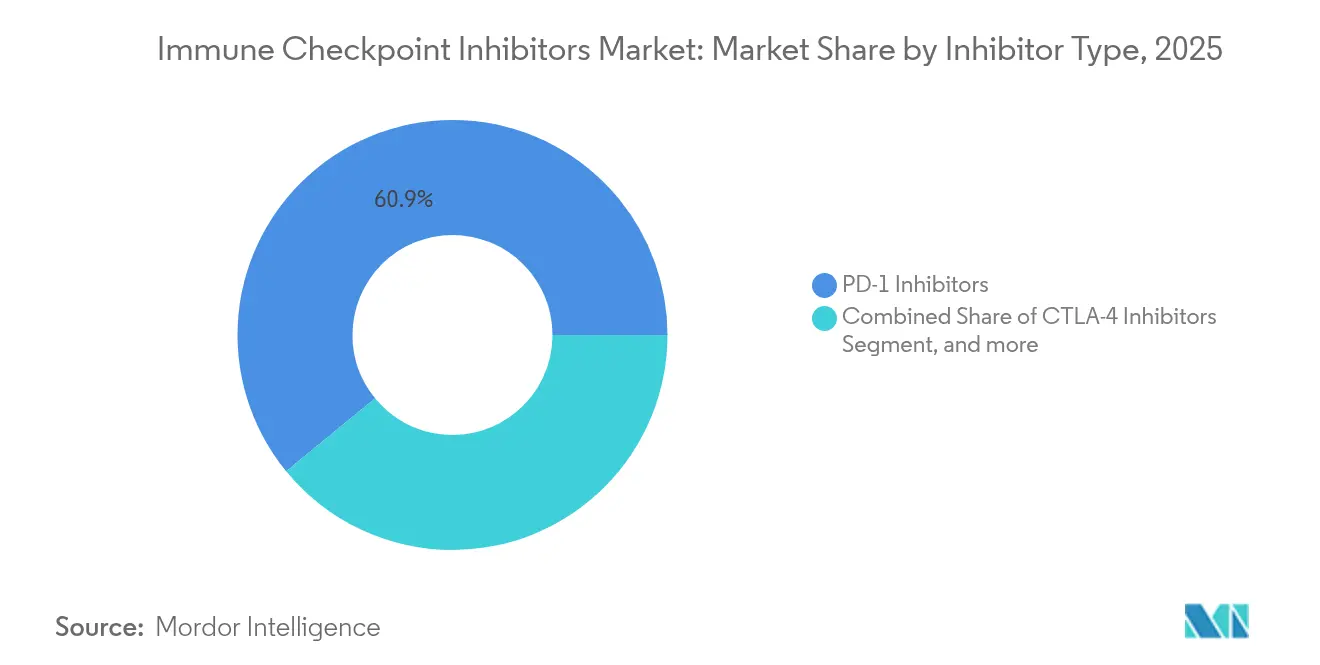
- By inhibitor type, PD-1 molecules led with 60.92% revenue share of the immune checkpoint inhibitors market in 2025, while LAG-3 assets are projected to expand at a 17.49% CAGR to 2031.
- By indication, non-small cell lung cancer held 26.34% of the immune checkpoint inhibitors market share in 2025, whereas small cell lung cancer is advancing at a 22.55% CAGR through 2031.
- By route of administration, intravenous delivery accounted for 67.95% of the immune checkpoint inhibitors market size in 2025; subcutaneous formats are set to grow at 25.4% CAGR to 2031.
- By distribution channel, hospital pharmacies retained 56.88% share of the immune checkpoint inhibitors market size in 2025; online pharmacies post a 19.95% CAGR forecast to 2031.
- By region, North America captured 36.74% share in 2025, while Asia–Pacific is projected to expand at 19.56% CAGR through 2031.
Note: Market size and forecast figures in this report are generated using Mordor Intelligence’s proprietary estimation framework, updated with the latest available data and insights as of 2026.
Global Immune Checkpoint Inhibitors Market Trends and Insights
Drivers Impact Analysis*
| Driver | (~) % Impact on CAGR Forecast | Geographic Relevance | Impact Timeline |
|---|---|---|---|
| Rising investments in R&D and clinical trials | +2.8% | North America, Europe | Medium term (2-4 years) |
| Increased product approvals and special designations | +3.2% | Global | Short term (≤ 2 years) |
| Expansion into earlier-line and adjuvant settings | +4.1% | North America, Europe, Asia | Medium term (2-4 years) |
| AI-powered biomarker discovery | +2.5% | Global tech hubs | Long term (≥ 4 years) |
| Growth of subcutaneous formulations | +1.9% | Global | Short term (≤ 2 years) |
| Local-manufactured biosimilars | +1.8% | Asia–Pacific, MEA, Latin America | Long term (≥ 4 years) |
| Source: Mordor Intelligence | |||
Rising Investments in R&D and Clinical Trials
Pharmaceutical companies increase capital commitments to immune checkpoint inhibitor pipelines, with Bristol Myers Squibb reporting a 21% rise in growth-portfolio revenues from immuno-oncology programs in 2025.[1]Bristol Myers Squibb, “Q1 2025 Investor Presentation,” bms.com Novartis directed over USD 5.5 billion to licensing and acquisitions in 2024, reflecting an urgent pivot ahead of looming patent expiries. India’s post-2019 regulatory overhaul positions the country as a cost-efficient site for global oncology trials, drawing sponsors seeking large treatment-naïve populations. The pipeline inflation accelerates first-in-class experimentation around LAG-3, TIGIT, and bispecific constructs that may redefine standard-of-care combinations.
Increased Product Approvals & Special Designations
Regulators expedite filings under breakthrough, priority review, and orphan frameworks. The FDA cleared retifanlimab-dlwr for anal canal carcinoma in 2025, and cosibelimab-ipdl became the first PD-L1 therapy for cutaneous squamous cell carcinoma in 2024.[2]U.S. Food and Drug Administration, “FDA Approvals for Oncology Drugs,” fda.gov EMA approvals for tislelizumab extensions and nivolumab-ipilimumab in hepatocellular carcinoma mirror this momentum.[3]European Medicines Agency, “Human Medicines Highlights 2024,” ema.europa.eu Tissue-agnostic endorsements, typified by pembrolizumab for dMMR tumors, reward firms with robust biomarker data sets. Faster pathways shorten revenue ramp-up times and intensify competition for first-mover advantage.
Expansion of ICIs into Earlier-Line & Adjuvant Settings
Checkpoint inhibitors migrate from metastatic salvage to curative intent. Pembrolizumab prolonged event-free survival in perioperative head and neck cancer from 30.4 months to 51.8 months. China’s approval of Keytruda plus chemotherapy in neoadjuvant NSCLC based on KEYNOTE-671 data illustrates global uptake of pre-surgical immunotherapy. Earlier intervention promises lower long-run healthcare costs and improved survival but pressures diagnostics to refine patient selection.
AI-Powered Biomarker Discovery Raising Response Rates
Machine-learning models surpass legacy biomarkers, achieving AUC 0.864 in NSCLC response prediction cohorts. The FDA authorized the PD-L1 SP263 assay as a companion diagnostic using AI-enhanced analytics. Start-ups integrating cytokine and extracellular-vesicle signals expand the predictive toolkit and reduce late-stage attrition.
Restraints Impact Analysis*
| Restraint | (~) % Impact on CAGR Forecast | Geographic Relevance | Impact Timeline |
|---|---|---|---|
| High treatment cost and reimbursement hurdles | -2.1% | Global, acute in LMICs | Medium term (2-4 years) |
| Immune-related adverse events | -1.4% | Global | Short term (≤ 2 years) |
| Adaptive resistance in “cold” tumours | -1.8% | Global | Long term (≥ 4 years) |
| Price erosion from biosimilars | -2.3% | North America, Europe | Medium term (2-4 years) |
| Source: Mordor Intelligence | |||
High Treatment Cost & Reimbursement Hurdles
Monthly U.S. therapy costs span USD 11,961–15,043 despite a crowded class, straining payer budgets and limiting uptake in low-income settings. Medicare reference products saw 32.7% rate cuts five years after biosimilar entry, and biosimilars fell 50.3%, challenging sustainable margins. The Inflation Reduction Act further compresses specialty pharmacy reimbursement, threatening medically-integrated dispensing models.
Adaptive Resistance in “Cold” Tumours Limiting Durability
STK11, KEAP1, and JAK mutations hinder immune infiltration, capping response durability. Only 20% of solid tumors remain highly responsive, prompting bispecific strategies such as EMB-02’s PD-1/LAG-3 construct that produced 6.4% response in early trials. Converting cold tumors to hot remains a central research objective.
*Our forecasts treat driver/restraint impacts as directional, not additive. The impact forecasts reflect baseline growth, mix effects, and variable interactions.
Segment Analysis
By Inhibitor Type: Next-Generation Targets Challenge PD-1 Dominance
PD-1 agents delivered 60.92% of immune checkpoint inhibitors market revenue in 2025, underpinned by Keytruda and Opdivo franchises. LAG-3 molecules such as relatlimab exhibit a 17.49% CAGR, supported by melanoma uptake. PD-L1 products gain from tissue-agnostic labels, while CTLA-4 checkpoints shift to combination partner roles. TIGIT and TIM-3 pipelines progress unevenly, reflecting nuanced biology and mixed readouts. Bispecific antibodies that bridge PD-1 with LAG-3 or VEGF targets may offset monotherapy plateaus and refresh intellectual-property clocks.
A widening array of oral LAG-3 small molecules under investigation underscores demand for cost-efficient oral immunomodulation. This diversification of modalities broadens prescriber choice and mitigates resistance patterns inherent in single-checkpoint blockade.


By Indication: SCLC Emerges as High-Growth Opportunity
Non-small cell lung cancer controlled 26.34% of immune checkpoint inhibitors market revenue in 2025, retaining front-line dominance. Small cell lung cancer delivers the fastest expansion at 22.55% CAGR, buoyed by limited historical options and durable benefits from anti-PD-L1 plus chemotherapy combinations. Melanoma sustains steady uptake through LAG-3 combination approvals. Renal cell carcinoma and hepatocellular carcinoma respond well to IO-VEGF pairings. Urothelial cancer leverages antibody–drug conjugate synergies, with enfortumab vedotin plus pembrolizumab doubling overall survival versus chemotherapy.
Precision medicine drives differentiation as microsatellite instability status, tumor mutational burden, and PD-L1 expression refine therapeutic choices. Earlier-stage interventions shift volume from metastatic to adjuvant settings, altering oncology workflow and resource allocation.
By Route of Administration: Subcutaneous Revolution Addresses Infrastructure Constraints
Intravenous infusion generated 67.95% of immune checkpoint inhibitors market revenue in 2025, favored by established protocols and reimbursement familiarity. Subcutaneous formats grow at 25.4% CAGR as two-minute pushes replace thirty-minute infusions. Hyaluronidase-enabled high-volume delivery expands to community practices, lowering indirect costs like chair time and nursing labor.
Monthly subcutaneous options such as crovalimab illustrate the patient convenience premium. Device-integrated autoinjectors under development promise at-home administration, potentially shifting volumes toward ambulatory care pathways.

By Distribution Channel: Digital Transformation Reshapes Access Models
Hospital pharmacies retained 56.88% of immune checkpoint inhibitors market revenue in 2025, reflecting close monitoring needs. Online players post a 19.95% CAGR, fueled by maturing cold-chain logistics and tele-oncology adoption.
Retail pharmacies broaden specialty units to capture spill-over business from hospital outsourcing. Value-based contracts require sophisticated adherence tracking, prompting platform investments in real-time analytics and adverse-event reporting.
Geography Analysis
North America held 36.74% of immune checkpoint inhibitors market revenue in 2025, supported by favorable reimbursement and trial density. Asia–Pacific rises at 19.56% CAGR on the back of regulatory convergence and local manufacturing incentives. China’s National Medical Products Administration authorized Keytruda for neoadjuvant NSCLC, highlighting regional agility. Japan benefits from domestic innovators like Ono Pharmaceutical in immuno-oncology.
Europe demonstrates steady growth through harmonized regulatory pathways and value-based healthcare adoption, with the European Medicines Agency's multiple 2024-2025 approvals for checkpoint inhibitor combinations indicating continued market expansion. The region's emphasis on health technology assessment and cost-effectiveness analysis shapes market access strategies and pricing negotiations. Middle East and Africa represent emerging opportunities with significant unmet medical needs, yet face affordability challenges that limit widespread adoption of premium-priced immunotherapies. South America's growth potential centers on Brazil and Argentina, where regulatory improvements and healthcare infrastructure investments create opportunities for market expansion. The geographic landscape's evolution reflects broader economic development patterns and healthcare system maturation, with emerging markets increasingly demanding local manufacturing capabilities and technology transfer agreements to ensure sustainable access to innovative cancer therapies.

Competitive Landscape
The immune checkpoint inhibitors market is moderately concentrated yet fiercely contested by multinational incumbents and venture-backed challengers. Merck’s Keytruda aims for USD 22.2 billion sales in 2025, while Bristol Myers Squibb’s Opdivo franchise produced USD 2.39 billion in Q2 2024. Leaders extend lifecycles through subcutaneous reformulations, novel combinations, and biomarker partnerships. Sun Pharmaceutical’s USD 416 million purchase of Checkpoint Therapeutics following Unloxcyt approval illustrates acquisitive moves to secure first-in-class assets.
Bispecific programs advance, typified by BNT327 (PD-1/VEGF) in Phase III trials and ivonescimab (PD-1/VEGF) outperforming Keytruda head-to-head. AI-enabled biomarker firms square off with in-house diagnostics as precision prescribing becomes a revenue lever. Biosimilar entrants in Asia undercut price but must prove interchangeability and secure payer confidence. Market participants prioritize vertical integration that links drug, diagnostic, and digital patient-support assets into an ecosystem that preserves share despite price compression.
Immune Checkpoint Inhibitors Industry Leaders
Bristol Myers Squibb Company
Regeneron Pharmaceuticals Inc
F. Hoffmann-La Roche AG
AstraZeneca
Merck & Co.
- *Disclaimer: Major Players sorted in no particular order

Recent Industry Developments
- June 2025: Bristol Myers Squibb partnered with BioNTech to develop BNT327, a bispecific cancer drug targeting PD-1 and VEGF pathways, entering Phase III trials across multiple cancer types and representing a strategic shift toward multi-target immunomodulation approaches
- May 2025: The FDA approved retifanlimab-dlwr (Zynyz) for treating inoperable locally recurrent or metastatic squamous cell carcinoma of the anal canal, both as combination therapy with carboplatin and paclitaxel and as monotherapy, demonstrating median progression-free survival of 9.3 months versus 7.4 months for placebo
- April 2025: Bristol Myers Squibb reported Q1 2025 revenues of USD 11.2 billion with Growth Portfolio generating USD 5.6 billion, up 16%, driven by Opdivo sales of USD 2.3 billion and raised full-year guidance to USD 45.8-46.8 billion
- February 2025: The FDA accepted a supplemental biologics license application for nivolumab plus ipilimumab combination as first-line treatment for unresectable/metastatic MSI-H/dMMR colorectal cancer, with target action date of June 23, 2025, based on CheckMate 8HW trial results


Research Methodology Framework and Report Scope
Market Definitions and Key Coverage
Our study defines the immune checkpoint inhibitors market as the global revenue generated from prescription-grade monoclonal antibodies that block PD-1, PD-L1, CTLA-4, LAG-3, TIGIT, TIM-3, and other next-generation targets used for oncology indications across all lines of therapy. According to Mordor Intelligence, values reflect ex-factory sales converted to constant 2025 USD.
Scope Exclusion: We exclude companion diagnostics, bispecific or CAR-T constructs, and any sales booked under broader immunotherapy classes.
Segmentation Overview
- By Inhibitor Type
- CTLA-4 Inhibitors
- PD-1 Inhibitors
- PD-L1 Inhibitors
- LAG-3 Inhibitors
- TIGIT Inhibitors
- TIM-3 & Other Next-Gen Checkpoints
- By Indication
- Non-Small Cell Lung Cancer (NSCLC)
- Small Cell Lung Cancer (SCLC)
- Melanoma
- Renal Cell Carcinoma
- Head & Neck Cancers
- Urothelial & Bladder Cancer
- Hepatocellular Carcinoma
- Hodgkin Lymphoma
- Other Cancers
- By Route of Administration
- Intravenous
- Sub-cutaneous
- By Distribution Channel
- Hospital Pharmacies
- Retail Pharmacies
- Online Pharmacies
- By Geography
- North America
- United States
- Canada
- Mexico
- Europe
- Germany
- United Kingdom
- France
- Italy
- Spain
- Rest of Europe
- Asia-Pacific
- China
- Japan
- India
- Australia
- South Korea
- Rest of Asia-Pacific
- Middle East & Africa
- GCC
- South Africa
- Rest of Middle East & Africa
- South America
- Brazil
- Argentina
- Rest of South America
- North America
Detailed Research Methodology and Data Validation
Primary Research
Mordor analysts interviewed practicing oncologists, hospital procurement leads, and regional reimbursement experts across North America, Europe, Asia-Pacific, and Latin America. These discussions validated penetration rates, dose compliance shifts toward flat dosing, and emerging subcutaneous preferences, thereby refining model variables and discounting desk-research anomalies.
Desk Research
We began by mapping disease burden trends through open sources such as WHO GLOBOCAN, SEER, and OECD health statistics; these sources provided a grounded view of cancer incidence, prevalence, and treated patient pools. Regulatory pipelines were tracked on FDA, EMA, and ClinicalTrials.gov to capture launch timing and label expansions. Pricing corridors were cross-checked in annual reports and 10-Ks, while shipment flows were verified via Volza trade data. D&B Hoovers supplemented company-level revenue splits. Many additional databases and peer-reviewed journals informed smaller assumptions; the list above is illustrative, not exhaustive.
Market-Sizing & Forecasting
A top-down patient cohort build was first run, using cancer incidence, late-stage share, treatment eligibility, and checkpoint adoption ratios. Results were stress-tested with selective bottom-up checks: sampled ASP multiplied by volume from hospital audits and distributor channel calls. Key drivers in the model include median course price erosion, new-target launch cadence, regional reimbursement lag, and adjuvant-setting uptake. Multivariate regression against historical uptake curves produced the 2025-2030 forecast, and scenario analysis adjusted for pipeline attrition. Gaps inside bottom-up proxies were bridged through weighted averages from comparable markets.
Data Validation & Update Cycle
Outputs pass three-layer analyst reviews; variance thresholds trigger re-checks with interviewees, and models refresh annually, with interim updates whenever major approvals, withdrawals, or policy shifts occur.
Why Mordor's Immune Checkpoint Inhibitors Baseline Stands Reliable
Published estimates often diverge, and we acknowledge that readers see a wide spread of numbers in public domains.
Divergences usually stem from mismatched scope, currency conversions, and differing refresh cadences before new drug launches reach peak sales.
Benchmark comparison
| Market Size | Anonymized source | Primary gap driver |
|---|---|---|
| USD 50.29 B (2025) | Mordor Intelligence | - |
| USD 57.43 B (2024) | Global Consultancy A | Excludes next-gen checkpoints and keeps list-price revenue without rebate normalization |
| USD 47.40 B (2023) | Trade Journal B | Uses shipment data and counts combination regimens, causing double counting |
| USD 40.10 B (2022) | Industry Association C | Older base year and conservative uptake curve, with limited Asian country coverage |
In sum, the balanced blend of transparent variables, timely refreshes, and layered validation makes Mordor's baseline a dependable starting point for strategic planning.


Key Questions Answered in the Report
What is the current value of the immune checkpoint inhibitors market?
The immune checkpoint inhibitors market stands at USD 58.43 billion in 2026 and is projected to more than double by 2031.
Which inhibitor class holds the largest market share?
PD-1 inhibitors account for 60.92% of revenue, anchored by Keytruda and Opdivo.
Why are subcutaneous formulations important?
Subcutaneous delivery cuts administration time to minutes, eases infusion capacity constraints, and supports outpatient treatment models.
Which cancer type is growing fastest for checkpoint inhibitors?
Small cell lung cancer posts the highest CAGR at 22.55% through 2031 due to limited historical options and new combination approvals.
How will biosimilars affect prices?
Medicare data show reference checkpoint products can face 30%-plus price cuts within five years of biosimilar entry, pressuring margins and accelerating value-based contracting.
What role does AI play in this market?
AI enhances biomarker discovery and patient stratification, raising response rates and lowering late-stage trial failures for next-generation inhibitors.
Page last updated on:


