Flexible Display Market Size and Share
Market Overview
| Study Period | 2020 - 2031 |
|---|---|
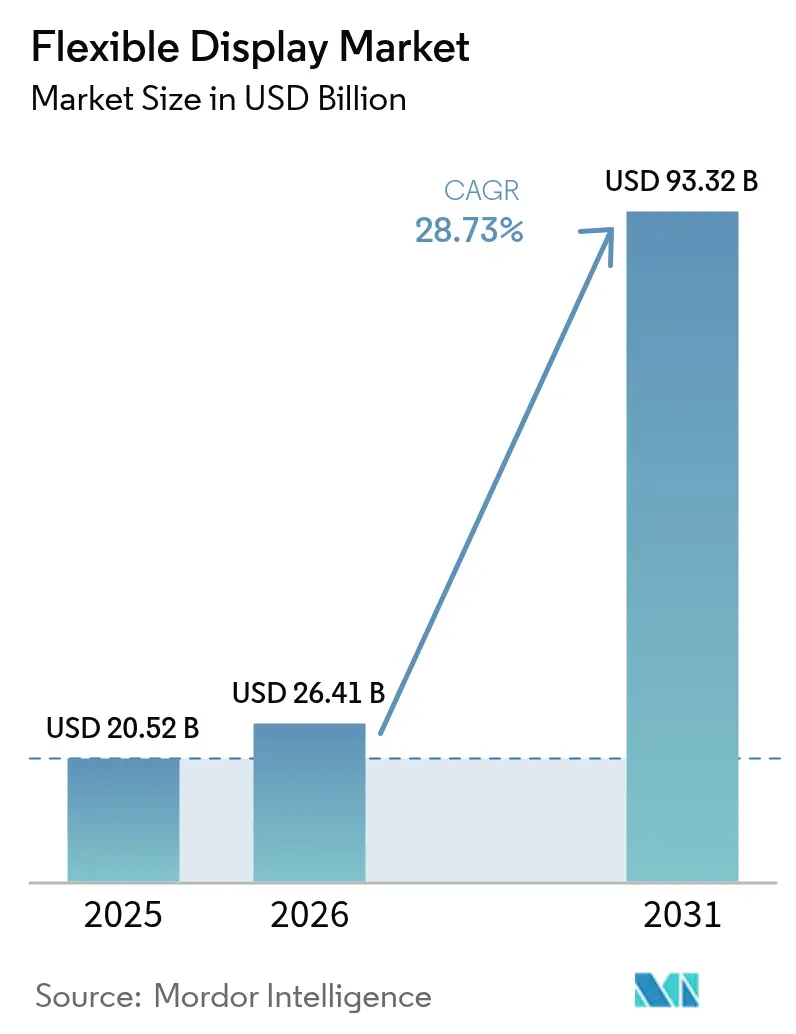
| Market Size (2026) | USD 26.41 Billion |
| Market Size (2031) | USD 93.32 Billion |
| Growth Rate (2026 - 2031) | 28.73% CAGR |
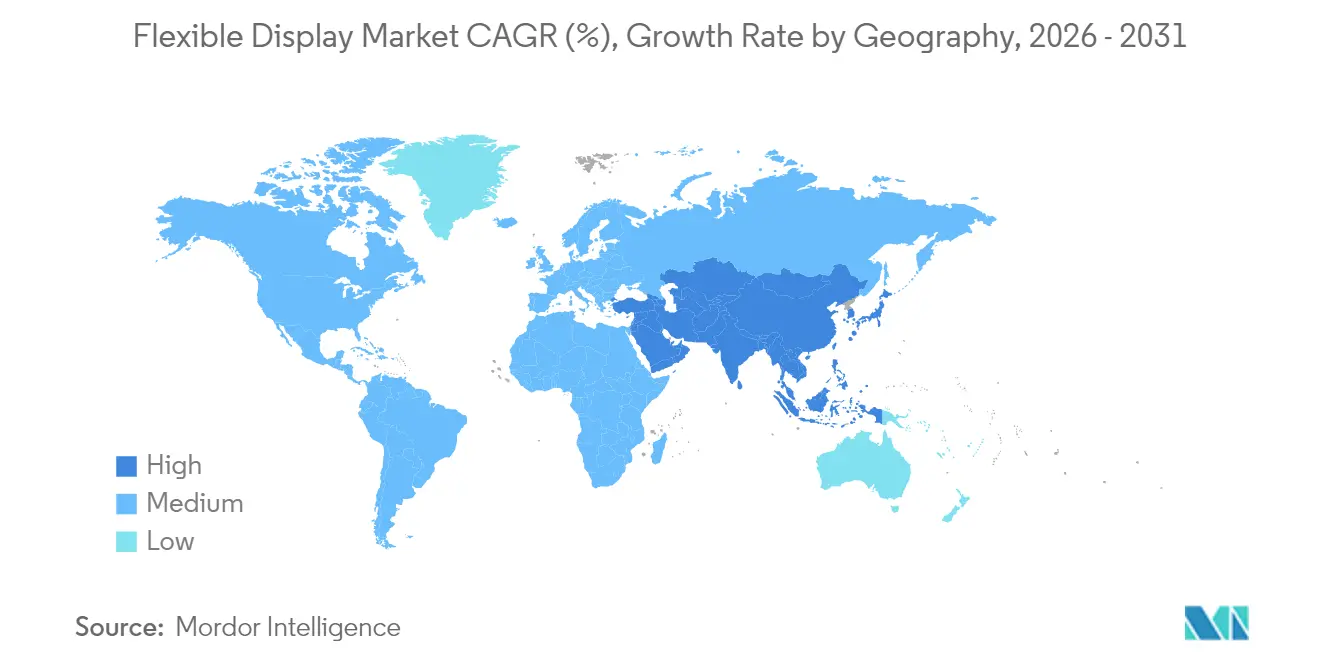
| Fastest Growing Market | Middle East and Africa |
| Largest Market | Asia Pacific |
| Market Concentration | Medium |
Major Players.webp) *Disclaimer: Major Players sorted in no particular order Image © Mordor Intelligence. Reuse requires attribution under CC BY 4.0. | |
Flexible Display Market Analysis by Mordor Intelligence
The flexible display market size was valued at USD 20.52 billion in 2025 and estimated to grow from USD 26.41 billion in 2026 to reach USD 93.32 billion by 2031, at a CAGR of 28.73% during the forecast period (2026-2031). The valuation leap signals a turning point in which scale economies, material breakthroughs and product design freedom converge to shift flexible panels from niche concepts into mainstream interfaces across consumer electronics, mobility and industrial environments. Production investments in Gen-8.6 OLED fabs, rapid rollable innovation and the migration of micro-LED into wearables are widening the addressable base, while regulatory pushes for glass-free modules spur fresh applications in Europe. Competitive intensity is rising as Chinese manufacturers expand capacity faster than Korean incumbents, challenging established cost structures and accelerating price declines. Simultaneously, integrated players that secure polyimide, encapsulation and hinge know-how are insulating themselves from supply shocks and litigation risk.
Key Report Takeaways
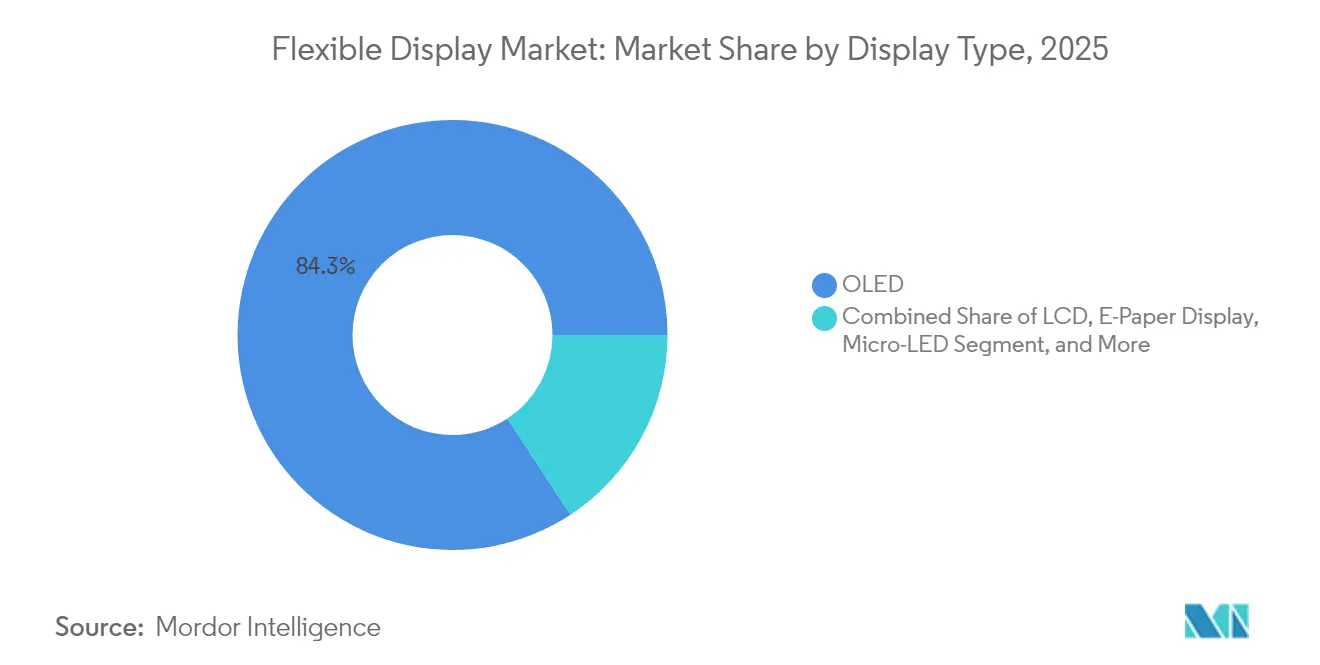
- By display type, OLED captured 84.25% of the flexible display market share in 2025; micro-LED is projected to grow at a 35.4% CAGR to 2031.
- By form factor, foldables held 70.20% of the flexible display market size in 2025; rollables are advancing at a 37.9% CAGR between 2026-2031.
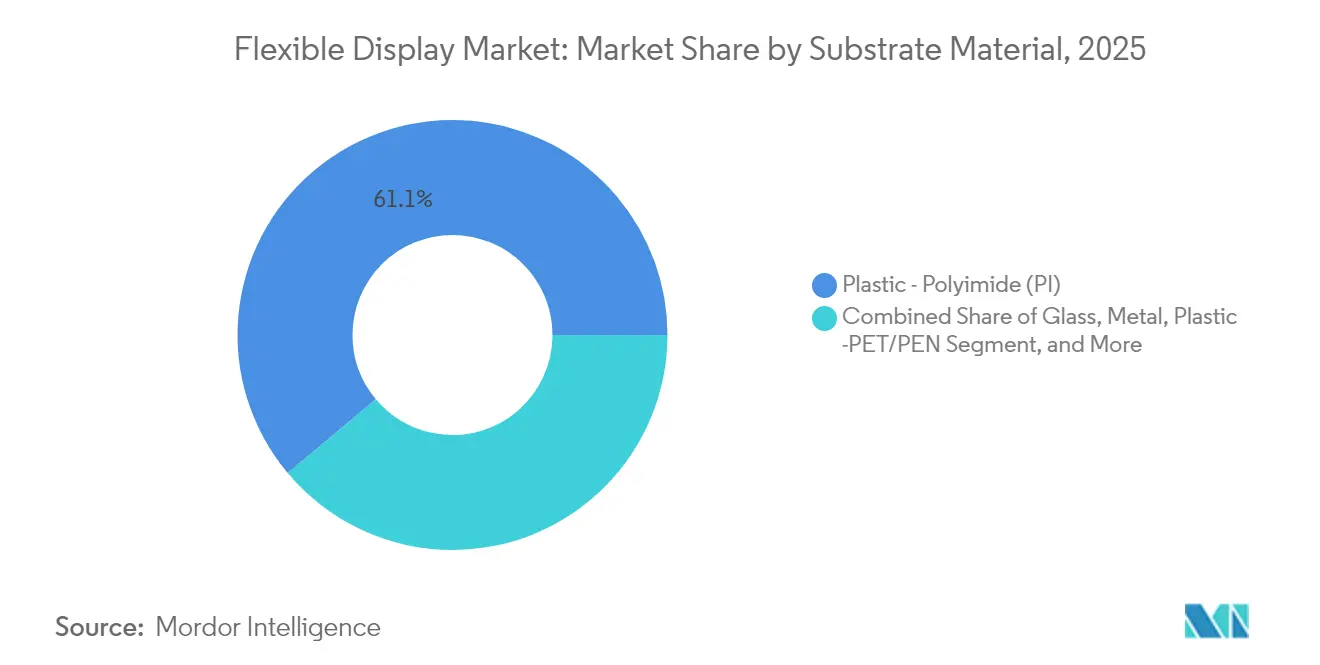
- By substrate, plastic-polyimide accounted for 61.10% of the flexible display market share in 2025; metal foil substrates are forecast to climb at a 32.2% CAGR to 2031.
- By application, smartphones and tablets commanded 65.30% of the flexible display market size in 2025; automotive cockpits are growing at a 30.1% CAGR through 2031.
- By geography, Asia Pacific led with 56.40% revenue share in 2025, while the Middle East & Africa region is projected to expand at a 31.1% CAGR through 2031.
Note: Market size and forecast figures in this report are generated using Mordor Intelligence’s proprietary estimation framework, updated with the latest available data and insights as of 2026.
Global Flexible Display Market Trends and Insights
Drivers Impact Analysis*
| Driver | (~) % Impact on CAGR Forecast | Geographic Relevance | Impact Timeline |
|---|---|---|---|
| Rollable & Foldable Smartphone Launch Momentum in China and Korea | +7.2% | East Asia, with global spillover effects | Medium term (2-4 years) |
| Premium-EV Curved OLED Cockpit Adoption Across Europe | +5.8% | Europe, North America, premium segments in Asia | Medium term (2-4 years) |
| Demand Spike for Lightweight AR/VR Micro-OLED Panels in North America | +4.3% | North America, with expansion to Europe and East Asia | Long term (≥ 4 years) |
| Cost Reduction from Gen-8.6 Flexible OLED Fabs in China | +6.5% | Global, with primary impact in Asia Pacific | Short term (≤ 2 years) |
| EU Circular-Economy Push for Glass-Free Modules | +3.1% | European Union, with regulatory spillover to global supply chains | Medium term (2-4 years) |
| Growth in Flexible Medical Wearables in Japan & South Korea | +2.4% | East Asia, with expansion to North America and Europe | Long term (≥ 4 years) |
| Source: Mordor Intelligence | |||
Rollable and foldable smartphone launch momentum in China and Korea
Shipments of flexible OLED smartphone panels climbed 26% in 2024 to 784 million units, underscoring how fresh form factors stimulate replacement demand.[1]Shuangyuan Liu, Xiaofei Xu and Jie Jiang, “Flexible Transparent ITO Thin Film with High Conductivity and High-Temperature Resistance,” Ceramics International, ceramicsinternational.comNew tri-fold designs slated for late 2025 bring 360-degree rotation and ultra-thin glass that lowers crease visibility, intensifying brand differentiation. Chinese entrants scale quickly by matching hinge durability targets and shortening design-to-launch cycles, pressuring incumbents on price and innovation tempo. Component ecosystems around hinges, temperature-resistant polyimide and transparent cover films benefit directly. The upturn also spills into accessory and repair markets, creating incremental service revenue streams.
Premium-EV curved OLED cockpit adoption across Europe
Luxury electric vehicles elevate interior experience through expansive curved dashboards such as the EQS SUV Hyper-screen, which merges multiple displays under a continuous glass cover.[2]Mercedes-Benz AG, “The EQS SUV Full Press Pack,” mercedes-benz-media.co.ukAutomotive OEMs prefer flexible OLED for its thin profile, uniform luminance and design latitude, leading to a surge in display-area per vehicle. Tier-1 suppliers deepen partnerships with panel makers to co-develop cockpit platforms, while software-defined vehicle strategies demand displays that support continuous over-the-air upgrades. As autonomous functionality matures, multi-modal interaction and stretchable pillar-to-pillar screens are set to multiply display square-meter consumption per car.
Lightweight AR/VR micro-OLED demand in North America
Shipments of XR displays are set to rise 6% in 2025, with AR glasses surging 42% on the back of thinner micro-OLED engines that cut headset weight and power draw. Brightness gains beyond 10,000 nits and side-wiring deposition that trims cost by three-fold remove hurdles to outdoor and enterprise adoption. Silicon backplane advances boost pixel density, enabling bi-focal designs that blend physical and digital layers seamlessly. Component suppliers reposition from mobile OLED to micro-OLED, opening fresh revenue pools.
Cost reduction from Gen-8.6 flexible OLED fabs in China
A USD 8.72 billion Gen-8.6 line now under construction is designed for cost-efficient tablet, notebook and automotive panels, allowing simultaneous processing of six 14-inch displays per mother-glass. Maskless lithography, inkjet-printed RGB stacks and oxide-TFT backplanes together shave material waste and cycle time. Lower panel ASPs accelerate penetration into mid-range devices, flattening price elasticity curves. Allied equipment makers in evaporation and encapsulation win larger tool orders, while domestic PI and barrier-film suppliers scale with guaranteed offtake.
Restraints Impact Analysis*
| Restraint | (~) % Impact on CAGR Forecast | Geographic Relevance | Impact Timeline |
|---|---|---|---|
| Gen-8+ polyimide yield losses | −2.8% | Global manufacturing hubs, mainly East Asia | Short term (≤ 2 years) |
| Encapsulation material supply crunch | −2.1% | Global with higher risk in Asia fabs | Medium term (2-4 years) |
| US-centric patent litigation on foldable hinges | −1.5% | North America with global spillovers | Medium term (2-4 years) |
| Cold-climate reliability issues of plastic-LCD signage | −1.1% | Northern Europe, North America, Northern Asia | Short term (≤ 2 years) |
| Source: Mordor Intelligence | |||
Gen-8+ polyimide yield losses elevating scrap costs
Scaling to larger mother-glass intensifies thermal stress on flexible PI substrates, driving defect-induced yield drops that inflate per-unit cost. Research on aerogel-reinforced PI fibers shows promise in lifting thermal stability yet industrial adoption remains nascent, leaving fabs exposed to expensive scrap during ramp-up.[3]Yonggang Min et al., “Pressure-Constrained Sonication Activation of Flexible Printed Metal Patterns for Multifunctional Electronics,” Nature Communications, nature.comYield recovery programmes now focus on real-time in-line metrology and AI-based predictive maintenance to shave defect density before mass output begins.
Encapsulation material supply crunch
Ultra-thin multi-layer barriers that fend off moisture and oxygen still come from a few qualified suppliers. Strong demand from smartphone and automotive lines strains coating capacity, extending lead times and raising spot pricing. Government-sponsored projects such as KONFECT seek to scale flexible OLED glass encapsulation via roll-to-roll systems, but commercial volumes remain limited. Panel makers with in-house barrier film or ALD capability gain schedule certainty and margin protection.
*Our forecasts treat driver/restraint impacts as directional, not additive. The impact forecasts reflect baseline growth, mix effects, and variable interactions.
Segment Analysis
By Display Type: OLED still rules while micro-LED gains pace
OLED held an 84.25% share of the flexible display market in 2025, leveraging emissive pixels that enable thinner, curve-friendly modules without backlights. Cost erosion from Chinese fabs and evaporator throughput gains have kept OLED the panel of choice for smartphones, watches and curved infotainment clusters. At the same time, micro-LED shipments are scaling from pilot to early mass production, posting a 35.4% forecast CAGR as quantum-dot colour converters, mass-transfer accuracy and repair yields improve. Automotive head-up displays and rugged wearables benefit first because micro-LED pushes brightness to 10,000 nits and delivers long lifetimes even under high thermal load, as evidenced by Tianma’s 8-inch prototype. E-paper holds a niche in low-power signage and logistics tags, while quantum-dot LCD hybrids continue bridging price and colour-gamut gaps for mid-range devices.
OLED dominance faces three pressure points. First, inorganic micro-LED material longevity dilutes OLED’s burn-in risk narrative. Second, Gen-8.6 cost advantages narrow the ASP gap between rigid and flexible OLED, nudging budget segments toward flexible form factors. Third, quantum-dot on-chip approaches are now compatible with roll-to-roll plastic substrates, seeding future competition in ultra-large transparent windows. Even so, ecosystem maturity, equipment depreciation and abundant supply keep OLED firmly in charge through the mid-term.


By Form Factor: Rollable gains traction beyond foldables
Foldable devices captured 70.20% of the flexible display market in 2025 and remain the volume engine as smartphone vendors race to iterate bi-fold, tri-fold and wrap-around formats. Patent barricades on hinge geometry and UTG lamination reinforce the lead of first movers yet do not preclude rivals that licence or innovate alternative kinematic stacks. Rollable screens, forecast to expand at a 37.9% CAGR, unlock spatial efficiency by retracting into compact housings, aligning with consumer demand for pocket-friendly yet expansive displays. Early notebook and tablet rollables demonstrate that motorised spools and stretch-limiting lamination can achieve repeatability over 30,000 actuations.
Bendable and conformable displays remain staples in curved edge phones, fitness bands and automotive radars thanks to their simpler mechanical loads. A nascent “form-factor free” class, enabled by stretchable substrate meshes and serpentine circuit patterns, is under active exploration for skin-adhesive health patches and soft robots. Academic output on stretchable displays jumped from 17 papers in 2014 to 197 in 2023, mirroring heightened R&D investment. While commercialisation lags, the progress sets the stage for ubiquitous ambient display surfaces later in the decade.
By Substrate Material: Metal foil narrows the gap
Plastic-polyimide ruled with 61.10% share in 2025 owing to its proven thermal endurance, chemical stability and process familiarity. However, dimensional stability challenges at Gen-8+ scale and recyclability limitations give metal foil an opening. Aluminium and stainless-steel foils coupled with oxide TFT layers dissipate heat faster and block water better, pushing their CAGR to 32.2% through 2031. A recent sonication-activation technique raises the conductivity of printed metal traces, letting engineers craft origami-style fold nets with minimal resistance gain after repeated bending.
Ultra-thin glass remains indispensable where optical clarity and touch rigidity dominate, notably in foldable cover windows below 30 µm. PET, PEN and polycarbonate serve cost-sensitive segments that accept lower thermal thresholds. Fluorinated-mica substrates with indium-tin-oxide coatings now reach 85% transparency and survive 800 °C anneals, setting new records for high-temperature tolerant flexible conductors.
By Application: Automotive cockpit pulls ahead
Smartphones and tablets together represented 65.30% of the flexible display market in 2025 and remain the primary showcase for high-refresh-rate OLED. Yet automotive cockpits are surging with a 30.1% forecast CAGR as premium EV brands deploy pillar-to-pillar curved dashboards, rear-seat entertainment strips and exterior welcome panels. BOE’s 17-inch electric cockpit prototype illustrates how flexible displays merge gauges, infotainment and passenger controls into a unified surface, reducing mechanical part count and enhancing upgradeability.
Wearables enjoy robust momentum, fuelled by health tracking, bi-directional communication and fashion appeal. Rollable TV concepts plus transparent retail signage continue to draw marketing buzz, though cost hurdles keep volumes modest for now. AR/VR headsets rely increasingly on micro-OLED micro-displays to meet ergonomic targets, linking back into the substrate and encapsulation advances noted earlier. Industrial control panels, rail information systems and rugged defence screens round out the expanding tapestry of use cases.
Geography Analysis
Asia Pacific dominated with 56.40% revenue in 2025, propelled by dense manufacturing ecosystems in Korea, China and Taiwan that span PI resin synthesis to module assembly. China alone is adding 8% annual flexible OLED capacity through 2028 against Korea’s 2% run-rate, lifting its share of global panel output from 68% to 74%. Regional policy incentives grant favourable land, tax and power terms to local champions, while domestic smartphone OEMs provide ready demand. This virtuous cycle cements supply-chain self-sufficiency and accelerates time-to-yield for new lines.
North America commands technology pull on account of its leadership in AR/VR, high-performance computing and premium notebook segments. US brands source OLED MacBook-class panels for 2026, compelling suppliers to qualify oxide TFT and tandem stack architectures that lengthen lifetime under static UI loads. Legal exposure arising from hinge patents remains a watch-item; however, players often settle or cross-licence to safeguard launch windows. Government grants for microelectronic reshoring may redirect portions of the ecosystem stateside, particularly in backplane and glass-free encapsulation tooling.
Europe exerts regulatory influence through the Ecodesign Regulation and the upcoming Digital Product Passport, pushing the industry toward recyclable structures and full material disclosure. Automotive clusters in Germany, Sweden and the United Kingdom adopt curved OLED clusters at a brisk pace, stimulating local integration, bonding and test partners. The continent’s circular material use target of 24% by 2030 drives R&D into solvent-reduced PI, biodegradable adhesives and mechanical fasteners that enable easy separation.
The Middle East and Africa, while comparatively small, records the fastest growth at a 31.1% CAGR off expanding digital signage in transport hubs, sports arenas and leisure venues. Flexible LED film screens that conform to glass facades exemplify the architectural appetite for novel form factors. Government-backed smart-city projects and high ambient-light conditions make high-brightness micro-LED an attractive option. South America follows with rising smartphone penetration and automotive assembly plants beginning to specify flexible clusters for export models.

Value Chain Analysis
The flexible display value chain starts with upstream materials and components such as polyimide (PI) substrates, ultra-thin glass (UTG) cover windows, OLED emitters and host materials, thin-film encapsulation/barrier films, adhesives, and touch/cover-lens stacks, alongside specialized equipment for evaporation, lithography, and inspection. Midstream panel makers run flexible OLED and emerging micro-LED lines (Gen-6 and scaling toward Gen-8.6) and integrate backplanes (LTPS/oxide TFT), encapsulation, and module processes, then supply device OEMs and tier-1 integrators across smartphones/tablets, notebooks, automotive cockpits, wearables, and AR/VR. Recent supplier-side reinforcement includes the February 2026 extension of long-term OLED material supply and licensing agreements between LG Display and Universal Display Corporation, supporting continuity in critical emitter/material inputs.
Downstream, demand is concentrated among high-volume consumer device OEMs and automotive platforms that require qualification, reliability testing, and multi-year supply commitments, which in turn shapes panel makers decisions on capacity, process nodes, and vertical integration. Bottlenecks persist around foldable-specific stacks, particularly UTG processing and yield, as the cover-window layer materially affects crease, scratch resistance, and overall bill of materials in foldables. To protect schedules and secure design wins, leading players deepen control over module assembly and line utilization, exemplified by Samsung Displays June 2026 reported start of module production for Apples first foldable iPhone under an exclusive multi-year supply arrangement, alongside actions to expand 6th-generation OLED capacity at its A4 facility in Asan to support foldable and curved form factors.
Competitive Landscape
Incumbents Samsung Display and LG Display leverage broad IP portfolios covering flexible OLED stacks, encapsulation, foldable hinges and UTG lamination, securing design wins with global device brands. Yet their combined share is projected to erode as BOE, Visionox and CSOT unlock successive Gen-6 and Gen-8.6 lines that undercut cost while approaching uniformity targets. BOE’s USD 8.72 billion Chengdu fab is emblematic, aiming for full mass production by 2027 and positioning the firm to overtake Samsung Display in foldable smartphone panel output by 2028. Visionox meanwhile invests USD 690 million in an R&D campus focusing on AR/VR micro-OLED, signalling intent to diversify beyond handset panels.
Strategic moves revolve around vertical control. Samsung Display purchased mask-less OLED deposition IP from Orthogonal, seeking to eliminate costly fine-metal masks and leapfrog in pattern-resolution capability. LG Display unveiled a stretchable panel that extends 50% without distortion, targeting fashion and mobility sectors. BOE actively co-develops automotive cockpit platforms with leading OEMs, embedding its panels deeply into vehicle E/E architectures. Start-ups such as SmartKem commercialise low-temperature organic TFT inks compatible with roll-to-roll printing, offering incumbents optional paths to lower CapEx expansions.
Patent filings on fold mechanics stay elevated. While high-profile lawsuits in US courts can delay individual launches, settlements typically follow, allowing royalty-bearing models to proceed. Materials suppliers-Dow, Sumitomo, Kolon-also consolidate through targeted acquisitions to secure PI varnish and barrier-film formulations, further raising entry hurdles. Overall, the market tilts toward an oligopoly with room for specialised disruptors in micro-LED, metal-foil and stretchable niches.
Flexible Display Industry Leaders
LG Display Co., Ltd
Samsung Electronics Co. Ltd
ROYOLE Corporation
BOE Technology Group Co. Ltd
Microtips Technology
- *Disclaimer: Major Players sorted in no particular order

Market Opportunities and Future Outlook
White space is opening as flexible displays move beyond smartphones into IT form factors and automotive interiors that demand larger-area panels, longer lifetimes, and improved power efficiency. The market shift toward notebook and tablet OLED creates demand for Gen-8.6-scale economics and hybrid OLED process flows that bridge rigid and flexible requirements, and it also raises the premium on tandem-stack architectures for efficiency and lifetime in static-UI use cases. These opportunity signals are backed by concrete capacity and capex moves, including BOEs Chengdu Gen 8.6 OLED project (63 billion yuan) entering mass production in June 2026 with a focus on IT OLED panels, and Samsungs phased expansion of 6th-generation OLED capacity at the A4 plant in Asan in June 2026 to add incremental substrate starts for mobile and adjacent flexible applications.
A second opportunity cluster centers on localized supply resiliency for encapsulation and barrier materials, plus IP-secure foldable module stacks (hinges, UTG lamination, and reliability engineering), where qualified supplier bases remain narrower than in rigid display ecosystems. Investment programs also point to deeper technology roadmaps in Korea: LG Displays board resolution in April 2026 to invest KRW 1.106 trillion in new OLED technology infrastructure, oriented to IT and mobile demand, underscores continued spending on next-generation processes and equipment qualification. For automotive and emerging device classes (XR and new interactive surfaces), manufacturers are also presenting stretchable and sensor-integrated OLED concepts, expanding the addressable design space for cockpit panels and wearable interfaces where rigid modules are a constraint.
Recent Industry Developments
- July 2026: Samsung Electronics introduced Flex Titanium technology aimed at improving durability and structural stability in next-generation Galaxy foldable designs. The material and stack-level emphasis supports higher folding cycles and thinner mechanical assemblies, reinforcing the premium foldable value proposition and intensifying differentiation around hinge and cover-layer engineering.
- April 2025: Samsung Display commenced mass production of a rollable OLED screen for laptops, pushing flexible OLED from smartphone-centric volumes into IT form factors with larger panel areas. The move expands the ecosystem for rollable mechanisms, lamination, and reliability testing, and it adds a commercialization reference point for OEMs considering rollable notebooks and tablets.
- November 2024: LG Display announced development of a stretchable display capable of up to 50% elongation through a national project involving multiple research institutions. This milestone broadens the technical pathway toward conformable and wearable surfaces beyond foldable and rollable formats, supporting new use cases in mobility interiors and skin-adjacent devices.


Research Methodology Framework and Report Scope
Market Definition and Coverage
This market covers revenue generated from newly manufactured flexible display panels that can bend, fold, or roll, and are built on flexible substrates such as plastic, flexible glass, or thin metal. Our sizing tracks panel supply into end products across consumer electronics, automotive, industrial, and public information use cases.
Scope exclusions: Excludes rigid flat panel displays, flexible printed circuits, and driver ICs.
Segmentation Overview
- By Display Type
- OLED
- LCD
- E-Paper Display (EPD)
- Micro-LED
- Quantum-Dot and Other Emerging Types
- By Form Factor
- Foldable
- Rollable
- Bendable
- Conformable (Curved/Wrap-around)
- By Substrate Material
- Glass
- Plastic - Polyimide (PI)
- Plastic - PET/PEN
- Metal Foil
- Others (Polycarbonate, Ultra-thin Glass)
- By Application
- Smartphones and Tablets
- Smart Wearables (Watches, Patches)
- Televisions and Digital Signage
- Personal Computers and Laptops
- Automotive Cockpit and Infotainment
- AR/VR Head-Mounted Displays
- Industrial and Public Transport Displays
- By Geography
- North America
- United States
- Canada
- Mexico
- Europe
- Germany
- United Kingdom
- France
- Italy
- Spain
- Rest of Europe
- Asia-Pacific
- China
- Japan
- South Korea
- India
- South East Asia
- Rest of Asia-Pacific
- South America
- Brazil
- Rest of South America
- Middle East and Africa
- Middle East
- United Arab Emirates
- Saudi Arabia
- Rest of Middle East
- Africa
- South Africa
- Rest of Africa
- Middle East
- North America
Data Sources, Market Sizing, and Validation
Desk Research
Desk research was used to set the demand signals and terminology before any modeling assumptions were locked in. We relied on public source types such as U.S. International Trade Commission materials, UN Comtrade-style customs statistics, World Intellectual Property Organization patent filings, and peer-reviewed journal articles on OLED and thin-film processing. These inputs helped confirm technology readiness and provide context for adoption timing.
Alongside that, we reviewed company filings, investor presentations, industry association pages, and trusted business press coverage to map capacity moves and product launches. For hard-to-track items like shipments and panel output splits, we also referenced paid subscriptions that compile company financials and corporate actions, plus patent databases and shipment-level trade views where relevant. The sources listed here are illustrative, and additional references were used to collect data, validate assumptions, and clarify gaps.
Primary Interviews and Surveys
Primary discussions were completed with a mix of display supply-chain participants, device ecosystem specialists, and downstream buyers, so the adoption path could be checked beyond what is stated in press releases. We used these inputs to confirm what is actually shipped and paid for, refine the direction of pricing inputs, and pressure test timing differences across APAC, EMEA, and the Americas.
Distribution of primary research fieldwork respondents
| Company type | Respondent position | Region |
|---|---|---|
| Top tier: 27% | CXOs: 14% | APAC: 43% |
| Mid tier: 53% | Functional/Unit leaders: 41% | EMEA: 33% |
| Smaller Players: 20% | Managers: 45% | Americas: 24% |
Market-Sizing & Forecasting
Sizing starts from a top-down demand pool build that reconstructs flexible display value by linking device category volumes to flexible panel penetration rates, then converting units into revenue using realistic average selling prices. Totals are corroborated with selective bottom-up checks, such as sampling panel shipment volumes and the pricing ranges shared in interviews, followed by supplier and channel sense checks to adjust any drift.
Key inputs used in the model include flexible OLED versus other technology mix, foldable smartphone and wearable shipment trends, new fab capacity ramps and utilization timing, yield improvement expectations, and ASP movement as volumes scale and form factors mature. Where a bottom-up check is incomplete for a niche application, the gap is handled through proxy penetration and pricing based on the closest comparable device type, then validated again through follow-up calls.
For forecasting, scenario analysis is used so adoption can be flexed using a small set of controllable variables, mainly device launch cadence, penetration ceilings, and price decline curves. These scenarios are anchored to what primary experts describe as plausible over the forecast window, and they are rebalanced if new capacity announcements or demand shocks shift the near-term path.
Data Validation & Update Cycle
Model outputs are triangulated against independent signals, including device shipment trajectories, capacity additions, and the observed pricing direction from interviews and public disclosures. Large variances are flagged, reviewed, and corrected through multi-step analyst checks, and respondents are re-contacted when a critical assumption changes or when an outlier result cannot be explained.
The report is refreshed annually, and interim updates are triggered if material events occur, such as major capacity changes or sudden demand shifts in key device categories. Before delivery, a final pass is done to ensure the latest public information and confirmed primary inputs are reflected consistently across the model and narrative.
Mordor Intelligence's Flexible Display Market Size Measured Against Other Published Estimates
Published market sizes for flexible displays often vary because the underlying scope is not always consistent, and pricing and adoption assumptions can move totals quickly. Differences also show up when one source anchors to device shipment volumes, while another relies more on broad technology narratives without tightening the underlying math.
Rigid flat panel displays sit outside Mordor Intelligence's scope, and that single exclusion can widen the spread when other estimates blend flexible panels with the larger flat panel value pool. The remaining gaps typically come from how foldable device penetration is ramped, whether ASP declines are applied uniformly or by application, the currency conversion timing used for global revenue, and how frequently assumptions are refreshed when new fab utilization data emerges.
Benchmark comparison
| Source | Market Size | Gaps in Research Methodology |
|---|---|---|
| Mordor Intelligence | USD 26.41 B (2026) | |
| Global Consultancy A | USD 48.92 B (2025) | Uses an earlier base year and a broader segmentation frame, and the definition is not explicit on excluding adjacent display categories, which can inflate the counted revenue pool. |
| Industry Publisher B | USD 33.70 B (2025) | Provides limited public detail on inclusion rules and the pricing build, so the estimate can differ depending on whether revenues are captured at the panel level only or partially blended with device level values. |
The table shows that most dispersion is driven by scope clarity and the way penetration and pricing are applied across device uses. By keeping sizing tied to panel revenue and validating adoption inputs using supply chain feedback, our estimate remains traceable to clear variables and repeatable steps.


Key Questions Answered in the Report
What is the flexible display market size in 2026 and how fast will it grow by 2031?
The market stands at USD 26.41 billion in 2026 and is projected to reach USD 93.32 billion by 2031, posting a 28.73% CAGR.
Which region currently leads the flexible display market and which region is expanding the fastest?
Asia Pacific holds the largest share at 56.40% in 2025, while the Middle East and Africa region is forecast to grow at a 31.1% CAGR from 2026-2031.
How quickly are rollable displays growing compared with foldable formats?
Foldables own 70.20% of 2025 volume, yet rollable displays are the growth engine with a 37.9% CAGR expected between 2026-2031.
Why are automotive cockpits emerging as a key application for flexible displays?
Premium EV makers integrate curved OLED dashboards to enhance user experience, driving a 30.1% CAGR for automotive cockpit displays through 2031.
What material-related challenges could slow flexible display adoption?
Yield losses in Gen-8+ polyimide substrates and tight supply of high-performance encapsulation materials are reducing output and raising costs.
Who are the main players and how is competition evolving?
Samsung Display and LG Display lead today, but BOE and Visionox are rapidly gaining share as new Gen-8.6 fabs in China cut costs and boost capacity.
Page last updated on:


