Electronic Paper Display Market Size and Share
Market Overview
| Study Period | 2019 - 2030 |
|---|---|
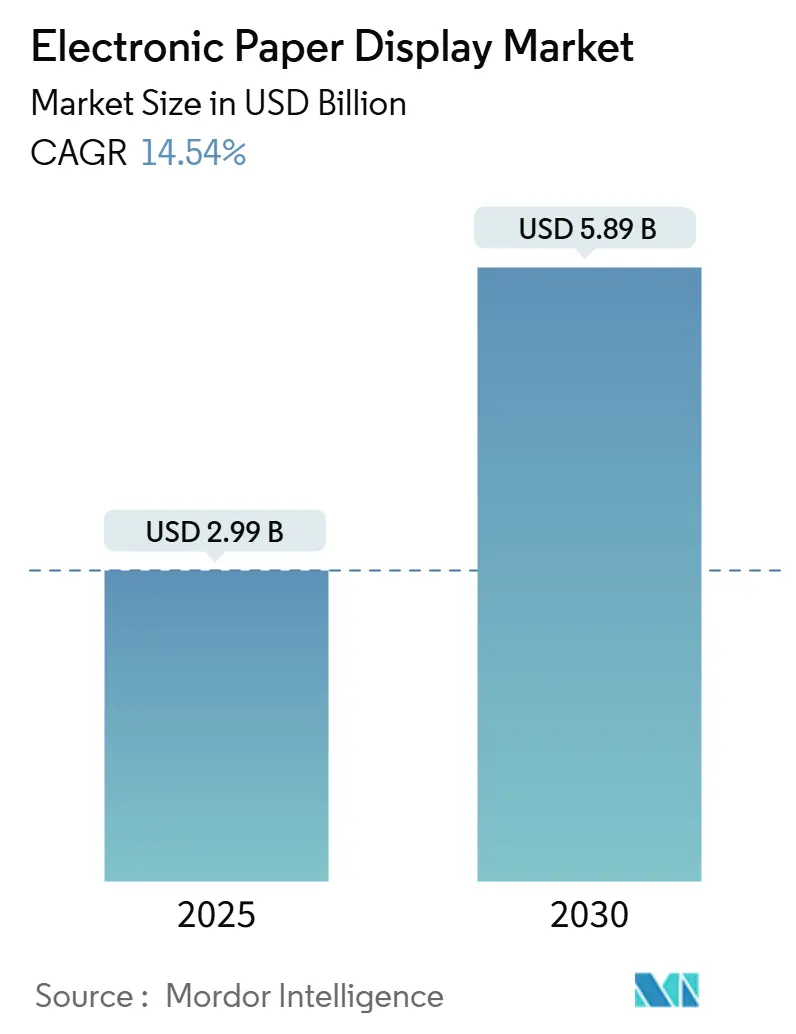
| Market Size (2025) | USD 2.99 Billion |
| Market Size (2030) | USD 5.89 Billion |
| Growth Rate (2025 - 2030) | 14.54% CAGR |
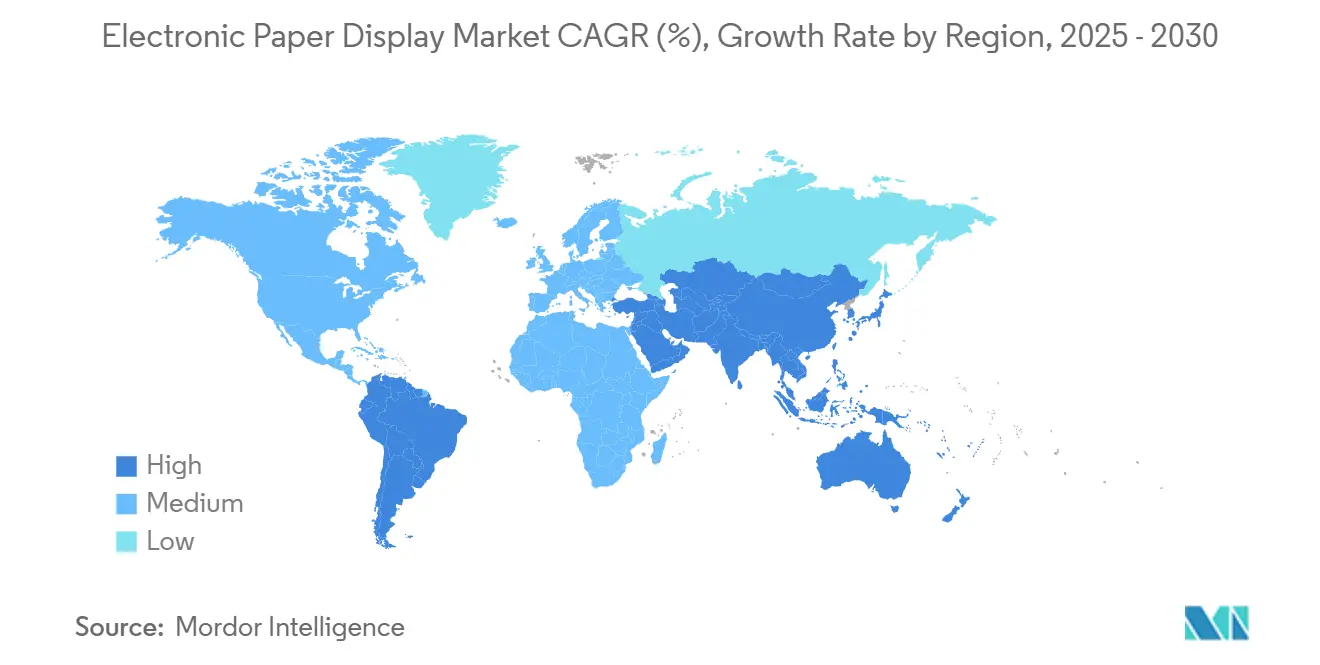
| Fastest Growing Market | Asia Pacific |
| Largest Market | North America |
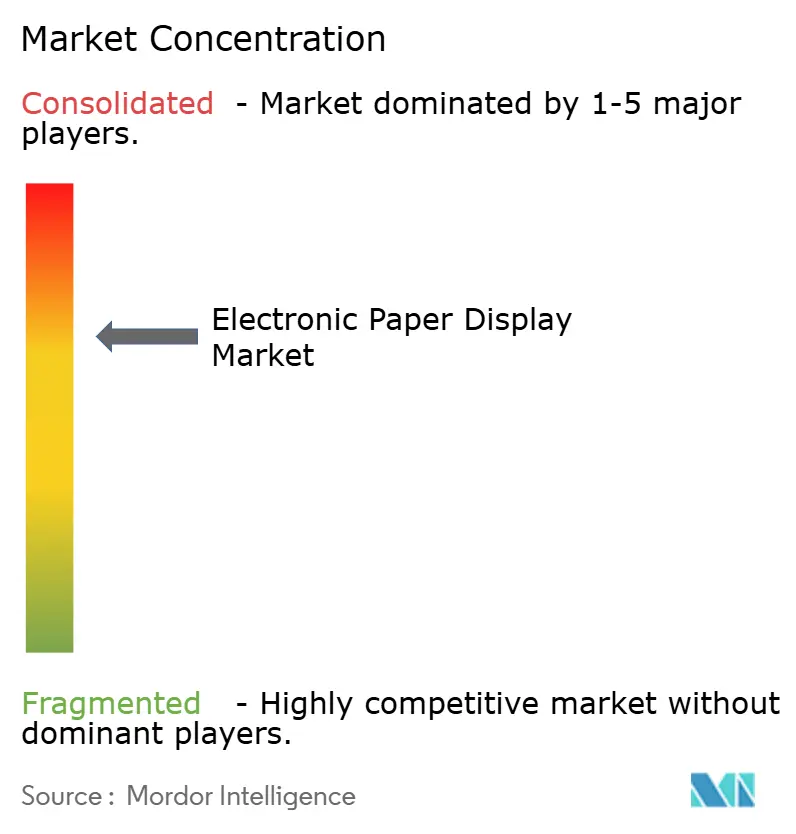
| Market Concentration | Medium |
Major Players *Disclaimer: Major Players sorted in no particular order Image © Mordor Intelligence. Reuse requires attribution under CC BY 4.0. | |
Electronic Paper Display Market Analysis by Mordor Intelligence
The e-paper display market size is USD 2.99 billion in 2025 and is forecast to reach USD 5.89 billion by 2030, delivering a 14.54% CAGR. Rapid adoption in consumer electronics, retail automation, and battery-free IoT sensors anchors the expansion, while breakthroughs in color reproduction, flexible substrates, and ultra-low-power architectures unlock new addressable spaces. Heightened sustainability mandates, notably the EU Packaging and Packaging Waste Regulation, steer public procurement toward paper-free information systems. At the same time, rising defense demand for sunlight-readable ruggedized maps and the roll-out of energy-harvesting modules for industrial monitoring create additional revenue streams. Competitive activity intensifies as incumbents scale large-format production and newcomers introduce electro-fluidic alternatives that attack refresh-rate constraints.
Key Report Takeaways
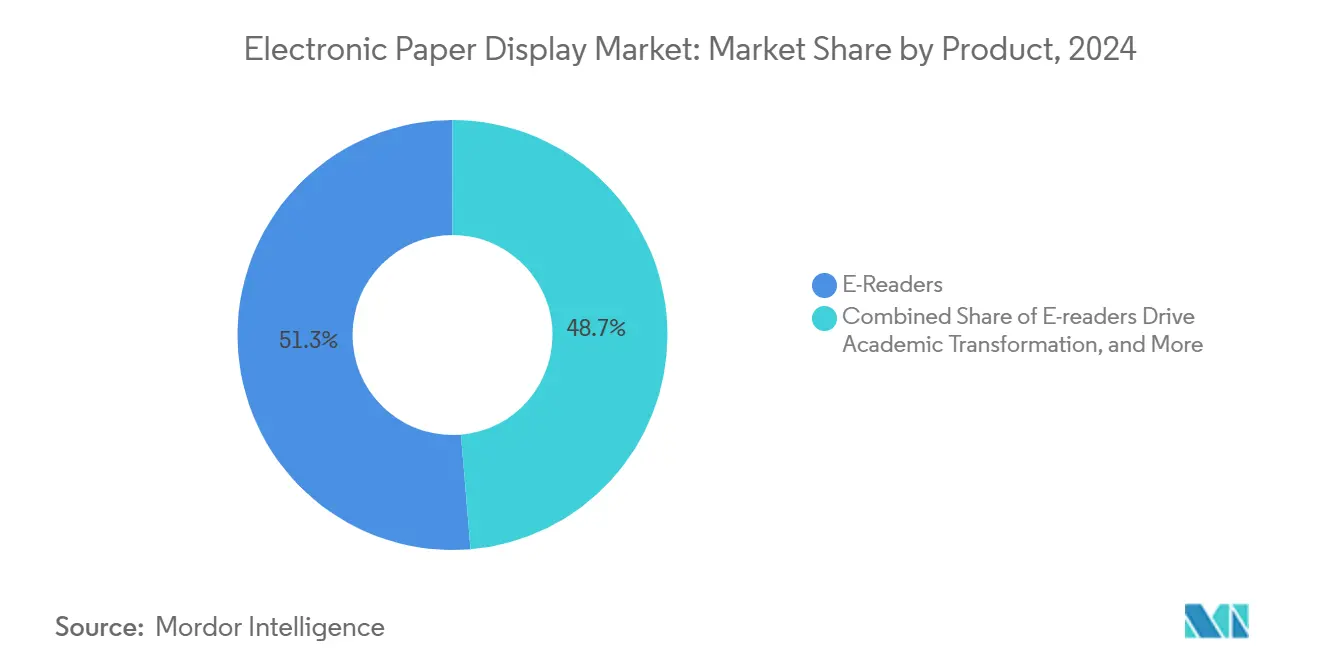
- By product category, e-readers led with 51.34% revenue share in 2024; electronic shelf displays are projected to expand at a 15.64% CAGR through 2030.
- By type, flat EPDs accounted for 62.74% of the e-paper display market share in 2024, while flexible and curved EPDs are forecast to register a 22.63% CAGR to 2030.
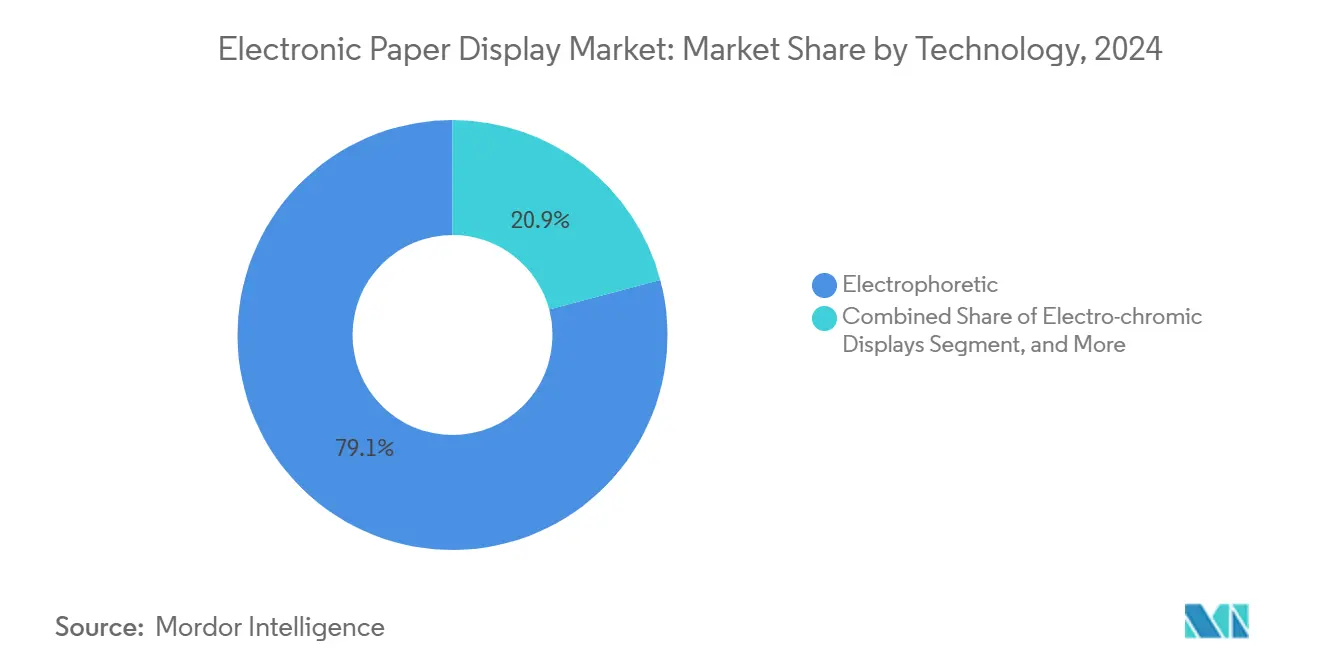
- By technology, electrophoretic platforms dominated with 79.12% share of the e-paper display market size in 2024; electro-fluidic displays are forecast to surge at a 27.65% CAGR through 2030.
- By end-user, consumer electronics held 44.31% of the e-paper display market size in 2024; retail and hospitality end-uses are expected to rise at a 16.76% CAGR to 2030.
- By geography, Asia Pacific captured 35.84% of the e-paper display market share in 2024, whereas South America is positioned for the fastest 15.64% CAGR to 2030.
- E Ink Holdings, Sony, and BOE Technology collectively controlled more than 55% of 2024 revenue, underscoring a moderately concentrated arena driven by patented electrophoretic processes.
Global Electronic Paper Display Market Trends and Insights
Drivers Impact Analysis*
| Driver | (~) (%) Impact on CAGR Forecast | Geographic Relevance | Impact Timeline |
|---|---|---|---|
| E-readers’ continued dominance in academic digitization | +3.2% | North America and Europe | Medium term (2-4 years) |
| Ultra-low-power displays enabling battery-free IoT sensors | +4.1% | APAC and North America | Long term (≥ 4 years) |
| Regulatory push for paper-waste reduction in public administration | +2.8% | Europe and North America | Medium term (2-4 years) |
| Military demand for sunlight-readable ruggedized maps | +1.9% | North America and Europe | Short term (≤ 2 years) |
| Emerging dynamic color e-paper for outdoor advertising | +2.4% | APAC and North America | Long term (≥ 4 years) |
| Flexible substrates expanding automotive applications | +2.0% | Global | Long term (≥ 4 years) |
| Source: Mordor Intelligence | |||
E-readers’ Continued Dominance in Academic Digitization
Academic institutions ramp digital curricula, positioning color e-readers as core assets for paperless learning. Kobo’s Libra Colour and Clara Colour models, both IPX8-rated and powered by E Ink Kaleido 3, address durability and engagement expectations. Ten-year device lifespans and cloud-synced note-taking reduce recurring paper spend, while publishers report 40% higher learner interaction versus static PDFs. Interactive annotation and collaborative workflows further embed e-readers into campus infrastructure.
Ultra-Low-Power Displays Enabling Battery-Free IoT Sensors
Industrial and smart-city deployments seek displays that operate maintenance-free for a decade. HaiLa Technologies and e-peas validated a Wi-Fi backscatter chip energized by ambient light that drives e-paper status panels, proving the viability of battery-independent nodes.[1]HaiLa Technologies, “Battery-Free Wi-Fi Backscatter Demonstration,” mdpi.comDracula Technologies’ LAYER OPV harvests indoor lighting to power displays in logistics and environmental sensing, reinforcing the convergence of bistable screens with energy-harvesting silicon.
Regulatory Push for Paper-Waste Reduction in Public Administration
The EU Packaging and Packaging Waste Regulation mandates lower paper footprints in public venues beginning August 2026. Municipalities replacing printed notices with e-paper boards report 60–80% print-cost declines while meeting carbon targets. Sunlight readability and negligible standby power match smart-city needs for outdoor signage and transit information.[2]European Commission, “Packaging and Packaging Waste Regulation (PPWR),” europa.eu
Military Demand for Sunlight-Readable Ruggedized Maps
Defense agencies prioritize displays that remain legible in bright daylight, resist electromagnetic interference, and consume minimal power. The U.S. DoD Advisory Group identified electrophoretic E Ink as the preferred non-video technology for field operations, influencing procurement protocols for soldier-borne and vehicle-mounted terminals.[3]U.S. Department of Defense, “Advisory Group on Electron Devices Report,” defense.gov
Restraints Impact Analysis*
| Restraint | (~) (%) Impact on CAGR Forecast | Geographic Relevance | Impact Timeline |
|---|---|---|---|
| Slow refresh rates limiting video-centric use | –2.7% | Global | Medium term (2-4 years) |
| Persistent royalty cost of proprietary electrophoretic IP | –1.8% | Global | Long term (≥ 4 years) |
| Supply bottlenecks in color-filter materials | –1.4% | APAC | Short term (≤ 2 years) |
| Competition from micro-LED retail signage | –1.1% | North America and Europe | Medium term (2-4 years) |
| Source: Mordor Intelligence | |||
Slow Refresh Rates Limiting Video-Centric Applications
Even Samsung’s latest Spectra 6 units deliver 1-second updates—insufficient for smooth animation. Retailers favor micro-LED for attention-grabbing content, confining e-paper to static menus and price tags despite its energy advantage.
Persistent Royalty Cost of Proprietary Electrophoretic IP
E Ink’s broad patent estate obliges challengers to remit licensing fees, tightening margins for small vendors. Electro-fluidic and electro-wetting alternatives attract R&D interest as pathways around royalty obligations, yet economies of scale remain elusive.
*Our forecasts treat driver/restraint impacts as directional, not additive. The impact forecasts reflect baseline growth, mix effects, and variable interactions.
Segment Analysis
By Product: E-readers Drive Academic Transformation
E-readers commanded 51.34% of 2024 revenue, illustrating entrenched demand in education and leisure reading. The e-paper display market size for electronic shelf labels is projected to balloon at a 15.64% CAGR as retailers digitize pricing and leverage AI for real-time promotions. Large-screen auxiliary displays gain appeal among remote workers who seek eye comfort and minimal energy draw.
Robust procurement of color e-readers supports platform stickiness, while smart-label providers such as SOLUM integrate computer vision that lifts purchase conversion by 7%. Automotive prototypes like BMW’s exterior color panels forecast diversification of the e-paper display market beyond handhelds.


By Type: Flexible Displays Reshape Use-Cases
Flat EPDs retained a 62.74% e-paper display market share during 2024 through cost leadership and mature tooling. Flexible and curved variants are on a 22.63% CAGR trajectory, propelled by BOE’s expanded capacity and roll-to-roll substrate advances. [4]BOE Technology Group, “2024 Financial Outlook,” boe.com The e-paper display market size for flexible modules is expected to reach USD 1.48 billion by 2030 as installations migrate to vehicle dashboards and architectural wraps.
Curvable panels enable conformal placement on cylindrical kiosks and luggage tags, broadening design freedom. Ruggedness without backlight fracture risk positions flexible e-paper for industrial signage and smart packaging.
By Technology: Electrophoretic Dominance Endures
Electrophoretic platforms held 79.12% share thanks to stable supply chains and bistable power efficiency. Electro-fluidic technology, however, is scoring a 27.65% CAGR by overcoming refresh-rate and color-gamut limitations. Hybrid stacks that fuse cholesteric LCD reflectivity with electrophoretic particles appear in anti-counterfeiting labels, reinforcing the adaptive nature of the e-paper display market.
Emerging fluorescent electrophoretic systems introduce micro-security watermarks visible under UV, opening niches in pharmaceuticals and currency authentication.
By End-User: Consumer Electronics Lead Retail Transformation
Consumer electronics contributed 44.31% of 2024 turnover, sustained by vibrant e-reader ecosystems. Retail and hospitality outpace at 16.76% CAGR as shelf-edge smart labels graduate from passive price tags to interactive customer gateways. Large hotel chains deploy lobby signage that syncs with property-management software, illustrating cross-department efficiency gains.
Utility meters, prescription packaging, and transport tickets populate the diversified “Others” bucket, affirming the broadening canvas for the e-paper display industry.
Geography Analysis
Asia Pacific held 35.84% share in 2024, underpinned by dense manufacturing clusters in China, Taiwan, and South Korea and buoyant regional demand from electronics and retail. Beijing’s digital-commerce subsidies and Taipei’s component ecosystems expedite the export of cost-optimized electrophoretic modules. Samsung’s March 2025 ramp of 75-inch Kaleido 3 panels in South Korea augments large-format supply for global signage roll-outs.
North America and Europe combine R&D heft with premium end-use demand. The United States channels defense funding into sunlight-readable tactical gear, while EU eco-design mandates stimulate citywide deployments of low-power transit boards. Institutional procurement accelerates as municipal councils pivot to digital noticeboards that slash repetitive printing costs.
South America, although only 6.8% of 2024 value, is forecast for a 15.64% CAGR on the back of Brazilian hypermarket smart-label roll-outs and Argentine smart-city tenders. Favorable import-duty revisions on educational devices further catalyze e-reader penetration in public schools, broadening the regional base of the e-paper display market.

Competitive Landscape
E Ink Holdings, Sony, and BOE Technology jointly command just over half of global sales, reflecting moderate concentration. E Ink leverages a patent moat and a new AUO Display Plus joint venture to attack large-format opportunities for corporate collaboration boards. Sony continues to refine Digital Paper tablets for secure document workflows in legal and healthcare.
New entrants pursue niche differentiation. U.K.-based Plastic Logic targets wearables with ultra-thin flexible cells, while U.S. start-up Azumo pairs reflective panels with front-lit modules for low-light conditions. Samsung’s pivot into 75-inch color signage amplifies competitive pressure in the premium spectrum, pushing incumbents to accelerate electro-fluidic R&D.
Strategic alliances proliferate: Visionect teams with Sharp-NEC to embed cloud-managed controllers into transport displays, and DisplayData links AI analytics with shelf labels to automate price elasticity modeling. The race centers on refresh improvement, vivid color, and form-factor flexibility rather than cost-only battles.
Electronic Paper Display Industry Leaders
Plastic Logic GmbH
E-Ink Holdings Inc.
Clear Ink Displays
Pervasive Displays Inc.
Toppan Printing Co. Ltd
- *Disclaimer: Major Players sorted in no particular order

Recent Industry Developments
- April 2025: E Ink Holdings and AUO Display Plus formed a joint venture to scale large-format ePaper modules for signage and collaboration boards.
- March 2025: Samsung began mass production of 75-inch Kaleido 3 and 32-inch Spectra 6 panels featuring 65,000 colors.
- February 2025: SOLUM showcased AI-powered electronic shelf labels at CES 2025, indicating 7% conversion gains.
- January 2025: BMW announced progression of color-changing E Ink exterior technology toward production readiness for 2027 vehicle models.


Global Electronic Paper Display Market Report Scope
The electronic paper display market is segmented by product (e-readers, electronics shelf displays (ESDs), auxiliary displays, others (mobile devices, smart cards, poster and signage)), by type (flat EPDs, curved/flexible EPDs), by technology (electrophoretic displays (EPD), electrochromic displays, cholesteric liquid crystal displays (ChLCD), electro-wetting displays, electro-fluidic displays, others), by end user (consumer electronics, institutional, retail, other end users (media and entertainment, transportation, healthcare, industrial/smart packaging, and architectural applications)), by geography (North America [United States, Canada], Europe [Germany, United Kingdom, France, Italy, Netherlands, Switzerland, and the Rest of Europe], Asia Pacific [China, India, Japan and the Rest of Asia Pacific], Latin America, And Middle East And Africa). the report offers market forecasts and size in value (USD) for all the above segments.
| E-readers |
| Electronic Shelf Displays |
| Auxiliary / Secondary PC Displays |
| Others (Cards, Posters, Signage) |
| Flat EPDs |
| Curved / Flexible EPDs |
| Electrophoretic Displays |
| Electro-chromic Displays |
| Cholesteric LCD |
| Electro-wetting |
| Electro-fluidic |
| Other Emerging Technologies |
| Consumer Electronics |
| Institutional / Education |
| Retail and Hospitality |
| Others (Media, Transportation, Healthcare, Packaging, Architecture) |
| North America | United States | |
| Canada | ||
| Mexico | ||
| Europe | Germany | |
| United Kingdom | ||
| France | ||
| Russia | ||
| Rest of Europe | ||
| Asia-Pacific | China | |
| Japan | ||
| India | ||
| South Korea | ||
| Australia | ||
| Rest of Asia-Pacific | ||
| Middle East and Africa | Middle East | Saudi Arabia |
| United Arab Emirates | ||
| Rest of Middle East | ||
| Africa | South Africa | |
| Egypt | ||
| Rest of Africa | ||
| South America | Brazil | |
| Argentina | ||
| Rest of South America | ||
| By Product | E-readers | ||
| Electronic Shelf Displays | |||
| Auxiliary / Secondary PC Displays | |||
| Others (Cards, Posters, Signage) | |||
| By Type | Flat EPDs | ||
| Curved / Flexible EPDs | |||
| By Technology | Electrophoretic Displays | ||
| Electro-chromic Displays | |||
| Cholesteric LCD | |||
| Electro-wetting | |||
| Electro-fluidic | |||
| Other Emerging Technologies | |||
| By End-user | Consumer Electronics | ||
| Institutional / Education | |||
| Retail and Hospitality | |||
| Others (Media, Transportation, Healthcare, Packaging, Architecture) | |||
| By Geography | North America | United States | |
| Canada | |||
| Mexico | |||
| Europe | Germany | ||
| United Kingdom | |||
| France | |||
| Russia | |||
| Rest of Europe | |||
| Asia-Pacific | China | ||
| Japan | |||
| India | |||
| South Korea | |||
| Australia | |||
| Rest of Asia-Pacific | |||
| Middle East and Africa | Middle East | Saudi Arabia | |
| United Arab Emirates | |||
| Rest of Middle East | |||
| Africa | South Africa | ||
| Egypt | |||
| Rest of Africa | |||
| South America | Brazil | ||
| Argentina | |||
| Rest of South America | |||


Key Questions Answered in the Report
How large is the e-paper display market in 2025?
The sector is valued at USD 2.99 billion in 2025 and is projected to climb to USD 5.89 billion by 2030.
Which product type leads revenue?
E-readers account for 51.34% of 2024 sales, reflecting deep penetration in education and consumer reading.
What region grows fastest through 2030?
South America is forecast to advance at a 15.64% CAGR, underpinned by retail digitalization and public-sector digitization.
Which technology dominates?
Electrophoretic displays hold 79.12% of shipment value, supported by mature supply chains and patent protection.
What hinders broader adoption?
Slow refresh rates and ongoing electrophoretic royalties restrict penetration into video-rich or price-sensitive segments.
Page last updated on:


