Interactive Kiosk Market Size and Share
Market Overview
| Study Period | 2020 - 2031 |
|---|---|
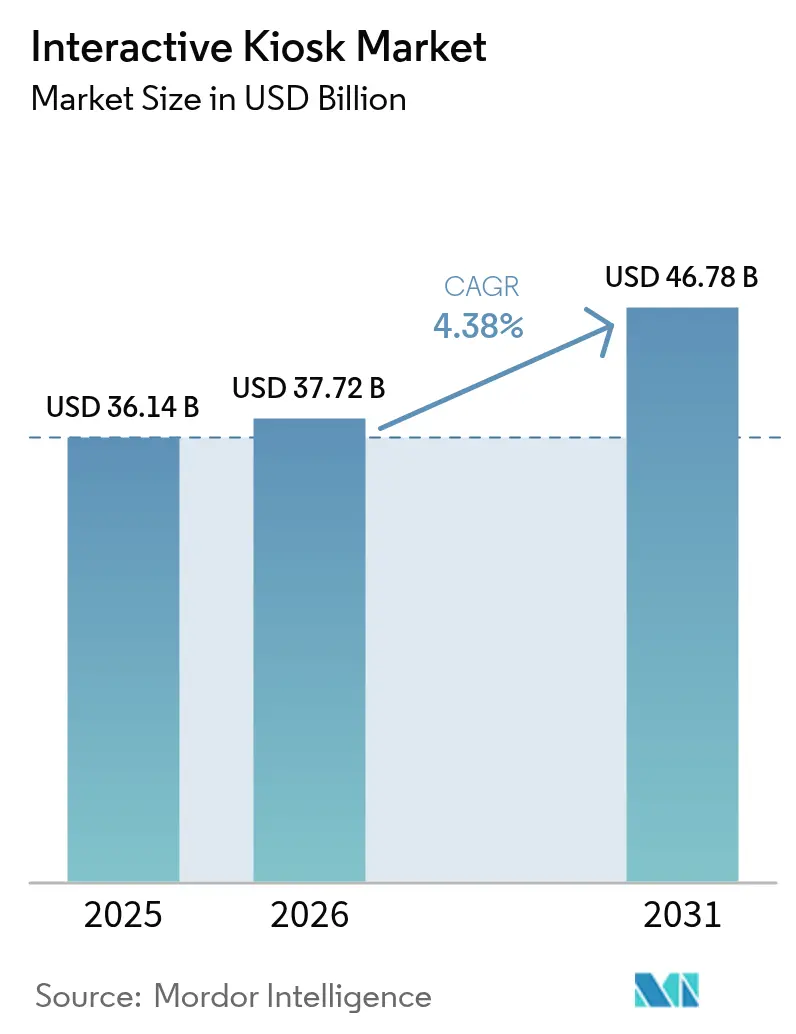
| Market Size (2026) | USD 37.72 Billion |
| Market Size (2031) | USD 46.78 Billion |
| Growth Rate (2026 - 2031) | 4.38% CAGR |
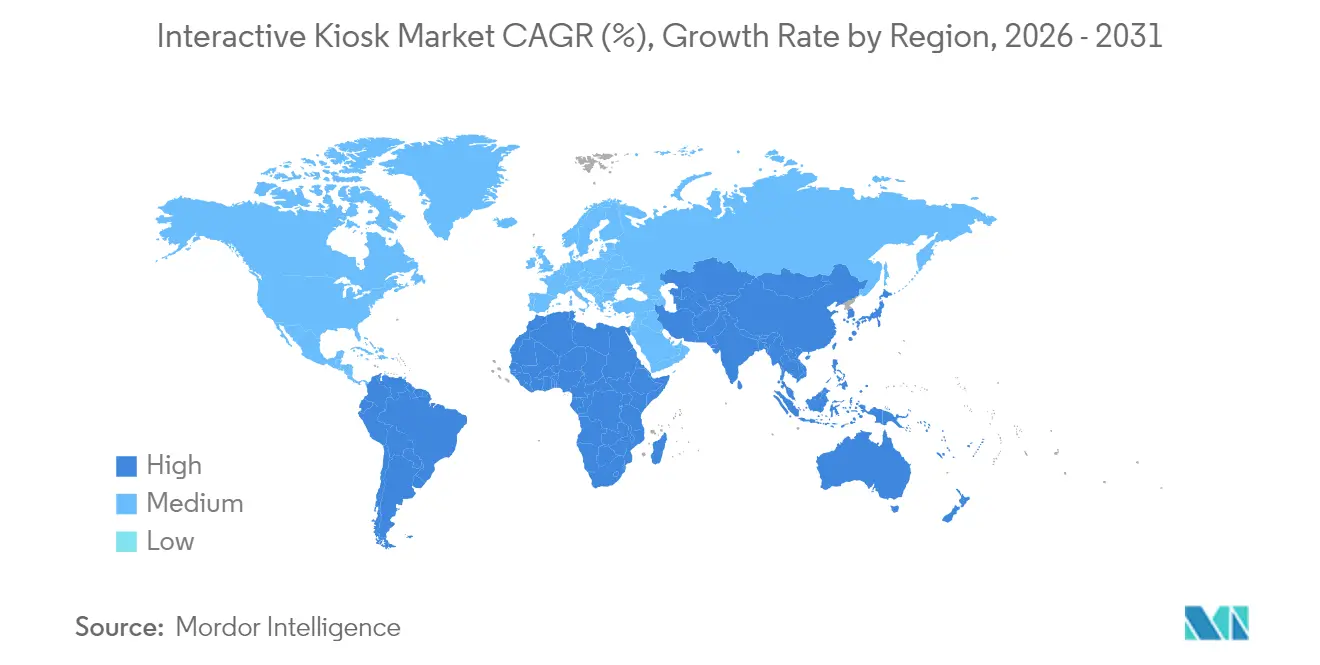
| Fastest Growing Market | Asia Pacific |
| Largest Market | North America |
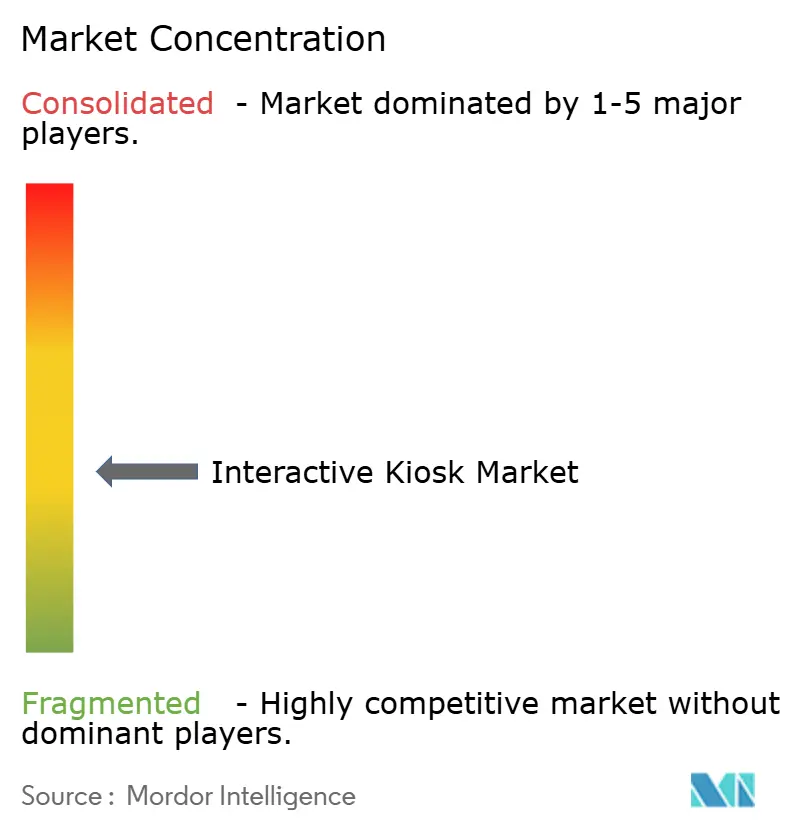
| Market Concentration | Medium |
Major Players *Disclaimer: Major Players sorted in no particular order Image © Mordor Intelligence. Reuse requires attribution under CC BY 4.0. | |
Interactive Kiosk Market Analysis by Mordor Intelligence
The Interactive Kiosk Market size is projected to expand from USD 36.14 billion in 2025 and USD 37.72 billion in 2026 to USD 46.78 billion by 2031, registering a CAGR of 4.38% between 2026 to 2031.
Market Analysis
Stable retail demand, post-pandemic preference for contactless transactions, and cloud-managed fleet roll-outs keep investment levels high even as hardware costs fluctuate. Ticketing, healthcare check-in, and smart-city wayfinding accelerate revenue diversification, while AI-driven personalization and biometric security broaden use cases beyond traditional ATM deployments. North American operators concentrate on software upgrades and managed services, whereas Asia-Pacific providers scale new installations in transportation hubs and government service centers. Market-wide innovation now focuses on energy-efficient ARM processors, fanless enclosures, and haptic touch interfaces that lower total cost of ownership and expand outdoor application viability.
Key Report Takeaways
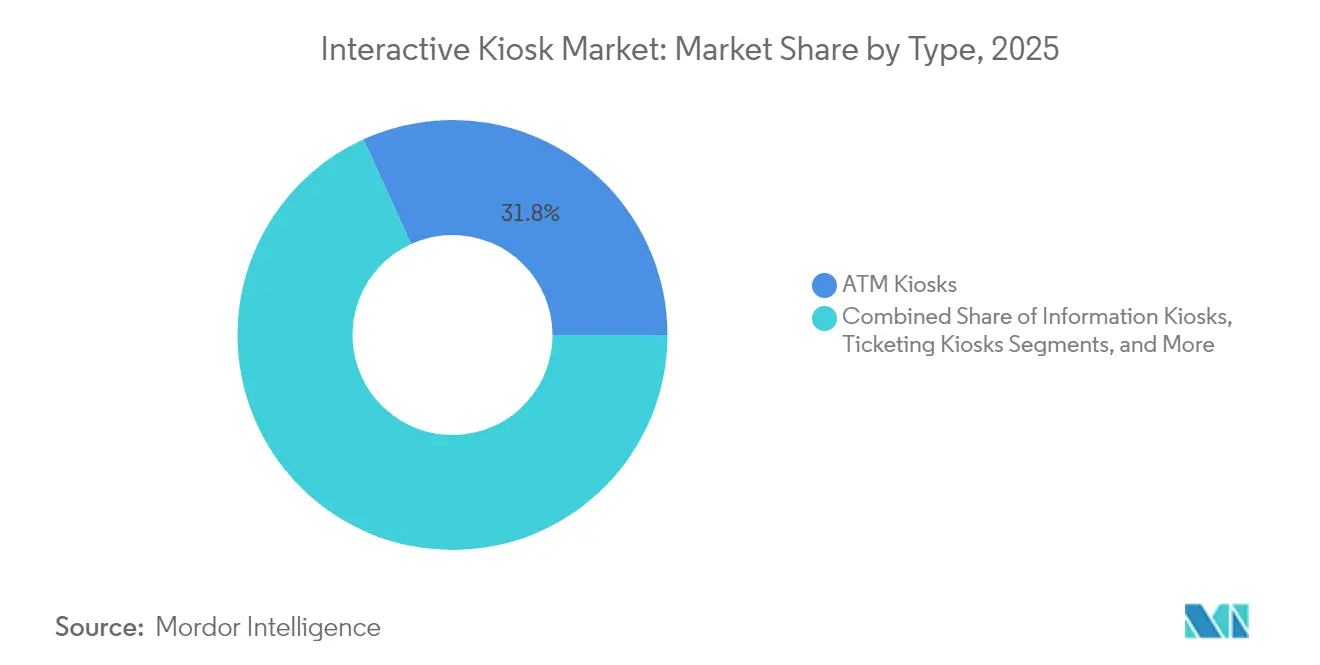
- By type, ATM kiosks held 31.80% of the interactive kiosk market share in 2025 while ticketing kiosks are projected to expand at a 5.22% CAGR through 2031.
- By component, hardware accounted for 55.50% of the interactive kiosk market size in 2025 and services are advancing at a 4.56% CAGR to 2031.
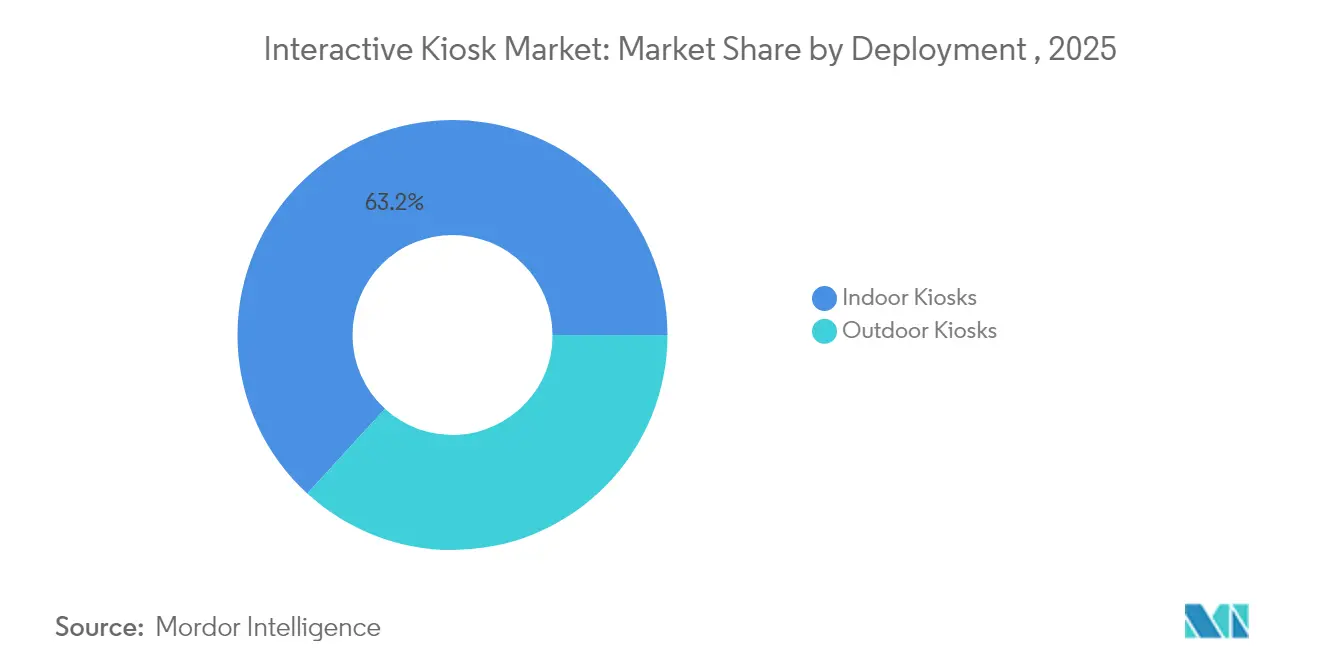
- By deployment, indoor units captured 63.20% revenue in 2025; outdoor kiosks are on track for a 6.05% CAGR through 2031.
- By end user, retail led with 31.60% share of the interactive kiosk market size in 2025, while healthcare applications are growing at a 5.86% CAGR to 2031.
- By region, North America commanded 35.20% of the interactive kiosk market share in 2025; Asia-Pacific is forecast to post a 5.48% CAGR through 2031.
Note: Market size and forecast figures in this report are generated using Mordor Intelligence’s proprietary estimation framework, updated with the latest available data and insights as of 2026.
Global Interactive Kiosk Market Trends and Insights
Drivers Impact Analysis*
| Driver | (~) % Impact on CAGR Forecast | Geographic Relevance | Impact Timeline |
|---|---|---|---|
| Rising preference for unattended self-service | +1.2% | Global, with highest adoption in North America and EU | Medium term (2-4 years) |
| Surge in cloud-managed kiosk fleets | +0.8% | Global, led by Asia-Pacific and North America | Short term (≤ 2 years) |
| More kiosks being installed in growing cities and transport hubs for public services | +0.6% | Asia-Pacific core, spill-over to MEA and Latin America | Long term (≥ 4 years) |
| Biometric-enabled KYC compliance kiosks | +0.4% | Global, with regulatory focus in EU and North America | Medium term (2-4 years) |
| Smart-city curbside digital way-finding roll-outs | +0.3% | North America and EU, expanding to Asia-Pacific urban centers | Long term (≥ 4 years) |
| Energy-efficient fan-less ARM kiosk economics | +0.2% | Global, with early adoption in sustainability-focused markets | Medium term (2-4 years) |
| Source: Mordor Intelligence | |||
Surge in Cloud-Managed Kiosk Fleets
Operators now favor cloud dashboards that push content, run diagnostics, and trigger predictive maintenance from a single console. Advanced Kiosks’ remote-access platform demonstrates service-call reductions that cut lifetime support costs by double-digit percentages. Multi-carrier SIM bundles from POND IoT ensure high uptime even at remote gasoline stations and outdoor transit shelters. As a result, enterprises deploy larger fleets without proportional staff increases, reinforcing ROI and accelerating refresh cycles.
More Kiosks in Growing Cities and Transport Hubs for Public Services
Governments digitize passenger processing and citizen services to manage swelling urban populations. Jamaica’s passport agency ordered 100 biometric kiosks for two international airports, targeting peak-season throughput gains. Seattle approved a revenue-sharing model that funds up to 80 information kiosks downtown, pairing civic content with paid advertising.[1]Seattle Design Commission, “Downtown Digital Wayfinding Program,” seattle.gov These municipal pilots prove public-private structures that de-risk taxpayer funds and create recurring revenue, encouraging replication across emerging markets.
Biometric-Enabled KYC Compliance Kiosks
Financial institutions embed face verification and document authentication to satisfy evolving Know Your Customer rules. UBS adopted iProov’s live-ness detection for remote account opening, reducing onboarding times from days to minutes and curbing identity fraud. Aratek supplies similar multi-factor modules to rural micro-finance operators, expanding financial inclusion in cash-heavy economies.[2]Aratek, “Biometric Solutions Portfolio,” aratek.com NCR Atleos integrates biometric pads into its 600,000-unit ATM footprint, merging convenience with regulated security features. Compliance continues driving feature upgrades, especially in cross-border remittance and high-risk transaction corridors.
Energy-Efficient Fanless ARM Kiosk Economics
Chipmakers now supply system-on-modules that run full multimedia stacks under five watts. Fanless designs slash maintenance visits linked to dust and heat damage. Electrosonic notes that kiosk integrators often need legacy chipsets the semiconductor industry is phasing out, so ARM migration reduces end-of-life risks and stabilizes bill-of-material pricing.[3]Electrosonic, “AV Industry and Chip Shortage Impacts,” electrosonic.com Lower power profiles further align with corporate sustainability targets, easing procurement for outdoor smart-city programs.
Restraints Impact Analysis*
| Restraint | (~) % Impact on CAGR Forecast | Geographic Relevance | Impact Timeline |
|---|---|---|---|
| Escalating cyber-security and privacy compliance cost | -0.7% | Global, with highest impact in EU and North America | Short term (≤ 2 years) |
| High CAPEX for multi-site fleets | -0.5% | Global, particularly affecting SME deployments | Medium term (2-4 years) |
| Volatile supply of >32" industrial touchscreens | -0.3% | Global, with supply chain concentrated in Asia-Pacific | Short term (≤ 2 years) |
| Urban heritage bans on outdoor ad-kiosks | -0.2% | EU and select North American cities | Long term (≥ 4 years) |
| Source: Mordor Intelligence | |||
Escalating Cyber-Security and Privacy Compliance Cost
The proposed American Privacy Rights Act pushes stronger encryption, breach-reporting, and data-minimization mandates that drive security tooling budgets higher, especially for operators handling medical or financial data. Multi-jurisdiction fleets juggle divergent obligations, inflating legal and audit overhead. Larger vendors with in-house security practices absorb these hurdles, widening the gap between incumbents and start-ups.
High CAPEX for Multi-Site Fleets
Full-featured outdoor kiosks, complete with climate-controlled enclosures and hardened glass, cost multiples of indoor units. Operators often delay wide roll-outs or adopt leasing models. NCR Voyix now offers an outsourced hardware subscription that converts upfront spend to operating expense. Flexible financing grows, yet small retailers still phase deployments room by room, slowing aggregate demand.
*Our forecasts treat driver/restraint impacts as directional, not additive. The impact forecasts reflect baseline growth, mix effects, and variable interactions.
Segment Analysis
By Type: ATM Dominance Amid Ticketing Surge
ATM kiosks held 31.80% of the interactive kiosk market in 2025. The installed base of 600,000 units that NCR Atleos services anchors recurring cash-handling demand even as mobile banking grows. Ticketing kiosks, however, lead growth with a 5.22% CAGR to 2031, fueled by airport expansion and rail modernization across Asia-Pacific. Information and patient-interactive kiosks attract healthcare budgets that seek faster intake processes, while crypto-exchange and government-service kiosks enter the long-tail.
Airports prefer biometric gates that combine boarding pass validation and immigration checks, cutting per-passenger processing time and freeing staff for exception-handling. Stadiums and theme parks adopt QR-based ticket prints to reduce fraud. These dynamics keep manufacturers investing in more modular designs that swap printers or scanners without full system swaps, prolonging asset life and raising aftermarket revenue.


By Component: Hardware Leadership With Services Acceleration
Hardware secured 55.50% revenue in 2025, yet pricing pressure and chipset volatility erode margins. The interactive kiosk market size for services is forecast to rise at 4.56% CAGR, as operators outsource monitoring, firmware patching, and content scheduling to managed-service specialists. Software sits between, riding AI personalization and voice-assistant interfaces that deepen engagement times.
Touch panel costs soften when capacity builds in China, but replacement cycles remain seven years or longer, motivating vendors to push annuity-style cloud dashboards. Fleet owners increasingly sign multi-year service-level agreements that bundle 24×7 uptime commitments and analytics insights. This shift realigns revenue mix from 70:30 hardware-first toward a balanced profile by decade-end.
By Deployment: Indoor Stability Versus Outdoor Innovation
Indoor locations accounted for 63.20% of 2025 shipments thanks to controlled climates and predictable footfall within stores, clinics, and corporate lobbies. Outdoor units post a 6.05% CAGR on smart-city demand and new anti-glare, high-brightness panels that remain visible in direct sun. The interactive kiosk market size for outdoor formats grows faster but from a smaller base, catching municipal investments aimed at tourism, public transit, and curbside commerce.
Seattle’s incoming 80-unit network underscores how ad-supported models fund free Wi-Fi, maps, and emergency alerts. Hardware designers combat temperature swings with passive ventilation and vandal-resistant metal shells, lowering mean-time-between-service calls. As energy costs climb, ARM-based motherboards cut draw below 20 watts, enabling solar-assisted power at remote trailheads and parking lots.
By End-User Industry: Retail Leadership With Healthcare Momentum
Retail retained 31.60% revenue in 2025, inclusive of self-checkout, endless-aisle ordering, and quick-service restaurant kiosks. Up-selling algorithms raise basket sizes by showcasing add-ons without perceived staff pressure. Healthcare follows fastest, tracking a 5.86% CAGR through 2031 as hospitals automate triage and integrate telemedicine modules that connect to off-site specialists.
Transportation stays essential, bundling ticket issuance, baggage tags, and biometric boarding. BFSI refreshes bank-branch layouts with lobby tellers that issue debit cards on the spot. Government agencies roll out tax, licensing, and documentation kiosks to shrink counter queues, particularly where staffing budgets remain flat.
Geography Analysis
North America controls 35.20% of 2025 revenue, driven by entrenched self-checkout culture, card-present payment infrastructure, and robust cybersecurity frameworks. Operators focus on software overhauls that layer loyalty enrollment and digital wallets onto existing kiosks. Smart-city projects such as Seattle’s digital wayfinding plan keep outdoor momentum alive despite heritage zoning hurdles. Regulatory clarity around ADA accessibility further influences design specifications and supplier selection.
Asia-Pacific stands out as the fastest-growing region with a 5.48% CAGR through 2031. Rapid urbanization in India and Southeast Asia triggers airport and metro station upgrades that specify ticketing and information kiosks as standard elements. Domestic manufacturing concentration allows shorter lead times and cost advantages, though component shortages periodically disrupt shipping schedules. Case studies like Taiwan’s theme park adoption of Advantech units highlight regional suppliers’ ability to bundle hardware, software, and maintenance into turnkey deals.
Europe maintains steady demand underpinned by GDPR-compliant solutions and tourism-anchored deployments in rail and hospitality. Operators invest in biometric boarding and digital VAT refund kiosks that serve international travelers. The Middle East and Africa expand from a smaller base, prioritizing government-service terminals and mall-based retail kiosks. Latin America invests in urban mobility kiosks tied to bus rapid transit corridors, though currency volatility occasionally slows procurement cycles.

Competitive Landscape
The interactive kiosk market features a moderate concentration. NCR Corporation and Diebold Nixdorf leverage decades-long ATM expertise to upsell cash recycling and biometric verification. KIOSK Information Systems, Olea Kiosks, and Advantech target custom builds in retail, healthcare, and smart-city verticals. Patent filings around gesture control and contactless display glass suggest differentiation now centers on user experience more than mechanical engineering.
Cloud-native challengers pursue service-first contracts that wrap hardware leasing, 99.9% uptime SLAs, and AI analytics. NCR Voyix pivoted toward an as-a-service model that shifts revenue to recurring subscriptions and mitigates hardware margin compression. Vendors increasingly partner with telecom carriers for bundled connectivity, echoing mobile-device go-to-market playbooks. Hardware commoditization pushes incumbents to invest in branded software layers, proprietary device management portals, and marketplace ecosystems that let third-party developers add apps.
Strategic alliances emerge between biometric sensor makers and enclosure fabricators to deliver turnkey KYC stations that banks can install within weeks. Component makers such as SigmaSense add haptic feedback to panels, aiming to comply with disability guidelines and improve cold-weather gloved interactions. Supply-chain integration, regulatory depth, and scalable cloud architecture now separate leaders from niche fabricators as the interactive kiosk market evolves toward platform economics.
Interactive Kiosk Industry Leaders
KIOSK Information Systems
NCR Corporation
Embross Ltd
Meridian Kiosks LLC
Advantech Co. Ltd
- *Disclaimer: Major Players sorted in no particular order

Recent Industry Developments
- June 2025: Philadelphia Art Commission cleared Bicycle Transit Systems to install IKE Smart City kiosks at Indego bike-share stations, combining LED dual-sided touchscreens with community content and ad revenue streams.
- June 2025: Seattle City Council approved Phase I rollout of 30 downtown digital kiosks with an option for 50 in Phase II, embedding revenue-sharing with local business improvement districts.
- April 2025: NCR Voyix reported USD 876 million Q2 2024 revenue and sustained USD 55 million R&D spend focused on cloud platforms for retail and digital banking.
- March 2025: Diebold Nixdorf highlighted DN Series expansion targeting North American self-service upgrades amid declining legacy hardware sales.
- January 2025: SigmaSense unveiled haptic and gesture-recognition touch sensing at CES 2025, enhancing kiosk accessibility and usability.


Research Methodology Framework and Report Scope
Market Definitions and Key Coverage
According to Mordor Intelligence, our study tracks the global interactive kiosk market as all newly shipped self-service terminals that combine computing hardware, network connectivity, and a touch or gesture interface to enable transactions, ticketing, check-in, information search, or bill payment across public venues such as retail stores, banks, airports, hospitals, and government offices.
Scope exclusion: Un-networked digital signs and simple vending machines without user interaction are not counted.
Segmentation Overview
- By Type
- ATM Kiosks
- Information Kiosks
- Ticketing Kiosks
- Patient Interactive Kiosks
- Other Types
- By Component
- Hardware
- Software
- Services
- By Deployment
- Indoor Kiosks
- Outdoor Kiosks
- By End-user Industry
- Retail
- BFSI
- Healthcare
- Transportation (Airports, Rail, Bus)
- Hospitality
- Government and Public Sector
- Others (Education, Entertainment)
- By Geography
- North America
- United States
- Canada
- Mexico
- South America
- Brazil
- Argentina
- Rest of South America
- Europe
- Germany
- United Kingdom
- France
- Italy
- Spain
- Russia
- Rest of Europe
- Asia-Pacific
- China
- Japan
- India
- South Korea
- Australia
- Rest of Asia-Pacific
- Middle East and Africa
- GCC
- Turkey
- South Africa
- Rest of Middle East and Africa
- North America
Detailed Research Methodology and Data Validation
Primary Research
Interviews with kiosk manufacturers, display component suppliers, retail IT heads, airport authority planners, and digital-payment integrators across North America, Europe, Asia-Pacific, and the Middle East confirmed price bands, typical refresh cycles, and emerging use cases. Follow-up surveys with facility managers clarified indoor versus outdoor deployment shares and service revenue take-rates.
Desk Research
Our analysts assembled foundational data from open sources such as the World Bank's urbanization series, Eurostat passenger movement files, the U.S. Federal Reserve's ATM density tables, and trade association releases covering retail store counts and airport expansions. These helped us size the addressable install base and understand channel mix shifts. We then tapped paid repositories, D&B Hoovers for OEM financials and shipment commentary, Dow Jones Factiva for deal flow, and Questel for patent momentum to enrich technology adoption timelines. The examples named illustrate key inputs; many other materials were consulted during validation.
Market-Sizing & Forecasting
A top-down reconstruction of global demand, using installed retail sites, banking branch density, passenger traffic, and smart-city budget outlays, establishes the value pool. Select bottom-up checks, sampled OEM shipments multiplied by average selling price, services attach ratios, and software license fees, are layered in to tighten regional splits. Key variables modeled include ATM replacement cadence, self-checkout penetration in grocery chains, NFC-enabled transaction share, outdoor enclosure cost curves, and public Wi-Fi coverage growth. A multivariate regression links these drivers to kiosk revenues and projects them through the forecast period, with scenario analysis adjusting for currency swings and regulatory shifts.
Data Validation & Update Cycle
Outputs pass variance screens against import records and independent traffic metrics before a peer review. We refresh every twelve months and issue interim tweaks when material events, large government tenders, supply shocks, or rule changes occur, ensuring clients always receive an up-to-date baseline.
Why Our Interactive Kiosk Baseline Earns Decision-Maker Trust
Published estimates often diverge because firms choose different scope boundaries, price assumptions, and refresh cadences.
Below, we contrast current-year values.
Benchmark comparison
| Market Size | Anonymized source | Primary gap driver |
|---|---|---|
| USD 36.14 B (2025) | Mordor Intelligence | - |
| USD 37.24 B (2025) | Global Consultancy A | Counts refurbished units and bundles software twice |
| USD 33.90 B (2024) | Industry Association B | Excludes managed services revenue and uses 2024 FX rates |
| USD 35.00 B (2025) | Regional Consultancy C | Applies uniform ASP, ignoring outdoor-grade cost premium |
Differences stem mainly from whether refurbished machines or service contracts are included, the granularity of average selling prices, and currency treatment. By aligning scope tightly to new installations plus first-year software and service income, applying segment-specific price curves, and refreshing models annually, Mordor delivers a balanced, transparent baseline stakeholders can reproduce and trust.


Key Questions Answered in the Report
What is the current value of the interactive kiosk market?
The interactive kiosk market size is valued at USD 37.72 billion in 2026 with a forecast to reach USD 46.78 billion by 2031.
Which region shows the highest growth rate?
Asia-Pacific registers the fastest regional CAGR at 5.48% through 2031 owing to rapid urbanization and smart-city investments.
Why are services outperforming hardware in future revenue growth?
Managed services and cloud-based fleet management lower operational complexity and deliver predictive maintenance, producing a 4.56% CAGR for services versus slower hardware growth.
How are biometric kiosks enhancing financial services?
Biometric face-verification kiosks cut onboarding times from days to minutes while meeting stringent KYC regulations, thus improving customer experience and compliance simultaneously.
Page last updated on:


