Interactive Display Market Size and Share
Market Overview
| Study Period | 2020 - 2031 |
|---|---|
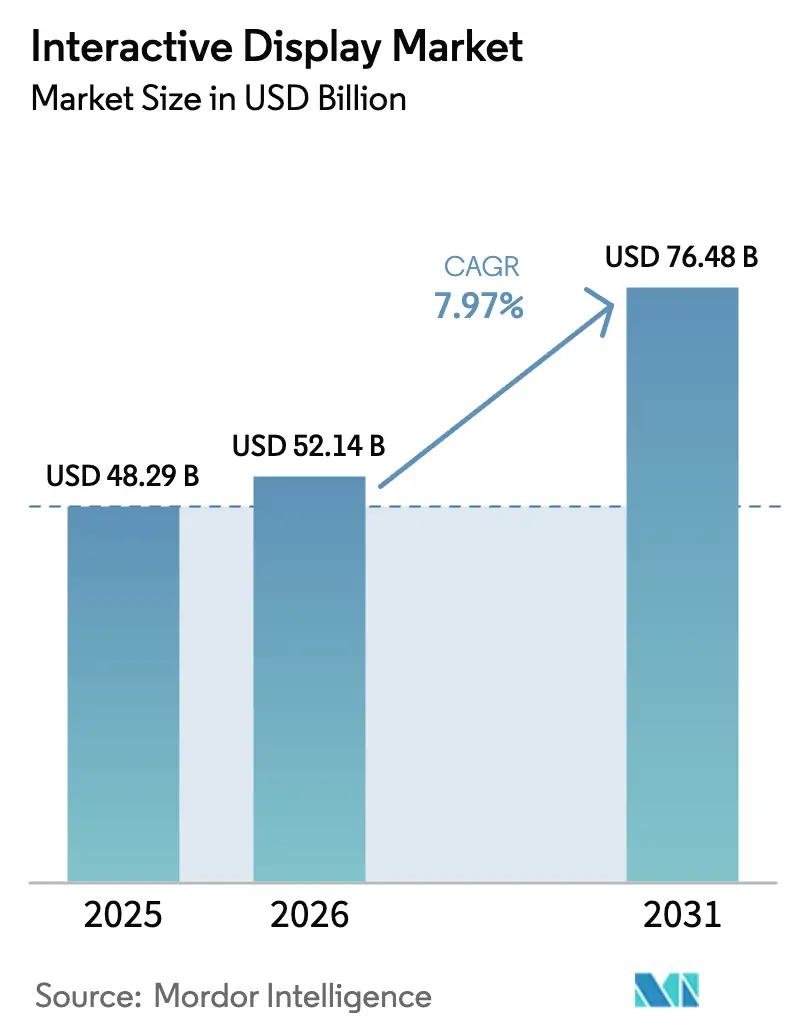
| Market Size (2026) | USD 52.14 Billion |
| Market Size (2031) | USD 76.48 Billion |
| Growth Rate (2026 - 2031) | 7.97% CAGR |
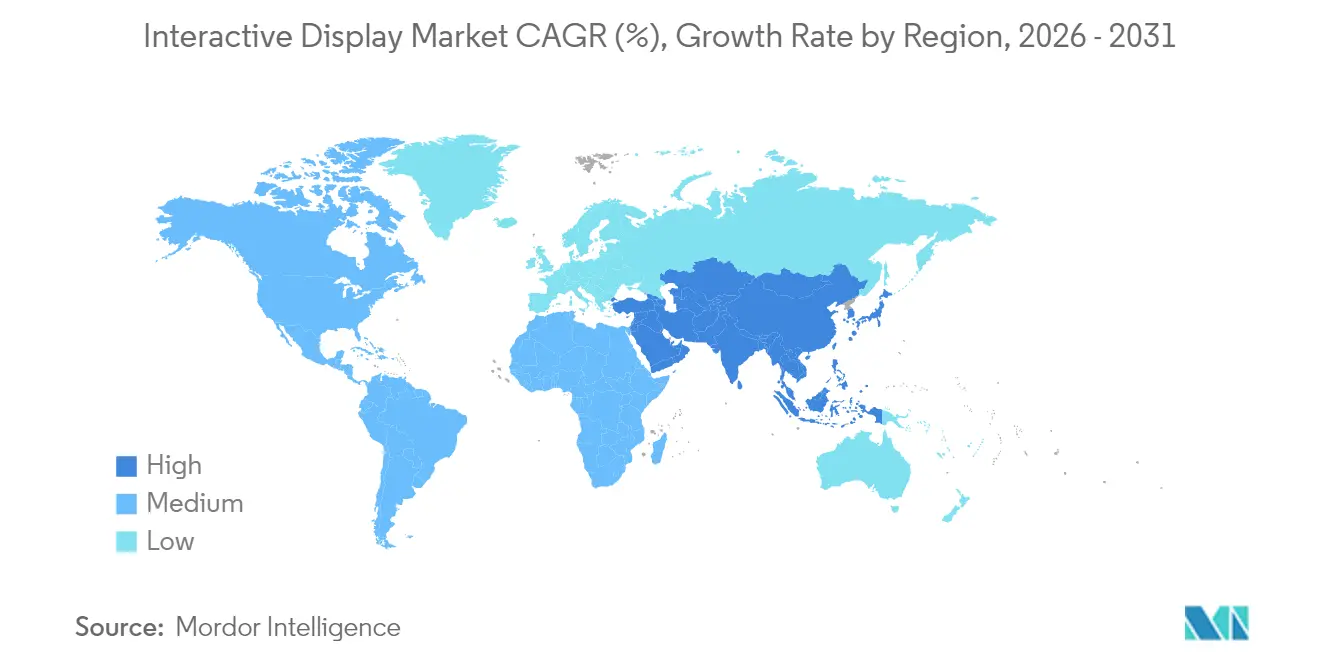
| Fastest Growing Market | Middle East and Africa |
| Largest Market | Asia |
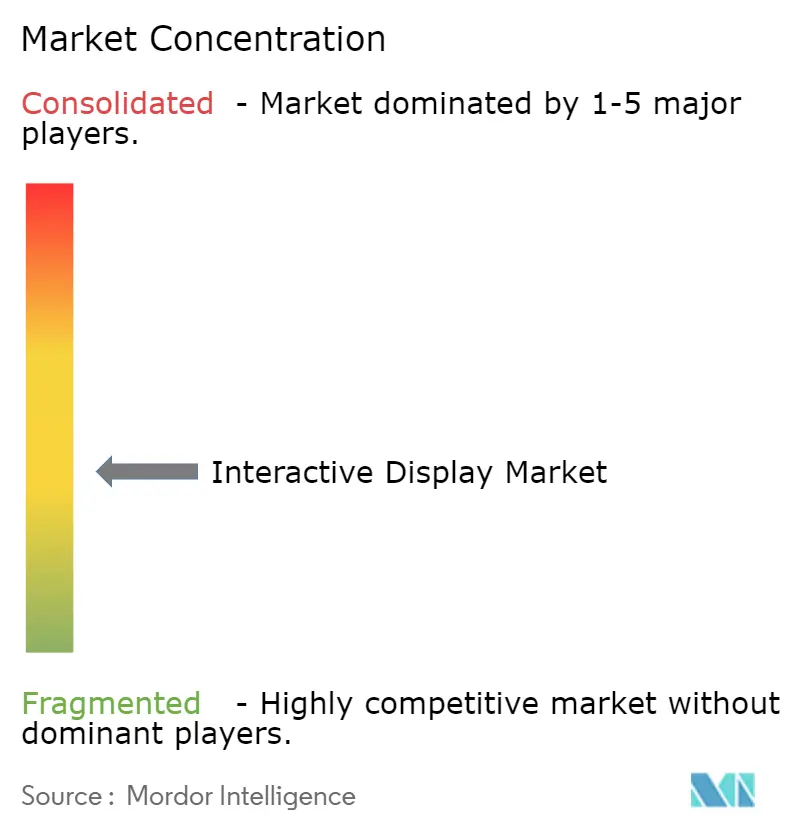
| Market Concentration | Medium |
Major Players *Disclaimer: Major Players sorted in no particular order Image © Mordor Intelligence. Reuse requires attribution under CC BY 4.0. | |
Interactive Display Market Analysis by Mordor Intelligence
The Interactive Display Market size is expected to increase from USD 48.29 billion in 2025 to USD 52.14 billion in 2026 and reach USD 76.48 billion by 2031, growing at a CAGR of 7.97% over 2026-2031.
Growth is underpinned by hybrid work adoption, smart-city roll-outs, and steady advances in touch-sensing that make digital surfaces more responsive, brighter, and energy-efficient. Education, corporate collaboration, and public-facing self-service remain the largest revenue pools, yet healthcare way-finding and transport passenger-information systems are adding fresh demand streams. Consolidation among panel makers, especially in China, is shifting bargaining power along the supply chain and giving buyers access to larger, higher-resolution screens at lower unit cost. At the same time, energy-driven increases in glass pricing, plus fragile semiconductor supplies, are nudging total cost of ownership higher, steering some buyers toward vendors that bundle lifecycle services with hardware.
Key Report Takeaways
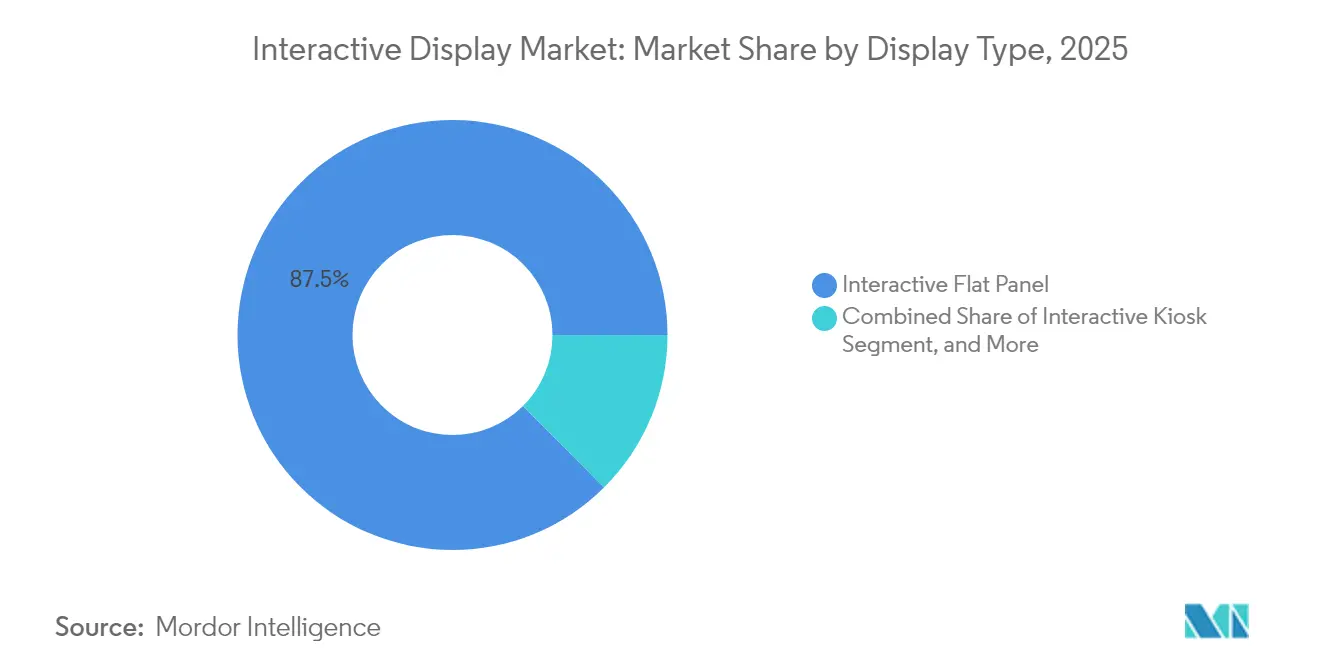
- By display type, interactive flat panels held 87.45% of interactive display market share in 2025, while interactive kiosks are projected to expand at an 8.28% CAGR through 2031.
- By technology, LCD led with 61.22% revenue share in 2025; direct-view LED is the fastest-growing at 9.34% CAGR through 2031.
- By touch-sensing method, infrared captured 45.35% share in 2025, whereas capacitive solutions are on track for a 9.12% CAGR to 2031.
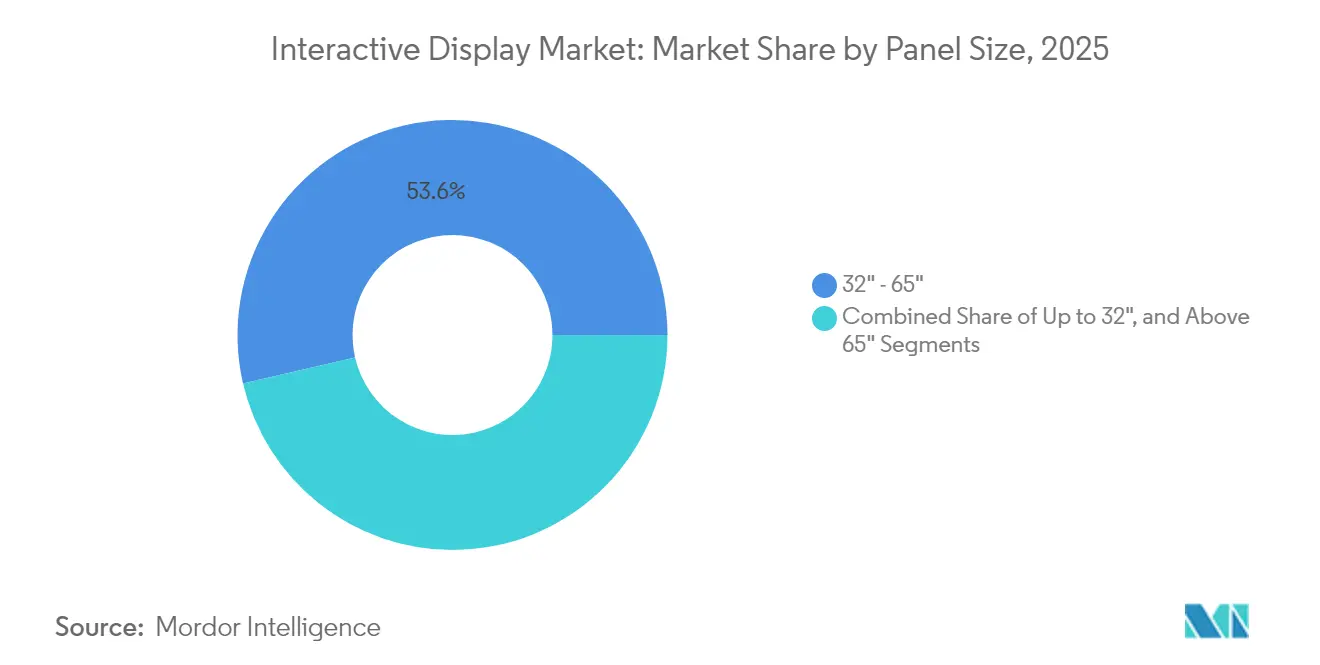
- By panel size, the 32"-65" class accounted for 53.62% of interactive display market size in 2025; screens above 65" show a 12.1% CAGR outlook.
- By panel orientation, landscape units dominated with 83.95% share in 2025; portrait screens deliver an 8.55% CAGR to 2031.
- By end-user vertical, education contributed 40.15% revenue in 2025, while retail & hospitality is projected to rise at a 9.03% CAGR to 2031.
- By geography, Asia-Pacific held 32.85% share in 2025, and the Middle East & Africa region is the fastest-expanding at 9.55% CAGR.
Note: Market size and forecast figures in this report are generated using Mordor Intelligence’s proprietary estimation framework, updated with the latest available data and insights as of 2026.
Global Interactive Display Market Trends and Insights
Drivers Impact Analysis*
| Driver | (~)% Impact on CAGR Forecast | Geographic Relevance | Impact Timeline |
|---|---|---|---|
| Growing adoption of interactive flat panels in hybrid classrooms | +1.8% | North America, spill-over to Europe | Medium term (2-4 years) |
| Retail demand for self-service interactive kiosks | +1.2% | Europe, expanding to APAC | Short term (≤ 2 years) |
| Corporate digital collaboration needs for interactive video walls | +1.5% | APAC core, adoption in North America | Medium term (2-4 years) |
| Government smart-city initiatives using outdoor interactive displays | +0.9% | Middle East, pilot programs in Africa | Long term (≥ 4 years) |
| Interactive passenger-information displays in South American transport hubs | +0.7% | South America, emerging markets | Medium term (2-4 years) |
| Interactive healthcare way-finding in Nordic facilities | +0.4% | Nordic region | Short term (≤ 2 years) |
| Source: Mordor Intelligence | |||
Growing Adoption of Interactive Flat Panels in Hybrid Classrooms Across North America
School districts that received federal technology grants are replacing whiteboards with touch-enabled panels to keep remote and in-class learners on the same page. Seamless switching between cloud learning platforms and classroom resources makes the panels the centerpiece of lesson delivery. SMART Technologies’ India expansion signals how producers now localize hardware and content for broader curricula, lowering procurement friction for budget-sensitive institutions. These education deployments lengthen replacement cycles and lock in software subscriptions-effects that lift lifetime revenue for vendors.
Retail Demand for Self-Service Interactive Kiosks Accelerating in Europe
Labor shortages and consumer preference for contact-free check-out are pushing European retailers to install kiosks that handle ordering, payments, survey capture, and loyalty enrollment around the clock. Kiosks’ multilingual menus widen customer reach without extra staffing. Hospitality operators use the same hardware for upselling room upgrades and local experiences, demonstrating the cross-sector usefulness of touch-based self-service.
Corporate Digital Collaboration Needs Driving Interactive Video Walls in Asia-Pacific Headquarters
Enterprises in financial services and manufacturing are retrofitting boardrooms with video walls that consolidate dashboards, CAD drawings, and live feeds on a single surface. LG’s corporate display line illustrates how annotation and multi-screen casting help dispersed teams shorten decision cycles.[1]Emily George, “The Rise of Gulf Smart Cities,” Wilson Center, wilsoncenter.org Source: LG Information Display, “Corporate,” lg-informationdisplay.com Large screens also future-proof meeting spaces for immersive telepresence when bandwidth improves, an important buying criterion for regional CIOs.
Government Smart-City Initiatives Boosting Outdoor Interactive Displays in the Middle East
Mega-projects such as Saudi Arabia’s Neom and the UAE’s Masdar City embed ruggedized interactive totems for way-finding, municipal services, and emergency alerts. High luminance and heat resistance keep content legible in desert sun, while IoT hooks feed real-time data to citizens. Vendor opportunities lie in localized content management and solar-powered designs that align with regional energy agendas.
Restraints Impact Analysis*
| Restraint | (~)% Impact on CAGR Forecast | Geographic Relevance | Impact Timeline |
|---|---|---|---|
| High total cost of ownership for large-format interactive walls | −1.3% | Emerging economies worldwide | Long term (≥ 4 years) |
| Supply-chain constraints in touch-controller semiconductors | −0.8% | Global, acute in Asia hubs | Short term (≤ 2 years) |
| Post-COVID hygiene concerns over public touchscreens | −0.6% | Caribbean and Africa | Medium term (2-4 years) |
| Integration complexity with legacy AV/IT in BFSI sector | −0.4% | Global financial centers | Medium term (2-4 years) |
| Source: Mordor Intelligence | |||
High Total Cost of Ownership for Large-Format Interactive Walls in Emerging Economies
Hardware expenses only account for half of a multi-panel wall over five years; installation, software, and service double the bill. May 2025 capacity cuts among panel makers show vendors protecting margins amid tariff uncertainty, limiting discount room for buyers. Currency swings also raise landed costs where budgets are pegged to local tenders, slowing adoption in schools and offices outside the OECD.
Supply-Chain Constraints of Semiconductor ICs Affecting Touch-Controller Availability
Specialized controller chips rely on a handful of foundries, making lead times volatile. Display-glass providers raised prices more than 10% in both 2023 and 2024 as energy costs surpassed half of production spend. Smaller brands without long-term allocations face spot-buy premiums that erode margins or push end-user prices higher, delaying roll-outs of interactive kiosks and flat panels.
*Our forecasts treat driver/restraint impacts as directional, not additive. The impact forecasts reflect baseline growth, mix effects, and variable interactions.
Segment Analysis
By Display Type: Interactive Flat Panels Dominate Market Share
Interactive flat panels generated 87.45% of revenue in 2025 and remain the default choice for classrooms, meeting rooms, and retail huddle zones thanks to wall-mount simplicity and familiar user interfaces. Vendors bundle whiteboard, video-conferencing, and device-casting apps to minimize training time, turning the hardware into a turnkey collaboration hub that justifies premium service contracts. As educators require seamless transitions between on-site and remote lessons, the panels’ role as backbone infrastructure strengthens budget priority.
Interactive kiosks constitute the speediest niche at an 8.28% CAGR, powered by hospitality self-check-in and quick-service restaurant ordering. Meanwhile, video walls address data-rich settings such as security command centers, and interactive tables gain a foothold in museums and design studios where multiple users work simultaneously on horizontal layouts. Mirrors and other emerging forms unlock virtual try-on and architectural signage, expanding where and how the interactive display market appears in physical spaces.


By Technology: LCD Leadership Faces LED Challenge
LCD accounted for 61.22% revenue in 2025, leveraging economies of scale and a well-established supplier ecosystem. Nevertheless, direct-view LED’s 9.34% CAGR reflects buyer appetite for bezel-free canvases, higher brightness, and lower operating cost. OLED stays a premium option where contrast and color fidelity trump price, notably in studio and luxury retail.
Projection and DLP still serve extra-large auditoria, yet lamp replacement and ambient-light sensitivity curb long-run competitiveness. Research into perovskite LEDs hints at thinner, cheaper, and integrated touch possibilities that could re-shape the interactive display market over the next decade.
By Touch-Sensing Technology: Infrared Dominance Challenged by Capacitive Growth
Infrared captured 45.35% interactive display market share in 2025 because it works with gloves, styluses, and even non-conductive objects, making it the go-to for public and industrial installs.
Capacitive solutions, mirroring smartphone user experience, post a 9.12% CAGR as buyers demand multi-touch gestures and slim bezels. Resistive technology maintains a foothold where budget and single-touch sufficiency align, while optical and acoustic methods serve rugged, outdoor, or specialty-input niches.
By Panel Size: Mid-Range Dominance with Large-Format Acceleration
Screens between 32" and 65" held 53.62% revenue in 2025 because they fit standard furniture and viewing distances. Corporate war-rooms and higher-ed lecture halls, however, want bigger canvases; panels over 65" will outpace others at 12.1% CAGR, assisted by falling LED tile prices and modular frames that allow door-sized shipment and on-site assembly.
Kiosks and point-of-sale terminals keep demand alive for sub-32" footprints suited to space-constrained counters.
By Panel Orientation: Landscape Preference with Portrait Growth
Landscape units satisfied 83.95% of installations in 2025, reflecting long-standing content design for widescreen ratio. Portrait displays, though, are growing 8.55% CAGR in digital signage, way-finding, and fashion retail, where vertical layouts mirror smartphone reading habits and maximize aisle space.
Flexible mounting kits and auto-rotation firmware now let property managers flip orientation without reinvesting, stimulating experimentation with how the interactive display market can present information.
By End-User Vertical: Education Leadership with Retail Acceleration
Education controlled 40.15% revenue in 2025, and government stimulus has locked interactive panels into standard classroom procurement lists worldwide. Retail & hospitality, rising at 9.03% CAGR, illustrates post-pandemic willingness to automate service touch-points and personalize upsell offers.
Corporate, healthcare, transportation, industrial, and public-sector scenarios round out the demand mosaic, each with bespoke content workflows that encourage software differentiation among suppliers
Geography Analysis
Asia-Pacific generated 32.85% of 2025 revenue, supported by integrated supply chains and aggressive capacity expansions such as BOE’s USD 9 billion Gen-8.6 AMOLED plant in Chengdu. Japan and South Korea add patented process know-how, while India’s incentives for local assembly are drawing global brands to in-country partnerships. Growing domestic consumption across classrooms and corporate campuses further anchors the interactive display market in the region.
North America stays influential on the back of hybrid-work software and cloud ecosystems that depend on touch-enabled surfaces for brainstorming and analytics. Federal and provincial grants keep schools refreshing AV gear, and U.S. enterprises remain early buyers of novel collaboration features. Supply-chain resilience is a priority, prompting some panel makers to diversify beyond Asia in line with reshoring policies.
Europe emphasizes self-service, green operations, and healthcare digitalization. Retailers deploy kiosks to cope with staffing shortages, while Nordic hospitals pioneer way-finding interfaces that cut check-in congestion. Strict energy codes also push buyers toward low-power LED models.
The Middle East and Africa lead growth at 9.55% CAGR to 2031, fueled by multibillion-dollar smart-city programs that embed interactive screens into transit shelters, cultural districts, and e-government counters. Harsh climate prompts high-brightness, sealed enclosures, creating premium margin potential for vendors with rugged options.
South America is on an infrastructure modernizing curve where airports and metros rely on passenger-information displays to streamline traffic and revenue. Urbanization and tourism lift municipal budgets for such upgrades, though currency volatility can delay orders.

Competitive Landscape
The market exhibits moderate concentration. Chinese producers scale capacity faster than peers, helped by state-backed financing and vertically integrated fabs. BOE’s Chengdu investment is the single largest in the city’s history, aiming at premium AMOLEDs, while TCL’s acquisition of LG’s Guangzhou LCD line boosts throughput and negotiating clout over component suppliers. Korean firms respond by pivoting to OLED and quantum-dot innovations; Samsung Display’s USD 1.8 billion Vietnam project spreads risk geographically.
Beyond the panel layer, brands differentiate with antimicrobial coatings and versatile operating systems. Transparent nanostructured copper films that kill 99.9% of microbes within two hours yet keep 70-80% transparency meet post-COVID hygiene demands. ViewSonic’s ecosystem approach-bundling lesson software, fleet management, and cloud storage-earned 20.1% share in the UK, proving that integration trumps hardware specs alone.[4]ViewSonic Corp., “ViewSonic Secures Leading Global Brand Position for Interactive Displays,” viewsonic.com
Supply-chain fragility remains a wild card. Rising glass and energy costs have forced double-digit price hikes for two consecutive years, squeezing margins downstream. Vendors that lock in long-term controller-chip allocations, or design around multi-source components, are best placed to meet delivery windows and maintain share as the interactive display market expands.
Interactive Display Industry Leaders
Samsung Electronics Co., Ltd.
LG Display Co., Ltd.
BOE Technology Group Co., Ltd.
Panasonic Corporation
Leyard Optoelectronic Co., Ltd.
- *Disclaimer: Major Players sorted in no particular order

Recent Industry Developments
- June 2025: Dixon Technologies sought Indian government approval for a joint venture with HKC to produce display modules for phones, notebooks, and TVs, targeting “lighthouse factory” status.
- May 2025: Coretronic posted monthly revenue of NTD 3.058 billion (USD 100 million), up 13% from April, citing quarter-end demand.
- April 2025: Cvent acquired Prismm to add 3-D event design and collaborative diagramming to its hospitality technology stack.
- January 2025: Mynd.ai’s Promethean brand launched ActivPanel 10 and ActivSuite, enabling Chrome, Windows, and Android flexibility for schools and offices.
- November 2024: ViewSonic achieved leading position in interactive displays with 20.1% share of the UK market after 130% growth.
- September 2024: Samsung Display committed USD 1.8 billion to an OLED plant in Vietnam aimed at laptop and tablet panels.


Global Interactive Display Market Report Scope
Interactive displays, are touch-sensitive screens that allow users to interact with digital content in real-time. It is a wall- mounted device that allows addicts to induce spectacular visual donations and manipulate on- screen data using digital touchscreen inputs.
The interactive display market is segmented by display type (interactive kiosk, interactive videowall, interactive whiteboard, interactive table, other display type), by technology (LCD, LED, OLED), by end-users (retail, transportation, education, BFSI, other end-users), by geography (North America, Europe, Asia-Pacific, Latin America, Middle East and Africa). The market sizes and forecasts are provided in terms of value (USD) for all the above segments.
| Interactive Kiosk |
| Interactive Video Wall |
| Interactive Whiteboard |
| Interactive Flat Panel |
| Interactive Table |
| Interactive Mirror |
| Other Display Types |
| LCD |
| LED (Direct-View) |
| OLED |
| Projection and DLP |
| ePaper and Other Emerging |
| Infrared |
| capacitive |
| Resistive |
| Optical Imaging |
| Acoustic Wave and Others |
| Up to 32" |
| 32" - 65" |
| Above 65" |
| Landscape |
| Portrait |
| Education |
| Corporate and Enterprise |
| Retail and Hospitality |
| Transportation and Logistics |
| Healthcare |
| Banking, Financial Services and Insurance (BFSI) |
| Industrial and Manufacturing |
| Sports and Entertainment Venues |
| Government and Defense |
| Other Verticals |
| North America | United States | |
| Canada | ||
| Mexico | ||
| Europe | Germany | |
| United Kingdom | ||
| France | ||
| Nordics | ||
| Rest of Europe | ||
| South America | Brazil | |
| Rest of South America | ||
| Asia Pacific | China | |
| Japan | ||
| India | ||
| South East Asia | ||
| Rest of Asia Pacific | ||
| Middle East and Africa | Middle East | Gulf Cooperation Council Countries |
| Turkey | ||
| Rest of Middle East | ||
| Africa | South Africa | |
| Rest of Africa | ||
| By Display Type | Interactive Kiosk | ||
| Interactive Video Wall | |||
| Interactive Whiteboard | |||
| Interactive Flat Panel | |||
| Interactive Table | |||
| Interactive Mirror | |||
| Other Display Types | |||
| By Technology | LCD | ||
| LED (Direct-View) | |||
| OLED | |||
| Projection and DLP | |||
| ePaper and Other Emerging | |||
| By Touch-Sensing Technology | Infrared | ||
| capacitive | |||
| Resistive | |||
| Optical Imaging | |||
| Acoustic Wave and Others | |||
| By Panel Size | Up to 32" | ||
| 32" - 65" | |||
| Above 65" | |||
| By Panel Orientation | Landscape | ||
| Portrait | |||
| By End-user Vertical | Education | ||
| Corporate and Enterprise | |||
| Retail and Hospitality | |||
| Transportation and Logistics | |||
| Healthcare | |||
| Banking, Financial Services and Insurance (BFSI) | |||
| Industrial and Manufacturing | |||
| Sports and Entertainment Venues | |||
| Government and Defense | |||
| Other Verticals | |||
| By Geography | North America | United States | |
| Canada | |||
| Mexico | |||
| Europe | Germany | ||
| United Kingdom | |||
| France | |||
| Nordics | |||
| Rest of Europe | |||
| South America | Brazil | ||
| Rest of South America | |||
| Asia Pacific | China | ||
| Japan | |||
| India | |||
| South East Asia | |||
| Rest of Asia Pacific | |||
| Middle East and Africa | Middle East | Gulf Cooperation Council Countries | |
| Turkey | |||
| Rest of Middle East | |||
| Africa | South Africa | ||
| Rest of Africa | |||


Key Questions Answered in the Report
What is the current value of the interactive display market?
The interactive display market is valued at USD 52.14 billion in 2026 and is forecast to climb to USD 76.48 billion by 2031.
Which display type leads global revenue?
Interactive flat panels command 87.45% market share in 2025 and remain the dominant display type for education and corporate use.
Which region is expanding fastest?
The Middle East & Africa region shows the quickest pace, with a 9.55% CAGR expected between 2026 and 2031, propelled by smart-city investments.
What technology is gaining ground on LCD?
Direct-view LED screens are the fastest-growing technology, advancing at a 9.34% CAGR due to superior brightness and declining cost.
How are supply-chain issues affecting the market?
Price hikes in glass substrates and shortages of touch-controller semiconductors are lengthening lead times and lifting total cost of ownership, particularly for large-format displays.
Which vertical will grow quickest through 2031?
Retail and hospitality projects the highest vertical CAGR at 9.03%, reflecting the move toward self-service kiosks and contactless guest interactions.
Page last updated on:


