Industrial Wastewater Treatment Equipment Market Size and Share
Market Overview
| Study Period | 2020 - 2031 |
|---|---|
| Market Size (2026) | USD 17.04 Billion |
| Market Size (2031) | USD 24.76 Billion |
| Growth Rate (2026 - 2031) | 7.76% CAGR |
| Fastest Growing Market | Middle East and Africa |
| Largest Market | Asia Pacific |
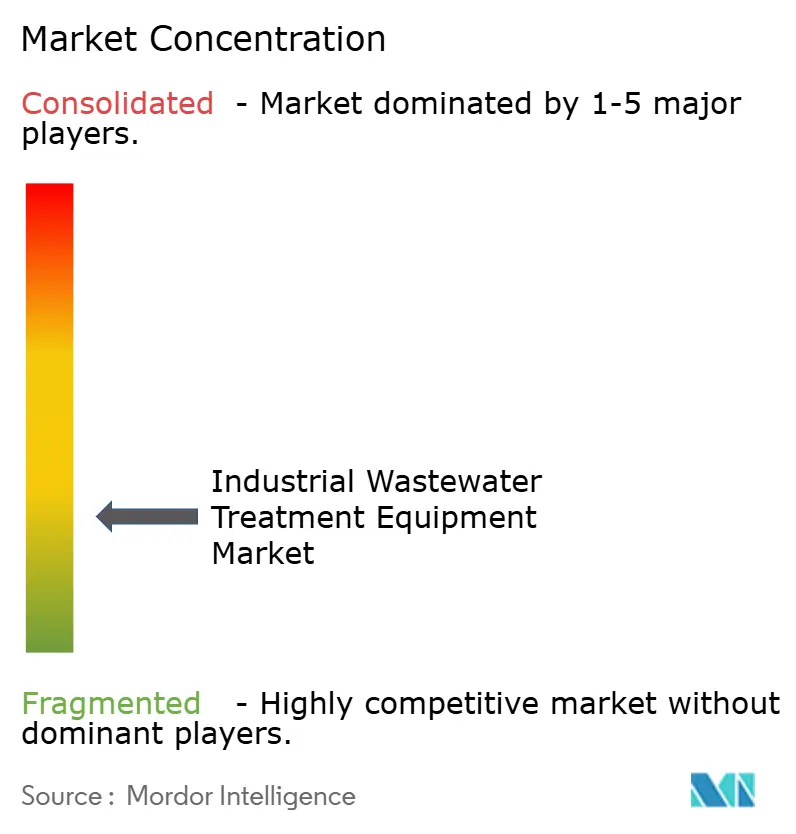
| Market Concentration | Low |
Major Players *Disclaimer: Major Players sorted in no particular order Image © Mordor Intelligence. Reuse requires attribution under CC BY 4.0. | |
Industrial Wastewater Treatment Equipment Market Analysis by Mordor Intelligence
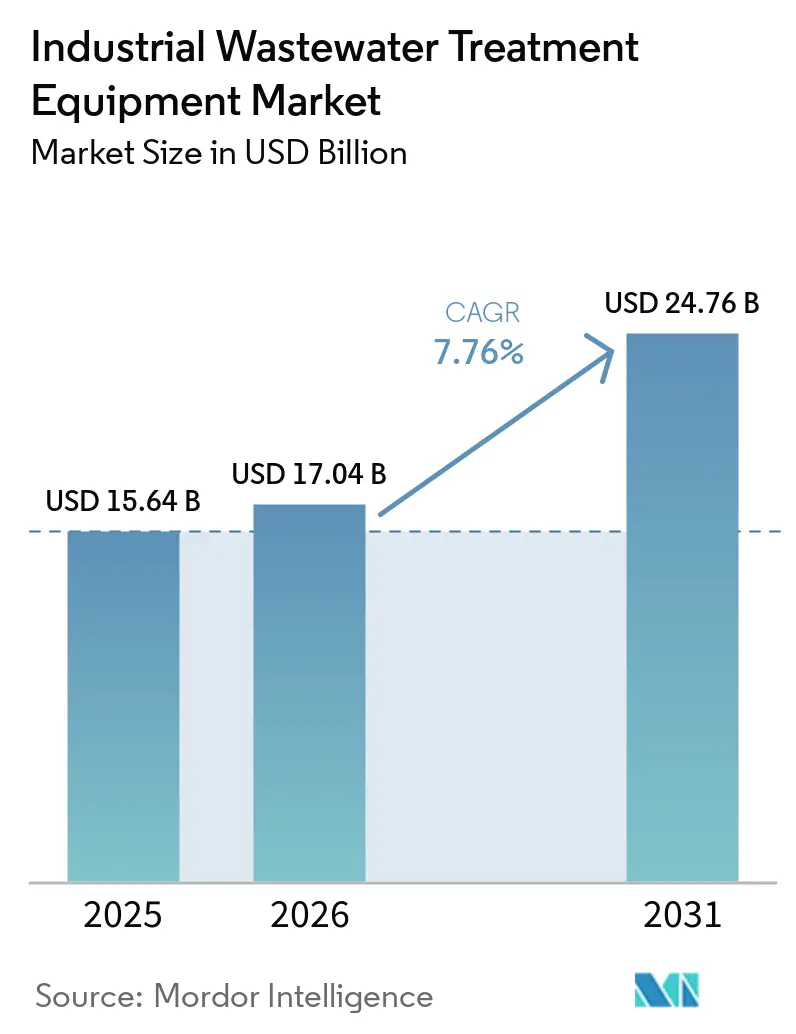
The industrial wastewater treatment equipment market size is expected to grow from USD 15.64 billion in 2025 to USD 17.04 billion in 2026 and is forecast to reach USD 24.76 billion by 2031 at 7.76% CAGR over 2026-2031. Growth is being supported by tighter industrial discharge rules, especially around PFAS, which are pushing facilities to upgrade treatment trains earlier than planned. A second layer of demand is coming from new industrial capacity in sectors such as semiconductors, pharmaceuticals, food processing, and chemicals, where wastewater handling is built into project design from the start. Reclaimed water reuse is also changing the spending case because rising freshwater costs are making on-site recovery more attractive in several industrial belts. This has shifted a larger share of equipment spending toward continuous compliance and lifecycle optimization rather than one-time plant build-outs. Competitive conditions remain moderate to high in the overall industrial wastewater treatment equipment market, with much sharper rivalry in membrane, PFAS-focused, and zero-liquid-discharge systems, where technical performance can still support premium pricing.
Key Report Takeaways
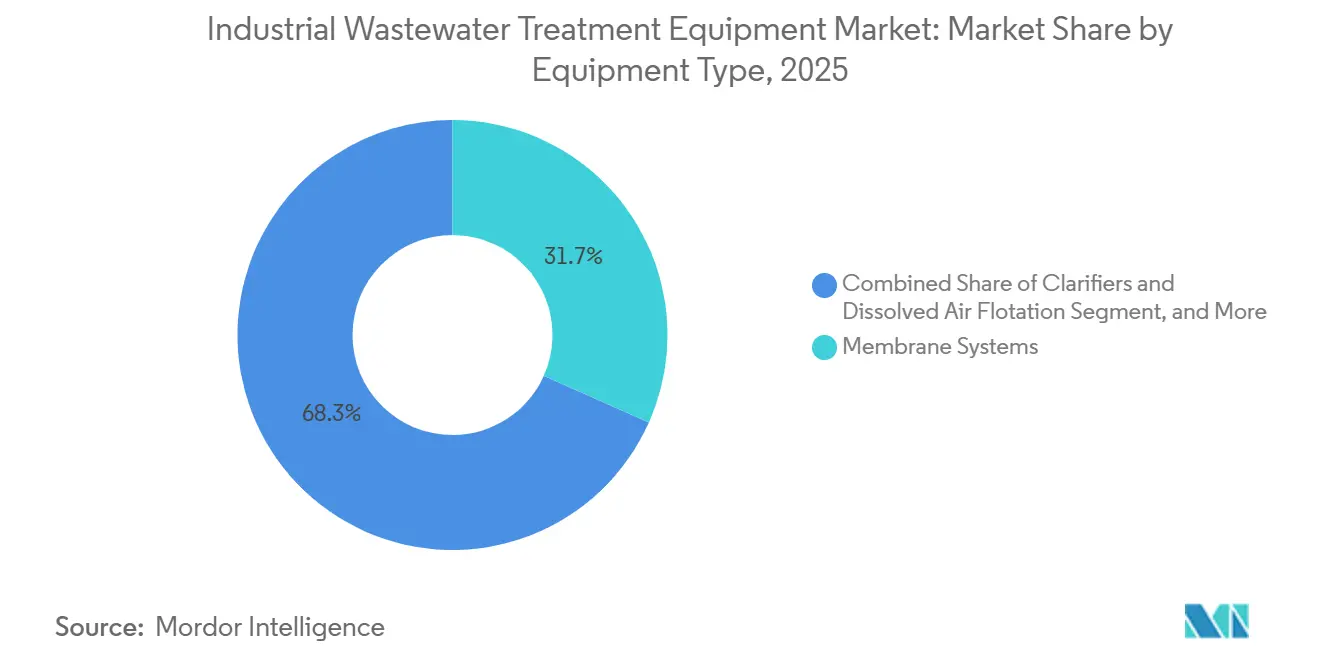
- By equipment type, membrane systems accounted for 31.67% of the industrial wastewater treatment equipment market in 2025, while evaporation and crystallization systems are projected to grow the fastest at an 8.34% CAGR through 2031.
- By process stage, secondary treatment captured 42.53% of the market in 2025, while resource recovery and water reuse are expected to record the fastest CAGR of 8.45% through 2031.
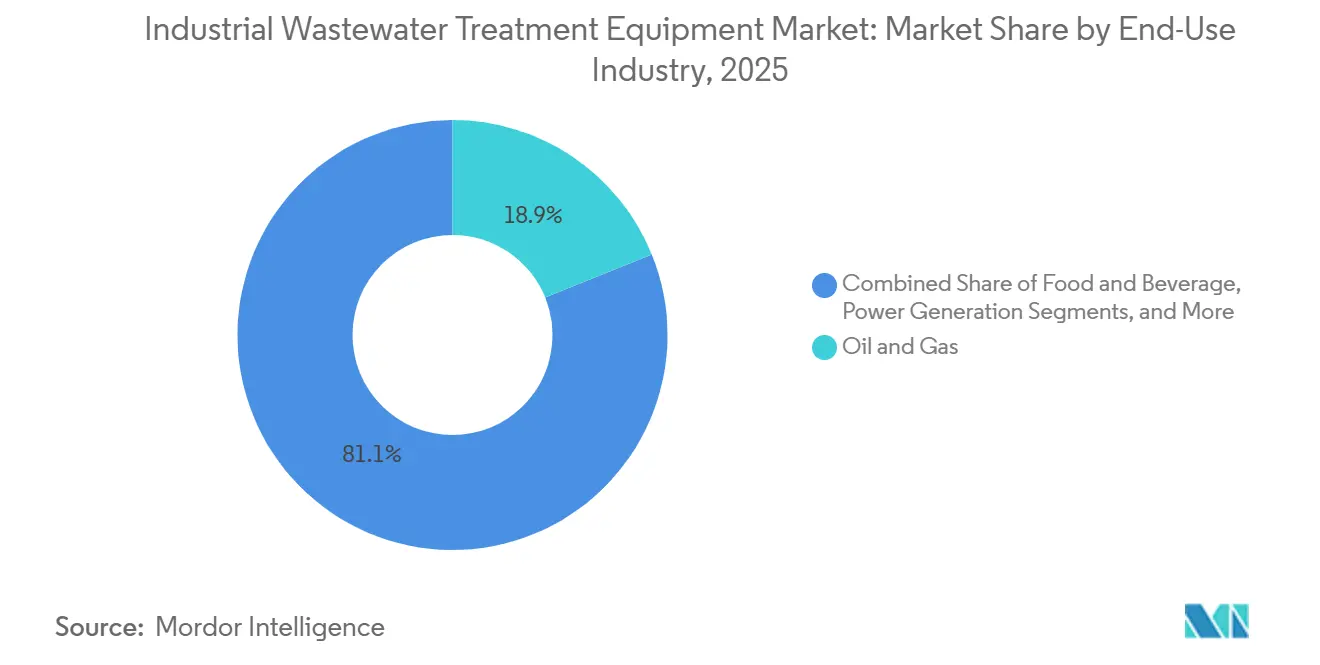
- By end-use industry, oil and gas held 18.89% of the industrial wastewater treatment equipment market in 2025, while semiconductors and electronics are projected to grow the fastest at an 8.83% CAGR through 2031.
- By capacity, above 10,000 m³/day systems represented 45.31% of the market in 2025, while the less than 1,000 m³/day segment is expected to advance at the fastest CAGR of 8.71% through 2031.
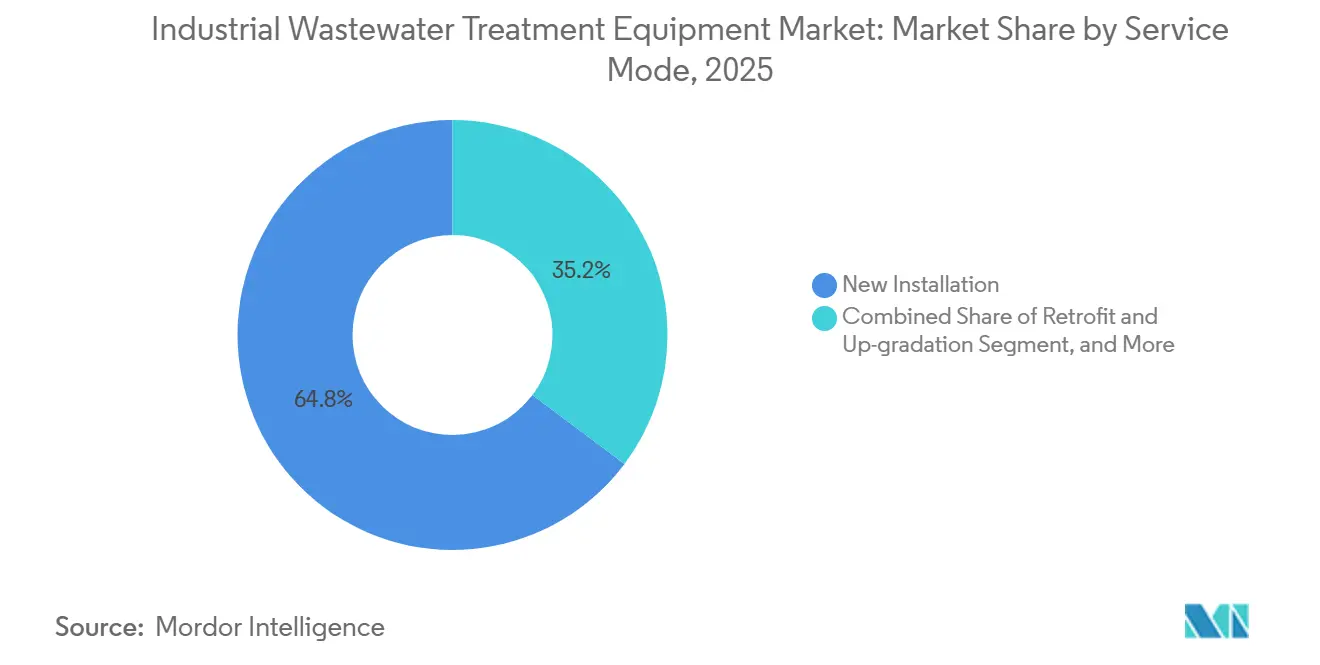
- By service mode, new installation held 64.76% of the industrial wastewater treatment equipment market in 2025, while mobile/rental units are projected to grow the fastest at an 8.76% CAGR through 2031.
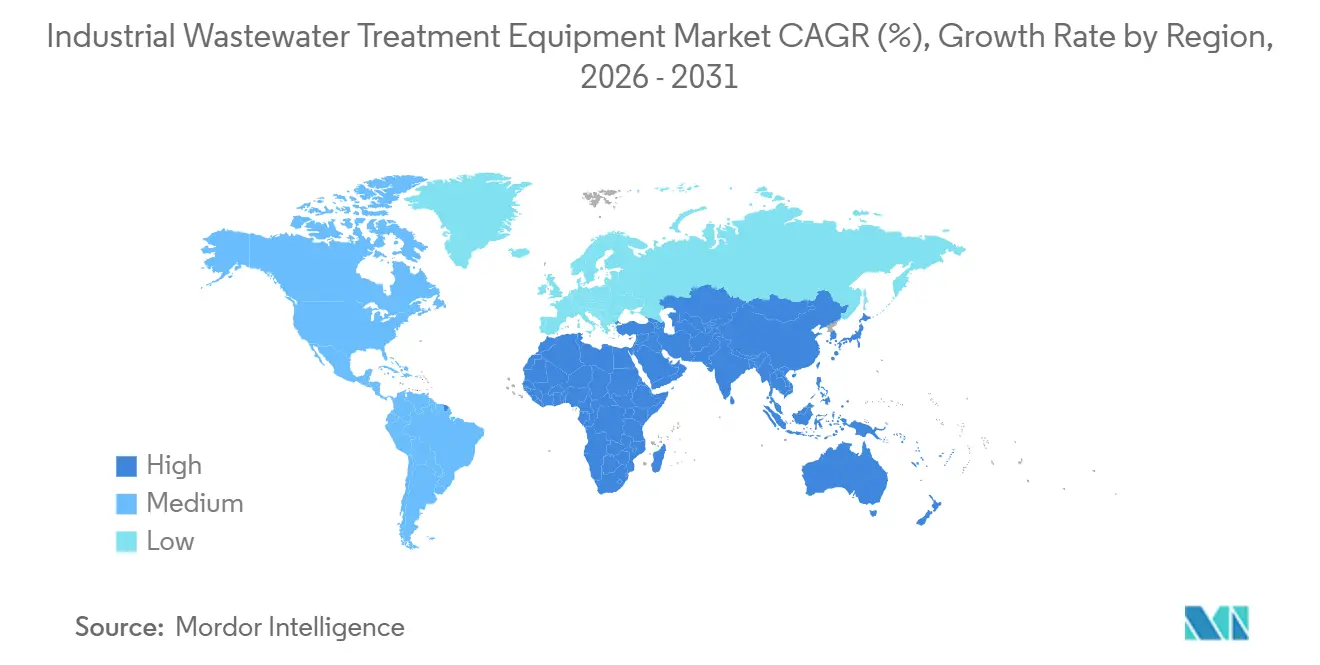
- By geography, Asia-Pacific held 38.96% of the industrial wastewater treatment equipment market in 2025, while the Middle East and Africa are projected to expand at the fastest CAGR of 8.51% through 2031.
Note: Market size and forecast figures in this report are generated using Mordor Intelligence’s proprietary estimation framework, updated with the latest available data and insights as of January 2026.
Global Industrial Wastewater Treatment Equipment Market Trends and Insights
Drivers Impact Analysis*
| Driver | (~) % Impact on CAGR Forecast | Geographic Relevance | Impact Timeline |
|---|---|---|---|
| Stringent Industrial Effluent Rules and PFAS Standards | +2.1% | Global, most concentrated in North America and EU | Short term (≤ 2 years) |
| Water Reuse and Zero-Liquid-Discharge Adoption | +1.8% | APAC core (India, China), spill-over to MEA and North America | Medium term (2-4 years) |
| Capacity Expansion in Water-Intensive Industries | +1.5% | Global, priority concentration in APAC and North America | Medium term (2-4 years) |
| AI-Led Automation and Lifecycle Cost Optimization | +1.2% | Global, with early gains in North America, EU, and East Asia | Medium term (2-4 years) |
| Semiconductor Fab Build-Out and PFAS Abatement Needs | +0.9% | North America, Japan, India, South Korea | Long term (≥ 4 years) |
| Reclaimed-Water Cooling Demand From AI Data Centers | +0.7% | North America, EU, APAC | Long term (≥ 4 years) |
| Source: Mordor Intelligence | |||
Stringent Industrial Effluent Rules and PFAS Standards Drive Unplanned Capex
PFAS regulation has become the clearest source of unplanned capital spending in the industrial wastewater treatment equipment market. The U.S. EPA’s January 2025 case-by-case TBEL factsheet requires permit writers to evaluate best available technology economically achievable for PFAS-discharging facilities across multiple industrial categories, including organic chemicals, plastics and synthetic fibers, metal finishing, electroplating, electric and electronic components, pulp and paper, and textile mills.[1]U.S. Environmental Protection Agency, “Case-by-Case Technology-Based Effluent Limits (TBELs) for PFAS,” U.S. Environmental Protection Agency, epa.gov That shift matters because many sites that previously relied on secondary treatment are now being pushed toward advanced systems such as granular activated carbon, ion exchange, and other PFAS-focused polishing steps. The EPA also proposed Methods 1633A and 1621 under the Clean Water Act, which expands the measurement base from targeted compounds to far broader PFAS screening and sets up a larger volume of effluent characterization work in 2026 and 2027. Preliminary Plan 16, issued in December 2024, extends categorical effluent guideline work into additional industrial sectors and keeps the compliance pipeline active beyond current budget cycles. The result is that even operators with limited direct PFAS generation can be drawn into upgrade spending when they sit inside shared industrial parks or receive mixed waste streams, which broadens the addressable base for the industrial wastewater treatment equipment market.
Water Reuse and Zero-Liquid-Discharge Adoption Redefine Treatment Economics
Water reuse and zero-liquid-discharge adoption are changing the economic center of the industrial wastewater treatment equipment market from disposal toward recovery. A 2025 review in Nature Reviews Clean Technology found that hybrid ZLD systems that combine high-recovery reverse osmosis, electrodialysis, and mechanical vapor recompression can reduce energy use by 30-50% compared with first-generation thermal ZLD systems, which materially improves project payback.[2]Nature Reviews Clean Technology, “Zero Liquid Discharge: Advances and Challenges in Industrial Wastewater Treatment,” Nature Reviews Clean Technology, nature.com A November 2025 study from Harvey Mudd College showed that ZLD combined with biological pretreatment and high-recovery reverse osmosis could reduce freshwater withdrawal by as much as 95% in recirculating cooling tower applications.[3]Harvey Mudd College Undergraduate Research Office, “Zero Liquid Discharge and Water Reuse in Recirculating Cooling Towers at Power Facilities: Review and Case Study Analysis,” Harvey Mudd College, uro.hmc.edu Those improvements matter most in water-stressed production zones because they bring reuse economics into capital planning rather than sustainability reporting alone. The demand effect is no longer limited to final-stage treatment because higher recovery rates also create follow-on demand for brine concentration, evaporation, and salt crystallization equipment that suppliers increasingly need to position as part of an integrated offer. This is why the industrial wastewater treatment equipment market is moving toward larger bundled solution packages instead of isolated treatment skids.
Capacity Expansion in Water-Intensive Industries Creates Structural Equipment Demand
Greenfield expansion in water-intensive sectors is creating a durable order flow for the industrial wastewater treatment equipment market that is less cyclical than rule-driven retrofit activity. Semiconductor fabrication remains one of the clearest examples because fabs require large volumes of ultrapure water and generate wastewater streams that need layered treatment and recovery systems over a long operating life. The Semiconductor Industry Association reported in 2025 that PFAS discharge levels measured across 26 fabs operated by 7 member companies ranged from 0.002 g/day to 13 g/day per facility, with an average near 4 g/day, which is already encouraging treatment upgrades before broader categorical standards arrive. The same structural pull is visible in pharmaceuticals, food processing, and chemicals, where each new production asset comes with embedded wastewater infrastructure needs from day 1. These projects support demand not only for primary and secondary systems but also for membrane polishing, reuse loops, sludge handling, and monitoring layers that extend spending beyond the first equipment purchase. As a result, vendors with strong references in semiconductors, pharmaceuticals, and complex process manufacturing are building a compounding advantage inside the industrial wastewater treatment equipment market.
AI-Led Automation and Lifecycle Cost Optimization Lower the Payback Barrier
AI-led optimization is improving the commercial case for higher-end systems across the industrial wastewater treatment equipment market. A 2026 analysis published in Discover Sustainability reviewed more than a decade of AI use in wastewater treatment and reported R² values commonly between 0.90 and 0.999, energy savings of up to 20%, and membrane separation efficiencies approaching 99% in AI-optimized settings. Those gains matter because the hardest part of selling advanced treatment often sits in the operating cost case rather than the treatment outcome itself. Better control over dosing, aeration, pressure, and maintenance timing can narrow the gap between basic compliance systems and premium treatment trains such as membrane bioreactors, advanced oxidation, and ZLD packages. Predictive maintenance also reduces the frequency of abrupt membrane fouling, pump degradation, and process instability, which makes vendor performance guarantees more credible during procurement discussions. That is gradually moving the industrial wastewater treatment equipment market toward contracts that are priced on delivered outcomes over time rather than equipment supply alone.
Restraints Impact Analysis*
| Restraint | (~) % Impact on CAGR Forecast | Geographic Relevance | Impact Timeline |
|---|---|---|---|
| High Capital and Energy Intensity of Advanced Systems | -1.5% | Global, most pronounced in emerging markets | Short term (≤ 2 years) |
| Fouling, Sludge Handling, and Skilled-Operator Shortages | -1.0% | Global, especially APAC, MEA, and South America | Medium term (2-4 years) |
| PFAS Concentrate and Brine Destruction Bottlenecks | -0.6% | North America and EU | Medium term (2-4 years) |
| Brownfield Retrofit Constraints and POTW Capacity Limits | -0.5% | North America and EU | Long term (≥ 4 years) |
| Source: Mordor Intelligence | |||
High Capital and Energy Intensity of Advanced Systems Constrain Emerging-Market Adoption
Capital cost and power demand remain the most immediate brake on the industrial wastewater treatment equipment market in cost-sensitive regions. The source draft noted that thermal ZLD systems consume 20-30 kWh per cubic meter of water treated, while optimized hybrid HRRO-MVR configurations still require 8-12 kWh/m³, which leaves project viability highly exposed to industrial electricity tariffs. The 2025 Nature Reviews Clean Technology assessment supports the view that newer hybrid systems are materially better than legacy thermal ZLD, but it also makes clear that energy intensity remains a central design and economics issue rather than a solved problem. This is especially relevant in emerging markets where power reliability is uneven and where financing costs can quickly overpower the value of avoided discharge or freshwater savings. The commercial response has been more modular and containerized equipment that lowers the minimum entry ticket for industrial users, yet that approach addresses only part of the problem because electricity availability still shapes real operating feasibility. Until energy intensity falls further, the industrial wastewater treatment equipment market will continue to see adoption gaps between large, well-capitalized operators and mid-sized facilities.
Fouling, Sludge Handling, and Skilled-Operator Shortages Create Operational Drag
Operational complexity is another meaningful restraint on the industrial wastewater treatment equipment market, especially when treatment trains involve membranes, advanced oxidation, or high-sludge loads. The source draft highlighted that reverse osmosis and ultrafiltration systems in high-organic-load applications can suffer 30-60% flux reductions within months if cleaning protocols and monitoring are weak, which raises replacement costs and erodes the life-cycle case for advanced filtration. Sludge handling adds a second burden because stricter disposal conditions and higher transport costs can turn what used to be a manageable operating line item into a separate capital decision around dewatering, drying, and valorization assets. The Water Research Foundation documented certified operator shortages in the United States in 2025, with particular strain in rural and peri-industrial areas, and that matters because complex systems cannot deliver stable performance without skilled staffing. In practice, this holds back uptake of the most technically demanding equipment even in regions where regulatory pressure is strong. It also means the industrial wastewater treatment equipment market is not constrained only by technology cost, but by the human capacity needed to keep advanced systems operating reliably.
*Our forecasts treat driver/restraint impacts as directional, not additive. The impact forecasts reflect baseline growth, mix effects, and variable interactions.
Segment Analysis
By Equipment Type: Membrane Systems Lead, Evaporation Accelerates
Membrane systems held 31.67% of the equipment type segment in 2025, which made them the largest product category in the industrial wastewater treatment equipment market. Their lead reflects the wide use of reverse osmosis and ultrafiltration in plants that need either high-purity discharge quality or industrial-grade reclaimed water. The category also benefits from a long record of improvement in spiral-wound and hollow-fiber membrane formats, which have helped move membranes from niche polishing duty into core industrial treatment trains. Scientific literature in 2025 continued to show that membrane-based approaches are central to high-recovery and ZLD system architecture, especially where water reuse becomes part of project economics rather than a secondary benefit. That installed-base depth gives membrane suppliers a strong position in replacements, consumables, and performance upgrades across the industrial wastewater treatment equipment market.
The fastest growth within this segmentation sits in evaporation and crystallization systems, which are projected to expand at an 8.34% CAGR through 2031. This part of the industrial wastewater treatment equipment market is being pulled forward by ZLD mandates and by the larger volume of concentrate streams that follow from high-recovery membrane reuse systems. The 2025 Nature Reviews Clean Technology review described how hybrid reuse architectures are now pushing more sites toward the final concentrate management stage, which directly strengthens demand for brine concentration and crystallization units. Clarifiers and dissolved air flotation, biological treatment equipment, chemical treatment units, and filtration and separation systems remain essential foundation layers and continue to benefit from replacement demand tied to aging installed assets. Sludge handling and dewatering equipment is also drawing renewed capital attention because disposal conditions are becoming tighter, which gives this category a more strategic role than it held in earlier compliance cycles.


By Process Stage: Secondary Treatment Anchors Volume, Resource Recovery Expands Value
Secondary treatment commanded 42.53% of the global industrial wastewater treatment equipment market in 2025, which made it the largest process stage in the industrial wastewater treatment equipment market size by installed value. That position reflects its mandatory role across most industrial discharge frameworks, where biological treatment still forms the core of routine compliance. Moving bed biofilm reactors and membrane bioreactors are steadily gaining ground over conventional activated sludge in new projects where footprint and effluent quality standards are tighter. This shift matters because it increases the equipment content per project and lifts the value of controls, monitoring, aeration, and membrane-integrated designs in the industrial wastewater treatment equipment industry. It also supports stable base demand because even facilities that do not adopt reuse must still maintain reliable secondary treatment performance.
Resource recovery and water reuse are the fastest-growing process stages at an 8.45% CAGR through 2031, which points to a wider change in how the industrial wastewater treatment equipment market is being framed by end users. Wastewater is increasingly being handled as a recoverable stream that can yield reclaimed water, biogas, salts, nutrients, or metals instead of being treated only as a disposal burden. Veolia’s April 2026 reclaimed-water cooling partnership with Amazon in Mississippi shows how reuse is now being contracted at an industrial scale, with the first facility expected to reuse more than 83 million gallons of potable water annually once operational in 2027. The 2025 and 2025 academic reviews from Nature Reviews Clean Technology and Harvey Mudd College also show why reuse is gaining commercial traction, since higher-recovery systems improve water savings enough to change capital planning. As this process stage expands, suppliers that can combine tertiary polishing, concentrate handling, and recovery economics within one design are likely to gain a stronger position in the industrial wastewater treatment equipment market.
By End-Use Industry: Oil and Gas Leads, Semiconductors and Electronics Gain Speed
Oil and gas remained the largest end-use vertical with 18.89% of the 2025 market, which kept it at the front of the industrial wastewater treatment equipment market by sector demand. That position rests on the persistent need to manage produced water, refinery effluent, and streams with high total dissolved solids. Large sites in this vertical also tend to favor centralized treatment systems, which raises average equipment value and supports long project scopes. The segment is still important because it provides stable demand for physical separation, chemical treatment, biological polishing, and sludge handling equipment across upstream and downstream settings. Its growth is measured rather than explosive, but its installed-base replacement cycle remains a meaningful revenue layer for the industrial wastewater treatment equipment market.
Semiconductors and electronics are the fastest-growing end-use vertical at an 8.83% CAGR through 2031 and represent one of the clearest premium-growth pockets in the industrial wastewater treatment equipment market. The Semiconductor Industry Association reported in 2025 that PFAS discharge measurements across 26 fabs ranged from 0.002 g/day to 13 g/day per facility, which is pushing chipmakers toward pre-emptive treatment upgrades ahead of broader regulatory tightening. This vertical is attractive because wastewater quality, water reuse, and process continuity carry unusually high production value, so buyers are more willing to pay for high-performance systems and strong lifecycle support. Food and beverage, chemicals and petrochemicals, pharmaceuticals, mining and metals, textiles, and power generation also sustain broad demand, but each sector follows a different treatment logic based on effluent chemistry, water reuse goals, and local enforcement conditions. Power generation is becoming more relevant where recirculating cooling systems and ZLD objectives are tightening, while pharmaceutical facilities continue to require treatment systems that can handle complex organic loads and trace compounds.
By Capacity (M³/Day): Large Systems Dominate, Modular Installations Gain Pace
Above 10,000 m³/day systems captured 45.31% of the market in 2025, which gave this band the largest position in the industrial wastewater treatment equipment market share by capacity segment. That outcome matches the continued preference for centralized treatment in refining, mining, and large power applications, where scale supports custom engineering and long delivery schedules. These projects often favor suppliers with a track record in engineering, procurement, and commissioning because the commercial and operational risk of failure is high. Large systems also pull through a wider package of auxiliary equipment, controls, sludge management, and post-treatment layers, which keeps their value contribution high inside the industrial wastewater treatment equipment market. Their dominance is therefore not only a function of flow volume, but also of project complexity and specification depth.
The less-than-1,000 m³/day segment is the fastest growing at an 8.71% CAGR through 2031, reflecting a clear shift toward modular and distributed treatment in the industrial wastewater treatment equipment market size for new installations. Smaller systems are gaining acceptance in pharmaceuticals, specialty chemicals, and food processing, where sites need faster deployment, tighter footprints, or more flexible flow handling. Vanootech’s February 2026 launch of modular MVR evaporation systems for ZLD applications reflects this direction, with containerized units designed to scale incrementally as plant output rises. The mid-range 1,000-10,000 m³/day category remains intensely contested because it sits in the overlap zone between global original equipment manufacturers and regional specialists. As permitting and certification timelines tighten in more complex regulatory environments, vendors that can offer pre-engineered, pre-qualified configurations are likely to win share faster than those that rely only on highly customized large-project models.
By Service Mode: New Installation Dominates, Mobile and Rental Units Expand
New installation accounted for 64.76% of the market in 2025, which made it the largest service mode in the industrial wastewater treatment equipment market. This reflects the still-active greenfield investment cycle across semiconductors, pharmaceuticals, batteries, and other process industries that need wastewater infrastructure before production ramps. New-build projects usually carry the broadest equipment scope, since they include core treatment, controls, sludge systems, and reuse planning in one package. That supports larger average contract values and gives technology vendors more influence over system architecture from the beginning. It also explains why the industrial wastewater treatment equipment market continues to benefit from industrial capex plans even when retrofit budgets remain selective.
Mobile and rental units are projected to grow at the fastest pace, at an 8.76% CAGR through 2031, which signals a gradual move toward more flexible procurement in the industrial wastewater treatment equipment market. This service mode appeals to operators who need temporary treatment during plant construction, commissioning, maintenance shutdowns, or emergency response periods. It also fits buyers who prefer operating expenditure over large upfront capital commitments, especially when treatment demand is uncertain or short-lived. The broader rise of modular systems, including containerized evaporation units and packaged reuse skids, supports this shift because it shortens installation time and reduces site disruption. Over time, stronger adoption of mobile and rental models may redistribute commercial risk toward vendors, which favors suppliers that can finance fleets, provide fast field support, and stand behind performance across multiple sites.
Geography Analysis
Asia-Pacific held 38.96% of the global industrial wastewater treatment equipment market in 2025, which kept it as the largest regional contributor by a wide margin. China remains the anchor because of its dense industrial base across petrochemicals, metals, textiles, and electronics, and because a large installed base is now moving from initial compliance into upgrade and optimization cycles. India is also expanding its role as manufacturing capacity rises across pharmaceuticals, electronics, food processing, and specialty chemicals, with wastewater treatment built into new facility planning from the outset. The industrial wastewater treatment equipment market in Asia-Pacific is also being strengthened by wider adoption of water reuse and ZLD in water-stressed industrial clusters, where recovery economics are improving as treatment technology advances. South Korea and Japan add another layer of demand because semiconductor and display expansion requires tighter process water and wastewater control, while PFAS monitoring is receiving more attention across advanced manufacturing chains.
The Middle East and Africa are the fastest-growing regions, with an 8.51% CAGR through 2031, and this makes it the strongest growth frontier in the industrial wastewater treatment equipment market size by region. Saudi Arabia and the United Arab Emirates are driving most of that momentum as industrial diversification creates wastewater treatment demand across petrochemicals, metals, pharmaceuticals, and newer manufacturing lines. In this region, the business case for high-recovery treatment often stands on avoided freshwater cost as much as on regulation, which makes reuse and ZLD systems more financially attractive than in less water-stressed geographies. Academic work on higher-recovery reuse systems supports this direction because strong reductions in freshwater withdrawal improve the value case for advanced treatment in industrial cooling and process applications. Africa remains smaller in absolute terms, but mining in South Africa and refinery-linked treatment needs in Nigeria point to longer-term project opportunities.
Europe held a meaningful share in 2025 and continued to be driven by Germany, the United Kingdom, and France, where chemical, pharmaceutical, and automotive facilities sustain high effluent treatment standards. The region is less dependent on greenfield growth than the Asia-Pacific, but replacement and upgrade cycles remain active as discharge expectations tighten and sludge handling costs rise. North America has a distinct compliance-led profile in the industrial wastewater treatment equipment market because PFAS rules are pushing industrial dischargers toward more advanced treatment than conventional secondary systems can provide. South America, led by Brazil and Argentina, continues to present demand from pulp and paper, mining, and food processing, although financing conditions and currency volatility still moderate project timing relative to the region’s underlying industrial need.

Competitive Landscape
The industrial wastewater treatment equipment market includes large integrated water companies, diversified process equipment suppliers, and focused specialists, which creates a competitive structure that is broad at the top level but tighter in certain high-performance niches. Competition is most intense in PFAS treatment, membranes, and ZLD-related systems because buyers in those categories tend to evaluate suppliers on treatment efficacy, operating cost, and technical proof rather than price alone. Large companies retain an advantage in major EPC contracts because they can absorb project risk, finance complex delivery, and support long commissioning periods across multiple geographies. Smaller specialists, however, often compete effectively where a tender is heavily specification-driven and where a narrow technology edge can outweigh balance-sheet scale. This keeps the industrial wastewater treatment equipment market open to both scale players and innovation-led challengers.
Veolia and SUEZ remain among the most credible names for large industrial mandates. Veolia’s April 2026 reclaimed-water cooling partnership with Amazon in Mississippi also shows how leading firms are linking industrial water reuse with long-term service models and digital optimization. In April 2026, Veolia also completed the acquisition of Enviropacific in Australia, which strengthened its PFAS remediation and industrial services capability in the Asia-Pacific. These moves show that leading firms are not only defending installed bases, but are also buying or building capability in faster-growing treatment niches.
The next tier includes companies such as Kurita Water Industries, Toray Industries, Alfa Laval, Koch Separation Solutions, and IDE Technologies, all of which compete aggressively where performance matters more than commodity pricing. Kurita’s April 2026 investment in Cyclopure and its exclusive U.S. sales rights for DEXSORB is a clear example of how suppliers are trying to secure differentiated PFAS treatment capability rather than relying on generic filtration offerings. De Nora’s May 2026 agreement to acquire BW Water, at an enterprise value of USD 61.5-66.5 million with BW Water having recorded USD 91.5 million in 2025 revenue and a backlog of nearly USD 190 million, shows how mid-tier expansion is increasingly being driven by acquisitions rather than slower organic build-out. The industrial wastewater treatment equipment market still has open space for vendors that can combine concentration, destruction, and final disposal solutions for PFAS-laden streams, because concentrate management remains a practical bottleneck as reuse and ZLD systems spread.
Industrial Wastewater Treatment Equipment Industry Leaders
Veolia Water Technologies
SUEZ SA
Xylem Inc.
Gradiant Corporation
Ecolab Inc.
- *Disclaimer: Major Players sorted in no particular order

Recent Industry Developments
- May 2026: De Nora signed a Share Purchase Agreement to acquire 100% of BW Water Pte. Ltd. from BW Renewables and Opal Environmental Solutions at an enterprise value of USD 61.5-66.5 million, financed via a EUR 60 million (USD 64.8 million) term loan facility. BW Water's 2025 revenues reached USD 91.5 million, with a USD 190 million backlog. The combined Water Technologies Systems backlog will exceed EUR 350 million (USD 378 million).
- April 2026: Veolia announced a partnership with Amazon to develop a reclaimed-water cooling system for Amazon data centers in Mississippi. The first facility is expected to be operational in 2027 and will reuse over 83 million gallons of potable water annually. The collaboration also includes Amazon Web Services (AWS) co-developing AI-enhanced solutions for real-time process optimization across Veolia's global water treatment network.
- April 2026: Veolia completed the acquisition of Enviropacific, an Australian PFAS remediation and industrial services specialist, consolidating Veolia's PFAS treatment capability across remediation, treatment, and concentrate management in the Asia-Pacific region and reinforcing its global PFAS service portfolio.
- April 2026: Kurita Water Industries invested in Cyclopure Inc. and secured exclusive US sales rights for DEXSORB, a plant-derived beta-cyclodextrin PFAS adsorbent, to accelerate PFAS treatment deployment in US industrial and municipal water applications. Kurita America is overseeing construction of an industrial-scale DEXSORB regeneration plant in Michigan.


Global Industrial Wastewater Treatment Equipment Market Report Scope
The Industrial Wastewater Treatment Equipment Report is Segmented by Equipment Type (Clarifiers and Dissolved Air Flotation Systems, Membrane Systems, Biological Treatment Equipment, Chemical Treatment Equipment, Sludge Handling and Dewatering Equipment, Filtration and Separation Equipment, Evaporation and Crystallization Systems), Process Stage (Primary Treatment, Secondary Treatment, Tertiary and Advanced Treatment, Resource Recovery and Water Re-use), End-Use Industry (Oil and Gas, Food and Beverage, Power Generation, Chemicals and Petrochemicals, Pulp and Paper, Mining and Metals, Pharmaceuticals, Semiconductors and Electronics, Textiles, Other End-Use Industries), Capacity (Less than 1,000; 1,000–10,000; Above 10,000 m³/day), Service Mode (New Installation, Retrofit and Up-gradation, and Mobile/Rental Units), and Geography (North America, South America, Europe, Asia-Pacific, and Middle East and Africa). The Market Forecasts are Provided in Terms of Value (USD).
| Clarifiers and Dissolved Air Flotation Systems |
| Membrane Systems |
| Biological Treatment Equipment |
| Chemical Treatment Equipment |
| Sludge Handling and Dewatering Equipment |
| Filtration and Separation Equipment |
| Evaporation and Crystallization Systems |
| Primary Treatment |
| Secondary Treatment |
| Tertiary and Advanced Treatment |
| Resource Recovery and Water Re-use |
| Oil and Gas |
| Food and Beverage |
| Power Generation |
| Chemicals and Petrochemicals |
| Pulp and Paper |
| Mining and Metals |
| Pharmaceuticals |
| Semiconductors and Electronics |
| Textiles |
| Other End-Use Industries |
| Less than 1,000 |
| 1,000 -10,000 |
| Above 10,000 |
| New Installation |
| Retrofit and Up-gradation |
| Mobile / Rental Units |
| North America | United States | |
| Canada | ||
| Mexico | ||
| South America | Brazil | |
| Argentina | ||
| Rest of South America | ||
| Europe | Germany | |
| United Kingdom | ||
| France | ||
| Italy | ||
| Spain | ||
| Rest of Europe | ||
| Asia-Pacific | China | |
| Japan | ||
| India | ||
| South Korea | ||
| ASEAN | ||
| Rest of Asia-Pacific | ||
| Middle East and Africa | Middle East | Saudi Arabia |
| United Arab Emirates | ||
| Turkey | ||
| Rest of the Middle East | ||
| Africa | South Africa | |
| Nigeria | ||
| Rest of Africa | ||
| By Equipment Type | Clarifiers and Dissolved Air Flotation Systems | ||
| Membrane Systems | |||
| Biological Treatment Equipment | |||
| Chemical Treatment Equipment | |||
| Sludge Handling and Dewatering Equipment | |||
| Filtration and Separation Equipment | |||
| Evaporation and Crystallization Systems | |||
| By Process Stage | Primary Treatment | ||
| Secondary Treatment | |||
| Tertiary and Advanced Treatment | |||
| Resource Recovery and Water Re-use | |||
| By End-Use Industry | Oil and Gas | ||
| Food and Beverage | |||
| Power Generation | |||
| Chemicals and Petrochemicals | |||
| Pulp and Paper | |||
| Mining and Metals | |||
| Pharmaceuticals | |||
| Semiconductors and Electronics | |||
| Textiles | |||
| Other End-Use Industries | |||
| By Capacity (m³/day) | Less than 1,000 | ||
| 1,000 -10,000 | |||
| Above 10,000 | |||
| By Service Mode | New Installation | ||
| Retrofit and Up-gradation | |||
| Mobile / Rental Units | |||
| By Geography | North America | United States | |
| Canada | |||
| Mexico | |||
| South America | Brazil | ||
| Argentina | |||
| Rest of South America | |||
| Europe | Germany | ||
| United Kingdom | |||
| France | |||
| Italy | |||
| Spain | |||
| Rest of Europe | |||
| Asia-Pacific | China | ||
| Japan | |||
| India | |||
| South Korea | |||
| ASEAN | |||
| Rest of Asia-Pacific | |||
| Middle East and Africa | Middle East | Saudi Arabia | |
| United Arab Emirates | |||
| Turkey | |||
| Rest of the Middle East | |||
| Africa | South Africa | ||
| Nigeria | |||
| Rest of Africa | |||


Key Questions Answered in the Report
What is the 2031 value of the industrial wastewater treatment equipment market?
The industrial wastewater treatment equipment market is forecast to reach USD 24.76 billion by 2031, up from USD 15.64 billion in 2025, at a CAGR of 7.76% over 2026-2031.
Which region leads global demand for industrial wastewater treatment equipment?
Asia-Pacific led with 38.96% of the market in 2025, supported by broad industrial activity across China, India, Japan, and South Korea.
Which equipment category holds the largest share in industrial wastewater treatment systems?
Membrane systems led the equipment mix with 31.67% of the market in 2025 because they are widely used in reuse, polishing, and high-purity treatment applications.
Which process stage is growing the fastest in industrial wastewater treatment projects?
Resource recovery and water reuse is the fastest growing process stage, with an 8.45% CAGR through 2031, showing a wider move toward reclaimed water and circular-water economics.
Why are semiconductor plants becoming an important source of wastewater treatment demand?
Semiconductor and electronics are the fastest growing end-use vertical at an 8.83% CAGR through 2031, driven by fab expansion and rising PFAS discharge scrutiny.
What is changing in how industrial buyers procure wastewater treatment solutions?
New installation still dominated with 64.76% share in 2025, but mobile and rental units are growing fastest at 8.76% CAGR, which points to more flexible and service-based procurement models.
Page last updated on:


