
Market Overview
| Study Period | 2020 - 2031 |
|---|---|
| Market Size (2026) | USD 50.46 Billion |
| Market Size (2031) | USD 63.45 Billion |
| Growth Rate (2026 - 2031) | 4.69 % |
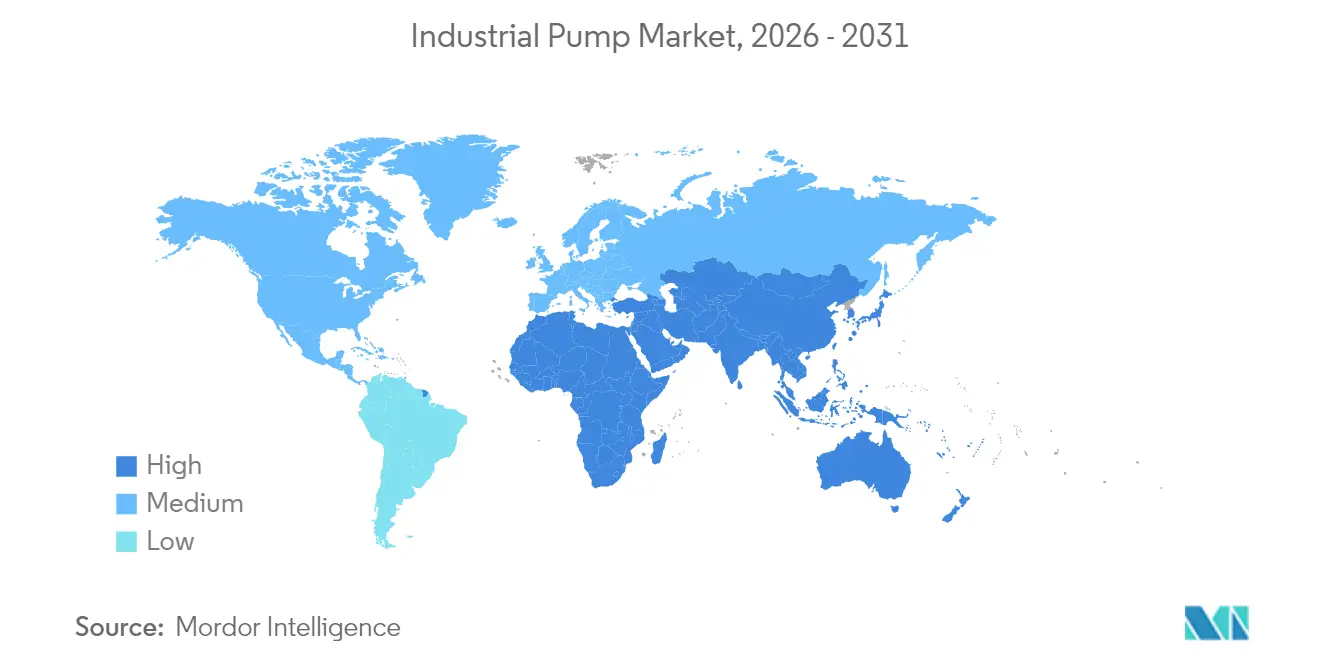
| Fastest Growing Market | Middle East and Africa |
| Largest Market | Asia Pacific |
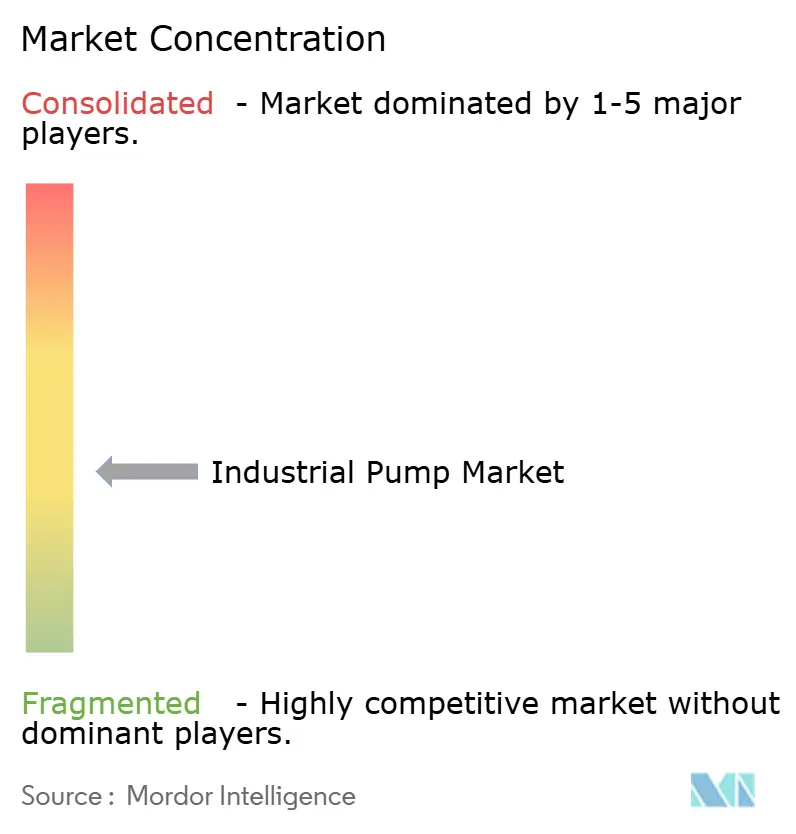
| Market Concentration | Medium |
Major Players *Disclaimer: Major Players sorted in no particular order Image © Mordor Intelligence. Reuse requires attribution under CC BY 4.0. | |
Industrial Pump Market Analysis by Mordor Intelligence
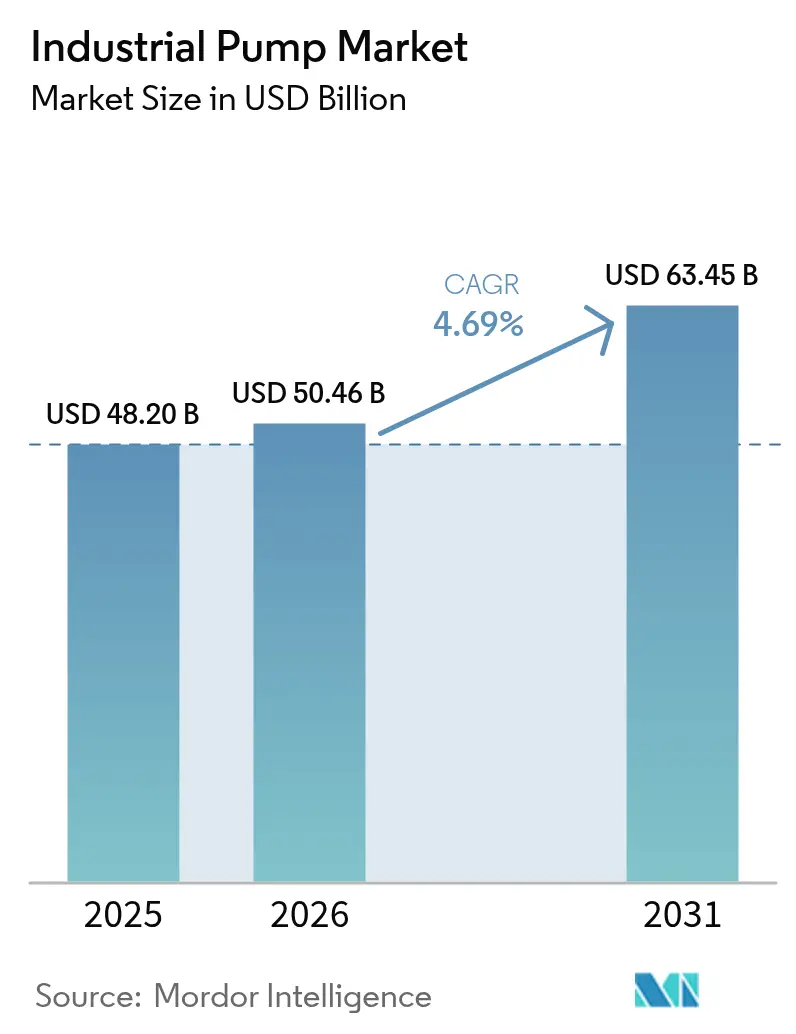
The industrial pump market size was valued at USD 48.2 billion in 2025 and estimated to grow from USD 50.46 billion in 2026 to reach USD 63.45 billion by 2031, at a CAGR of 4.69% during the forecast period (2026-2031). Sustained replacement of aging municipal networks, petrochemical capacity additions, and tighter efficiency rules underpinned the market’s resilience through prolonged supply-chain volatility. Capital spending on water treatment remained the single largest pull-forward of demand, with the United States alone earmarking more than USD 50 billion for water infrastructure upgrades between 2022 and 2026. Mega-projects in Qatar and Saudi Arabia continued to lift orders for high-specification pumps capable of handling corrosive, high-temperature media in ethylene crackers and gas-processing trains. Asia-Pacific retained volumetric leadership on the back of large-scale industrialization across China, India, and Southeast Asia, while the Middle East and Africa posted the fastest growth trajectory as petrochemical diversification accelerated.
Key Report Takeaways
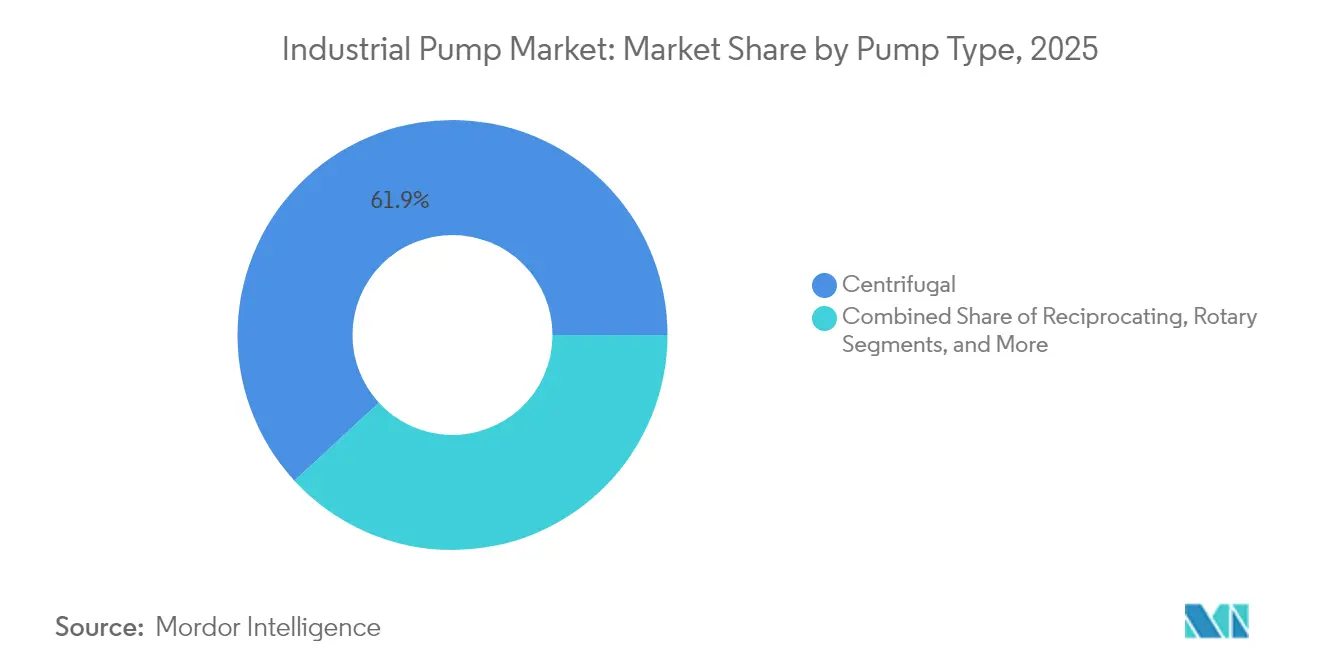
- By pump type, centrifugal designs led with 61.85% revenue share in 2025; progressing cavity pumps are forecast to expand at a 7.45% CAGR through 2031.
- By power source, electric-driven systems held 77.95% of the industrial pump market share in 2025, whereas solar-powered units are projected to grow at an 11.1% CAGR to 2031.
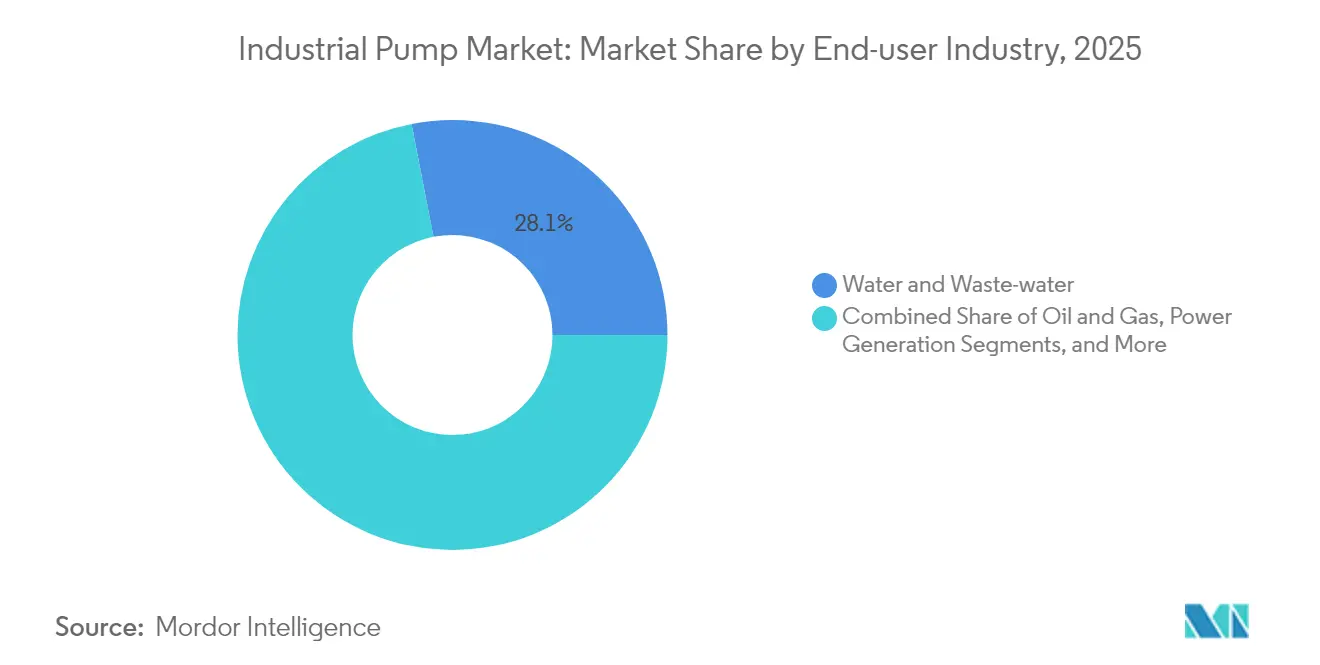
- By end-user industry, water and wastewater applications captured 28.05% share of the industrial pump market size in 2025; chemicals and petrochemicals are advancing at a 6.48% CAGR to 2031.
- By orientation, submersible units commanded 30.75% of 2025 revenue; surface pumps are on track for a 9.85% CAGR through 2031.
- By geography, Asia-Pacific accounted for 44.85% of 2025 revenue; the Middle East and Africa region is growing at a 6.05% CAGR to 2031.
Note: Market size and forecast figures in this report are generated using Mordor Intelligence’s proprietary estimation framework, updated with the latest available data and insights as of 2026.
Market Trends and Insights
Drivers Impact Analysis of Industrial Pump Market*
| Driver | (~) % Impact on CAGR Forecast | Geographic Relevance | Impact Timeline |
|---|---|---|---|
| Rising water and wastewater treatment spending globally | +1.8% | Global, with a concentration in North America and Europe | Medium term (2-4 years) |
| Expansion of petrochemical capacity in MEA | +1.2% | Middle East and Africa, spillover to Asia-Pacific | Long term (≥ 4 years) |
| Rapid industrial infrastructure build-out across Asia-Pacific | +1.5% | Asia-Pacific core, secondary impact in South America | Medium term (2-4 years) |
| Demand for corrosion-resistant pumps in green-hydrogen electrolyzers | +0.7% | Global, early adoption in Europe and North America | Long term (≥ 4 years) |
| Predictive-maintenance IoT service models unlocking aftermarket revenue | +0.9% | Global, led by developed markets | Short term (≤ 2 years) |
| Source: Mordor Intelligence | |||
Rising Water and Wastewater Treatment Spending Globally
Record municipal budgets released in 2024 and early 2025 translated into larger tender volumes for high-capacity centrifugal and submersible sewage pumps. The US Environmental Protection Agency estimated long-term rehabilitation needs above USD 744 billion, prompting multi-phase upgrades such as Sioux City’s USD 465 million regional facility and Cape Fear’s USD 239 million Southside plant. Advanced treatment mandates drove interest in high-pressure reverse-osmosis trains, with Sulzer’s vertical multistage systems underpinning Egypt’s Al Mahsama drainage reclamation project.[1]Mary Scott Nabers, “A Multi-Billion-Dollar Water Industry Segment Not To Be Overlooked,” Water Online, wateronline.com Utilities are increasingly embedding wireless sensors that stream vibration and temperature data into cloud dashboards, shortening mean-time-to-repair on critical units. Procurement frameworks began weighting total-cost-of-ownership calculations that favor energy-efficient designs, nudging buyers toward premium efficiency motors that comfortably clear EU MEI thresholds. Heightened monitoring obligations also expanded aftermarket revenue pools, anchoring recurring service contracts for OEMs.
Expansion of Petrochemical Capacity in MEA
Gulf producers pushed downstream diversification agendas, awarding EPC contracts for crackers, polymer units, and gas-processing trains that collectively require thousands of corrosion-resistant pumps. Qatar’s Ras Laffan polymers complex, budgeted at USD 6 billion, incorporated a 2,080 KTA ethane cracker slated for 2027 on-stream dates. Saudi Arabia’s USD 11 billion Amiral project added 1.65 million tons of ethylene nameplate capacity integrated with SATORP’s refinery, multiplying demand for API 610 compliant pumps that withstand 400°F discharge temperatures. Local-content clauses inside procurement tenders intensified incentives for international OEMs to localize casing machining and final assembly. End-users prioritized variable-frequency drives to curb power draw, reinforcing adoption of smart motor controls that align with regional energy-efficiency ambitions.
Rapid Industrial Infrastructure Build-out Across Asia-Pacific
China’s SABIC-backed USD 6.4 billion Fujian complex and India’s ongoing Smart Cities Mission channeled funding into water, energy, and manufacturing assets, each a pull-through for the industrial pump market. Automated production lines demanded digitally controlled dosing and transfer pumps able to interface with factory IT networks. Mining houses in Indonesia and Mongolia increased procurement of high-chromium slurry pumps to manage tailings with solids content above 20%. Simultaneously, desalination plants in Australia contracted high-pressure multistage units designed for 70 bar feed pressures, reflecting rising water scarcity. Regional buyers proved receptive to pay-per-use service models that bundle analytics-driven maintenance, unlocking new subscription revenue for OEMs. Carbon-pricing schemes in South Korea and Japan further incentivized the adoption of pumps rated at higher wire-to-water efficiency, pressing suppliers to iterate hydraulic designs rapidly.
Demand for Corrosion-Resistant Pumps in Green-Hydrogen Electrolyzers
Electrolyzer installations surged from pilot scale to multi-megawatt arrays in Europe and North America, spurring an emergent niche for pumps fabricated from 316L stainless, super-duplex, and advanced polymer coatings. Process engineers required circulation systems that tolerate highly corrosive electrolytes while managing flow fluctuations within ±2%. Suppliers like Fluid Components International introduced SIL-2 certified flow switches tailored for PEM stacks, while IHI developed specialized bipolar-plate coatings that maintain low interfacial resistance at 30 bar operating pressures. As project developers chased levelized-hydrogen-cost targets, pump efficiency and uptime became differentiators shaping vendor shortlists. Although volumes remain modest, first-mover suppliers established reference plants that are expected to translate into follow-on orders as hydrogen hubs scale toward gigawatt levels.
Restraints Impact Analysis of Industrial Pump Market*
| Restraint | (~) % Impact on CAGR Forecast | Geographic Relevance | Impact Timeline |
|---|---|---|---|
| Volatility in steel and copper prices is inflating TCO | -0.8% | Global, particularly affecting manufacturing hubs | Short term (≤ 2 years) |
| Stricter pump-efficiency directives are delaying cap-ex cycles | -0.6% | Europe and North America, expanding globally | Medium term (2-4 years) |
| Shift to motorless gravity micro-irrigation systems in arid economies | -0.3% | Middle East, North Africa, and arid regions globally | Long term (≥ 4 years) |
| Source: Mordor Intelligence | |||
Volatility in Steel and Copper Prices Inflating TCO
Copper cleared USD 10,000 per metric ton in 2024 and flirted with USD 11,000 amid looming supply deficits, hiking producer input costs by 3.5%–4.2% on copper-intensive stators and windings. Carbon-neutral steel initiatives added further unpredictability as mills passed on green-premium surcharges linked to hydrogen-based production. Manufacturers responded by tightening hedging programs, redesigning casings for material thrift, and introducing dynamic price clauses into supply contracts. End-users, meanwhile, deferred discretionary replacements, stretching the mean equipment life and tempering near-term shipment volumes in the industrial pump market.
Stricter Pump-Efficiency Directives Delaying Cap-ex Cycles
The European Union’s MEI amendments under Regulation 547/2012 entered into enforcement in late 2024, while the US Department of Energy retained stringent Pump Efficiency Rating thresholds referenced in 10 CFR Part 431. Legacy designs struggled to pass mandated wire-to-water benchmarks, compelling OEMs to invest in new hydraulic geometries and expanded test-stand capacity. Certification backlogs extended product launch timelines, and end-users postponed purchases pending the availability of compliant models. Small regional fabricators lacking laboratory facilities risked market exit, accelerating consolidation trends that favored multinational brands with deep engineering benches.
*Our forecasts treat driver/restraint impacts as directional, not additive. The impact forecasts reflect baseline growth, mix effects, and variable interactions.
Industrial Pump Market Segment Analysis
By Pump Type:
Centrifugal Dominance Faces Specialty ChallengesCentrifugal units retained 61.85% of 2025 revenue, anchoring the industrial pump market through their proven cost-performance balance in water supply, chemical transfer, and HVAC loops. The segment generated steady aftermarket volumes, given typical mean-time-between-overhauls of three years in municipal duty cycles. However, specialty demands in viscous slurry handling shifted incremental share toward progressing cavity designs, which are projected to clock 7.45% CAGR through 2031. The progressing cavity cohort captured a rising slice of the industrial pump market size for petrochemical and mining customers that prize low-shear conveyance. Meanwhile, reciprocating and diaphragm pumps preserved critical roles in high-pressure injection and sanitary production, respectively, albeit with niche footprints. IoT retrofits became common even on legacy centrifugal sets, enabling predictive vibration analytics that cut unscheduled downtime by up to 30%.
Progressing cavity manufacturers invested heavily in wear-resistant rotor coatings to extend service intervals beyond 8,000 hours under abrasive duty. Rotary gear and peristaltic pumps addressed emerging micro-dosing tasks within battery-materials manufacturing lines, underscoring the breadth of end-use innovation. Digital twins built from sensor telemetry allowed operators to simulate cavitation risk across the hydraulic envelope, driving process-control refinements that protect impellers. Suppliers continued to emphasize modular cartridge seals that simplify maintenance and shrink spare inventory. With regulatory spotlight fixed on energy intensity, efficiency upgrades in casing volutes and diffuser vanes became a competitive must-have across all pump types in the broader industrial pump market.



By Power Source:
Electric Hegemony Challenged by Solar InnovationElectric-driven assemblies held a commanding 77.95% share in 2025, benefitting from near-universal grid access in industrialized economies and the incremental efficiency yields of variable-frequency drives. Field data logged by Graco’s QUANTM platform demonstrated up to 85% motor efficiency thanks to transverse-flux topology, reinforcing the narrative of electricity-based lifecycle cost advantage. Solar-powered solutions, however, emerged as the fastest expanding slice of the industrial pump industry, advancing at an 11.1% CAGR on the back of rural irrigation projects in Africa and South Asia. Installation costs ranging from EUR 76.23 (USD 89.13) to EUR 1,219.59 (USD 1,425.95) translated to competitive levelized costs, particularly once fuel-logistics premiums on diesel sets were factored in.
Diesel-engine packages retained strategic relevance for oilfield fracturing and emergency stormwater evacuation, where grid resilience remained questionable. Hydraulic and pneumatic drives continued to serve hazardous-area placements and mobile plant equipment that prized power density and ignition safety. Hybrid microgrid solutions that pair PV arrays with lithium-ion storage entered the pilot stage at several Indonesian mines, offering 24/7 uptime without diesel supplementation. VFD retrofits on existing electric fleets shaved energy bills by up to 20% in continuous-duty desalination applications. Altogether, the power-source mix illustrated end-user pragmatism, but electric leadership in the industrial pump market is expected to persist through the forecast horizon.
By End-user Industry:
Water Treatment Leads Amid Chemical Sector SurgeMunicipal and industrial water operators commanded 28.05% of total 2025 revenue, underscoring the sector’s status as the backbone of the industrial pump market. Ongoing replacement of aging cast-iron pumps with corrosion-resistant duplex steel variants intensified as utilities sought longer asset lifecycles against rising salinity loads in coastal aquifers. The chemicals and petrochemicals segment, meanwhile, charted a brisk 6.48% CAGR for the rest of the decade, buoyed by mega-scale ethylene, polypropylene, and aromatics plants that call for thousands of process and utility pumps. Large cracker sites often specify single-stage overhung designs for lighter hydrocarbons and multistage radials for high-head reformate circulation, driving high-mix production runs at OEM factories.
Oil and gas, despite volatile CAPEX cycles, continued to represent a significant aftermarket revenue stream given stringent uptime requirements on injection, transfer, and loading pumps. Power generation owners shifted investment toward closed-loop cooling pumps compatible with advanced ultra-supercritical boilers and toward molten-salt pumps in emerging concentrated solar power plants. Mining operations prioritized robust slurry pumps with elastomer-lined casings; downtime on a single dewatering train could stall mill throughput worth USD 0.5 million a day. Food and beverage processors requested hygienic centrifugal and lobe designs to align with FSMA rules, while pharmaceutical manufacturers leaned on diaphragm pumps offering validated clean-in-place regimes. Digital service overlays cut across all verticals, turning raw operating data into predictive work orders and reinforcing service revenue stickiness for tier-one vendors within the industrial pump market.
By Pump Orientation:
Submersible Advantage Meets Surface InnovationSubmersible equipment captured 30.75% of 2025 sales, its compact footprint and noise suppression proving invaluable in dense urban utilities and underground mines. Sealed motors shielded by oil-filled chambers exhibited strong reliability, yet in-situ repairs remained expensive, pushing operators to adopt wireless temperature probes that signal seal failures before catastrophic ingress occurs. Surface-mounted pumps, though historically maintenance-friendly, benefited from a recent wave of design improvements that narrowed noise and vibration gaps while retaining easy access. Their quicker mean-time-to-repair contributed to an anticipated 9.85% CAGR, overtaking submersibles in incremental volume growth.
Sulzer expanded its Easley, South Carolina facility in 2024 to localize submersible grinder pumps meeting Build America Buy America criteria, reflecting public-sector preference for domestically sourced equipment. Concurrently, surface-pump makers integrated composite wear rings and split-case construction to curb leakage losses and simplify impeller extraction. Both orientations adopted edge analytics modules that process vibration spectrums locally, minimizing bandwidth needs while still flagging anomalies through cloud dashboards. End-users increasingly deployed mixed fleets, opting for submersibles in space-constrained shafts and surface units where footprint allowed standard maintenance bays. This pragmatic blend reinforced the diversified, application-led nature of demand that characterizes the industrial pump market.
Geography Analysis
APAC Industrial Pump Market
Asia-Pacific dominated with 44.85% revenue in 2025 after decades of industrial build-out, extensive municipal upgrades, and policy-driven manufacturing localization. New ethylene cracker complexes in Fujian and large-scale desalination schemes in Australia magnified the procurement of high-efficiency multistage pumps. China’s stimulus for wastewater reuse and India’s Production Linked Incentive program for chemicals continued to channel orders toward both global and domestic pump manufacturers. Regulatory pushes around electricity intensity and carbon footprints incentivized operators to retrofit VFDs, nudging market volume toward premium-efficiency product lines within the industrial pump market.
North America, EMEA and LATAM Industrial Pump Market
The Middle East and Africa posted the fastest 6.05% CAGR, propelled by USD 17 billion in combined petrochemical investments across Saudi Arabia, Qatar, and the United Arab Emirates. Desalination, such as NEOM’s 1 million m³/day seawater project, demanded high-pressure duplex-steel pumps tolerant to chloride stress-corrosion. African mining expansions in Zambia and the Democratic Republic of Congo increased orders for abrasion-resistant slurry units. Local content frameworks pushed OEMs to open service hubs in Oman and South Africa, shortening turnaround times on overhauls and reinforcing brand loyalty. North America experienced a steady replacement cycle driven by water infrastructure bills, with California, Texas, and Florida aggregating the bulk of tenders for replacement centrifugal and vertical turbine pumps. Energy policy incentives supported early adoption of hydrogen electrolysis, sparking niche orders for corrosion-resistant circulation pumps. Europe’s stringent MEI regulations stimulated demand for ultra-high-efficiency designs and encouraged plant owners to reassess total-cost-of-ownership metrics. Latin America, though smaller, witnessed steady uptake in agricultural irrigation pumps and mining-related demand in Chile and Peru. Across all regions, digital service propositions featuring predictive maintenance became a decisive factor in bid evaluations, further shaping competitive standings in the industrial pump market.

Regulatory Landscape
Industrial pump suppliers operate under tightening energy-efficiency and sustainability rules that shape product design, testing, and certification timelines. In the European Union, Commission Regulation (EU) No 547/2012 sets Minimum Efficiency Index (MEI) thresholds for rotodynamic clean-water pumps, while circulators fall under separate ecodesign requirements (Commission Regulation (EC) 641/2009). The direction toward broader lifecycle requirements is reinforced by Regulation (EU) 2024/1781, adopted in June 2024, which establishes a new framework for ecodesign requirements for sustainable products and lifts compliance beyond hydraulic efficiency into durability and sustainability attributes.
In the United States, pump-related energy conservation requirements are codified under 10 CFR Part 431, including 10 CFR 431.465 for certain commercial and industrial pump categories. The DOE also finalized new energy conservation standards for circulator pumps on May 20, 2024, with mandatory compliance for units manufactured or imported on or after May 22, 2028. These multi-year compliance runways support OEM investment in test-stand capacity, documentation, and redesign cycles, and they can affect replacement timing as end users wait for fully compliant model lineups.
Value Chain Analysis
The industrial pump value chain begins with raw materials and engineered inputs, including steel and specialty alloys, castings and forgings, copper windings and motors, mechanical seals, bearings, electronics, and variable-frequency drives (with ABB, Danfoss, and Siemens commonly specified for pump-control applications). Value is added through hydraulic design and validation, casting and machining of casings and impellers, motor and drive integration, assembly, testing and certification, and packaging. Distribution then splits between direct OEM sales to EPCs and industrial end users, channel partners and distributors for standard product lines, and project-oriented delivery for high-spec pumps used in petrochemicals, desalination, and large municipal assets.
Aftermarket services are a central profit pool, covering field commissioning, spares, seal and bearing replacement, repair and overhaul, and digital condition monitoring that feeds predictive-maintenance contracts. In 2026, long-term procurement agreements in Saudi Arabia, such as Corporate Procurement Agreements signed by Celeros Flow Technology (February 2026) and Sulzer (May 2026), show how localization and lifecycle support are being pulled further upstream into sourcing decisions. The chain is also sensitive to trade and capacity constraints: VDMA flagged that an EU anti-subsidy investigation into Chinese industrial pumps and valves contributed to customs and logistics delays in 2026, and manufacturing capacity limits in traditional foundry and other large-component supply can extend lead times for large pumps and control valves beyond 180 days, which pushes OEMs and buyers toward alternative machining strategies and more regionalized sourcing.
Competitive Landscape
Competition remained moderately fragmented as global leaders vied with strong regional specialists that supplied application-tailored solutions and swift aftermarket responses. Honeywell’s acquisition of Sundyne in March 2025 added a premium API 610 and integrally geared turbopump portfolio to its line-up, cementing a broader critical-equipment play. Grundfos similarly bolstered its European footprint through the EUR 100 million (USD 116.92 million) takeover of Culligan’s Commercial and Industrial arm, expanding water-treatment competence across three major EU markets.[4]“Grundfos To Acquire The Commercial & Industrial Business Of Culligan,” Grundfos, grundfos.com Xylem, meanwhile, posted USD 2.1 billion in Q1 2025 revenue on the back of differentiated digital offerings that integrate smart sensors with cloud analytics, a capability that sharpened its competitive edge in retrofit projects.
Tier-one OEMs doubled down on predictive-maintenance platforms—Grundfos Machine Health and Sulzer Sense—leveraging machine-learning models to forecast bearing failures weeks in advance. The pivot elevated service margins and deepened customer stickiness, particularly in mission-critical water and chemical plants where downtime costs run into millions per day. Consolidation also trickled into the mid-tier segment: Atlas Copco acquired Kracht GmbH, and ITT folded in Danish marine-pump specialist Svanehøj, signaling appetite for niche technologies that round out cross-industry portfolios. Suppliers without digital or energy-efficient credentials lost share to innovators that blended hardware, sensors, and cloud platforms in cohesive packages—a trend that is expected to persist as ESG metrics steer procurement in the industrial pump market.
Strategic alliances emerged between pump makers and material science companies to fast-track corrosion-resistant alloys destined for green-hydrogen applications. Sulzer partnered with Outokumpu to qualify super-duplex grades against upcoming ISO 19880-3 hydrogen-compatibility standards. Elsewhere, Graco licensed transverse-flux motor patents from a European research consortium to accelerate its high-efficiency roadmap. Competitive intensity was fiercest in commoditized centrifugal lines where local producers maintained cost advantages; premium niches such as electrolyzer circulation and high-pressure reverse-osmosis feed pumps offered healthier margins and insulation from price wars. Overall, the industrial pump market rewarded companies capable of pairing energy-saving designs with data-driven service models.
Industrial Pump Industry Leaders
Flowserve Corporation
Grundfos Holding A/S
KSB AG
Sulzer Ltd
Weir Group PLC,
- *Disclaimer: Major Players sorted in no particular order
Industrial Pump Market Companies Covered in this Report
- Flowserve Corporation
- Grundfos Holding A/S
- Xylem Inc.
- Sulzer Ltd.
- KSB SE & Co. KGaA
- ITT Inc.
- Ebara Corporation
- The Weir Group PLC
- Schlumberger NV (REDA Pump)
- Baker Hughes Company
- SPX FLOW Inc.
- Wilo SE
- Dover Corporation
- Pentair plc
- Franklin Electric Co. Inc.
- Tsurumi Manufacturing Co. Ltd.
- Kirloskar Brothers Ltd.
- Atlas Copco AB
- Ruhrpumpen Group
- Zoeller Company
- Roto Pumps Ltd.
- Gardner Denver LLC (Ingersoll Rand)
- ClydeUnion Pumps (Celeros Flow Tech)
- LEWA GmbH
- Graco Inc.

Market Opportunities and Future Outlook
Energy-efficiency compliance and total-cost-of-ownership procurement are creating whitespace for premium-efficiency pump trains that integrate hydraulics, motors, and drives, with digital monitoring increasingly used to support performance verification. The EU MEI framework under Regulation 547/2012 and US requirements under 10 CFR Part 431 are reinforcing demand for redesigns, test capacity, and compliant product refresh cycles, while plant standards increasingly specify VFD integration into DCS/SCADA architectures. This environment favors suppliers that can deliver compliant performance quickly and support fleets with analytics, particularly in water and wastewater where replacement programs are tied to funded infrastructure upgrades (the United States earmarked more than USD 50 billion for water infrastructure upgrades between 2022 and 2026).
Capacity localization and shorter lead-time supply are also becoming tangible opportunities as buyers rebalance sourcing amid customs friction and long component lead times. In 2026, OEM investments and expansions illustrate the direction of travel: Grundfos held a groundbreaking for a 143,000-square-foot production expansion at its Brookshire, Texas campus (with stated capacity of 75,000 units per year), NETZSCH inaugurated a new pump production facility in Goa, India, and KSB commenced a EUR 70 million expansion and modernization project at its Frankenthal, Germany Eta production facility. Alongside these moves, areas such as corrosion-resistant circulation pumps for green-hydrogen electrolyzers and high-pressure reverse-osmosis feed duties remain undersupplied relative to accelerating project activity, supporting differentiated offerings in materials, sealing, and uptime-focused service models.
Recent Industry Developments in Industrial Pump Market
- June 2026: Flowserve completed the acquisition of Trillium Flow Technologies Valves Division for USD 490 million (plus working capital adjustments), excluding the French valves operations. The transaction expands Flowserve’s flow-control footprint in critical service applications and increases cross-selling leverage into pump-adjacent projects that bundle valves, seals, and aftermarket services.
- March 2025: Honeywell announced the acquisition of Sundyne, adding API 610 and integrally geared turbopump capabilities to its portfolio. The move strengthens participation in high-spec petrochemical and refinery services where engineered pumps and lifecycle support contracts are commonly awarded together.
- April 2024: Saudi Aramco awarded USD 7.7 billion in EPC contracts for the Fadhili Gas Plant expansion, increasing demand for specialized process and utility pumps across gas-processing trains. Large upstream and midstream projects of this type typically pull through API-compliant pump packages, spares provisioning, and local service capacity requirements.


Industrial Pump Market Report Scope and Research Methodology
Market Definition and Coverage
For this study, the industrial pump market covers mechanical equipment used to move liquids within industrial and utility settings, along with the related packaged supply for those applications. Revenue is counted at the point of sale for pumps used across process, water handling, and similar duty cycles.
Scope exclusions: It excludes compressors and purely pneumatic conveying equipment, and it also excludes service-only revenue when no pump equipment is supplied.
Segments Covered in This Report
- By Pump Type
- Centrifugal
- Reciprocating
- Rotary
- Diaphragm
- Progressing Cavity
- Others
- By Power Source
- Electric
- Diesel
- Solar
- Hydraulic
- Pneumatic
- By End-user Industry
- Oil and Gas
- Water and Waste-water
- Chemicals and Petrochemicals
- Power Generation
- Mining
- Food and Beverage
- Pharmaceuticals
- Pulp and Paper
- Others
- By Pump Orientation
- Submersible
- Surface
- By Geography
- North America
- United States
- Canada
- Mexico
- South America
- Brazil
- Argentina
- Rest of South America
- Europe
- Germany
- United Kingdom
- France
- Italy
- Russia
- Rest of Europe
- Asia-Pacific
- China
- Japan
- South Korea
- India
- Taiwan
- Rest of Asia-Pacific
- Middle East and Africa
- Middle East
- Turkey
- Israel
- GCC Countries
- Rest of Middle East
- Africa
- South Africa
- Nigeria
- Rest of Africa
- Middle East
- North America
Data Sources, Market Sizing, and Validation
Desk Research
Desk research is used to map the demand pools and make sure we are not missing major end markets where pumps are installed and replaced. We rely on public sources such as USGS and other national geology and mining statistics, the International Energy Agency for energy and power indicators, World Bank and OECD infrastructure and industrial output series, and UN Comtrade for trade flows that help validate supply availability by region.
We also review supplier annual reports, investor presentations, regulatory and standards references where efficiency rules apply, and credible press coverage of water and petrochemical capex cycles. In a few places, paid subscriptions for company financials and news are used to cross-check revenue direction and timing, and an import and export shipment-level database is used selectively to sanity-check cross-border movements for pump and parts categories. These desk sources are illustrative only, and many other public documents were reviewed to collect, validate, and clarify data points.
Primary Interviews and Surveys
Primary discussions are used to pressure-test assumptions that cannot be read directly from public data, especially pricing bands, replacement shares, and where demand is shifting across end users. We spoke with a mix of manufacturers, distributors, EPC-linked participants, and large end users across APAC, EMEA, and the Americas so that regional industrial cycles and water infrastructure priorities could be reflected in the final model.
Distribution of primary research fieldwork respondents
| Company type | Respondent position | Region |
|---|---|---|
| Top tier: 30% | CXOs: 12% | APAC: 44% |
| Mid tier: 48% | Functional/Unit leaders: 31% | EMEA: 35% |
| Smaller Players: 22% | Managers: 57% | Americas: 21% |
Market-Sizing & Forecasting
Sizing starts from a top-down build where industrial activity and infrastructure indicators are used to reconstruct a realistic pump demand pool by region, then the value is allocated across the main industrial end uses. To keep totals grounded, the model is corroborated through selective bottom-up checks such as sampled average selling price ranges multiplied by estimated unit demand in key end uses, followed by channel discussions that help adjust the split.
A few inputs that materially move the model include oil and gas upstream and downstream project activity, municipal water and wastewater capex intensity, mining output direction, power generation additions, and replacement timing linked to installed base age and energy-efficiency rules. Where bottom-up visibility is weaker, for example smaller local supply or mixed-use packaged systems, gaps are handled using trade and industrial production proxies, and then the implied values are validated through primary feedback. Forecasting is done using scenario analysis supported by near-term project pipelines and medium-term macro indicators, and the scenarios are narrowed using the consensus ranges heard from industry respondents.
Data Validation & Update Cycle
Validation is done in steps so the market totals are not driven by one data series or one interview set. Model outputs are compared against independent signals such as regional trade patterns, energy and water investment direction, and supplier commentary, and then large variances are reviewed until the drivers are explainable in plain terms.
Before sign-off, the work goes through internal review checks for arithmetic consistency, unit and currency alignment, and year-over-year movements that look out of pattern. If a number changes meaningfully due to a new project wave, a regulation update, or a macro shock, respondents are re-contacted to confirm what changed and whether it impacts pricing or volumes. Reports are refreshed annually, and a final pre-delivery review is completed so clients receive the latest updated view.
Mordor Intelligence's Industrial Pump Market Size Compared With Other Published Estimates
Published market sizes for industrial pumps can look far apart even when the topic sounds identical, because each publisher counts different product boundaries and uses different price and timing assumptions. The spread typically comes from how packaged systems are treated, which adjacent fluid-handling equipment is grouped in, and how fast ASPs are assumed to move across regions.
Packaged pumping systems and skid solutions are a common driver of differences, since some estimates roll in broader fluid handling skids and accessories that lift the total. Industrial capex cycles also get translated into revenue differently, where some sources use aggressive project timing and others use a slower realization curve, and currency conversion timing can widen gaps when regions are blended. Peripheral items like spare parts, controls, and installation labor can also be included inconsistently, which is why two estimates can disagree even for the same stated year.
Benchmark comparison
| Source | Market Size | Gaps in Research Methodology |
|---|---|---|
| Mordor Intelligence | USD 48.20 B (2025) | |
| Global Consultancy A | USD 73.65 B (2025) | Uses a broader industrial pump framing that appears to count a wider set of packaged pump skids and adjacent fluid handling components, which increases the value base for the same year. |
| Industry Publisher B | USD 47.41 B (2025) | Leans more heavily on application-led coverage and may exclude some end-user pockets and packaged industrial duty pumps, which can reduce the implied demand pool in regions where multi-industry installations dominate. |
Packaged pump skids and broader fluid handling additions sit outside Mordor Intelligence's scope, which explains why one published 2025 value comes in much higher even though end-use labels look similar. After the scope is aligned, the remaining gap usually comes from how fast project pipelines are converted into revenue and how ASP movements are applied across regions, which are assumptions that can be reviewed and repeated.


Key Questions Answered in the Report
What was the industrial pump market size in 2026, and how fast will it grow?
The industrial pump market stood at USD 50.46 billion in 2026 and is forecast to expand to USD 63.45 billion by 2031 at a 4.69% CAGR.
Which pump type holds the largest share of the industrial pump market?
Centrifugal pumps led with 61.85% revenue share in 2025 due to their versatility in water, oil, and gas, and general industrial services.
Why are solar-powered pumps gaining prominence?
Solar units offer attractive economics for off-grid irrigation and remote water supply, driving an 11.1% CAGR through 2031 as renewable adoption accelerates.
Which end-user segment is expanding the fastest?
Chemicals and petrochemicals are projected to grow at a 6.48% CAGR, supported by mega-crackers and refinery integration projects in the Middle East and Asia-Pacific.
How are efficiency regulations affecting pump purchases?
EU MEI and US PER rules are pushing buyers to delay upgrades until compliant designs enter the market, temporarily lengthening capital-expenditure cycles but ultimately favoring high-efficiency pumps.
What role does digitalization play in the industrial pump industry?
IoT-based monitoring and predictive maintenance platforms reduce unplanned downtime and create high-margin service revenue, becoming a key differentiator among leading suppliers.
Page last updated on:





